


California and National Drought Summary for May 26, 2020
Summary
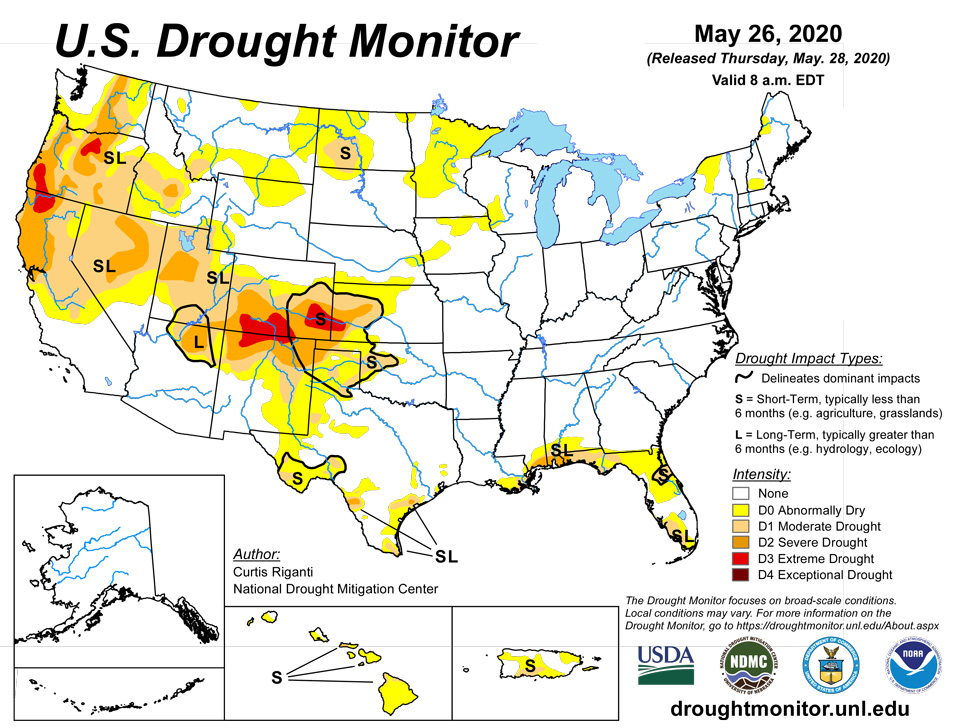
May 28, 2020 - During the past week, widespread rain and thunderstorms fell across parts of the Great Plains, including a few instances of severe weather. Particularly large amounts of rain in central and eastern Nebraska, as well as in adjacent states, improved what had been a quickly drying scenario in many locations. Above-normal precipitation also fell in parts of the Northwest, which led to improvement in parts (though not all) of the ongoing drought areas there. Large rainfall amounts also occurred in south Florida and in parts of the central Florida Panhandle, leading to improvements in or removal of drought in these locations. Widespread rain in parts of Texas also led to drought improvement in the state, though some areas that missed out on the rain (particularly in the Panhandle) saw conditions worsen. Moderate and severe drought were also added to parts of Molokai and the Big Island in Hawaii. Moderate drought coverage lessened in southern Louisiana after precipitation fell there.
Northeast
Relatively dry conditions prevailed this week in the Northeast, with most areas seeing near- or below-normal rainfall for this time of year. Temperatures ranged from generally near to below normal near the Atlantic Coast to warmer than normal, in some cases by as many as 6 to 8 degrees, farther inland and closer to the Canadian border. No drought was taking place this week in the region, though a few areas of abnormal dryness developed or persisted in areas with low recent streamflow.
Southeast
Most of the Southeast received near- or above-normal rainfall this week, particularly in North Carolina, South Carolina, western Virginia, coastal portions of the central Florida Panhandle, and South Florida. Temperatures across the region were generally near normal this week. Drought improved in parts of the Florida Panhandle and Peninsula, where heavy rains had fallen. Heavy rain in South Florida led to the removal of severe drought and some moderate drought in this area. Outside of Florida and Alabama, the Southeast remained drought-free this week.
Midwest
Above-normal temperatures occurred in the Upper Midwest this week, particularly in northern reaches of Minnesota, Wisconsin, and Michigan, where temperatures between 6 and 12 degrees warmer than normal for this week were common. Dry weather was also predominant, roughly to the north of the I-90 corridor in Wisconsin and Minnesota, while scattered moderate to heavy rain amounts could be found in parts of Missouri, Iowa, Illinois, and Indiana. Western Kentucky was dry this week, while eastern Kentucky and adjacent parts of southern and central Ohio received rain amounts ranging from 2 to 6 inches. Half an inch to two inches of rain also fell over Lower Michigan, while the Michigan Upper Peninsula was largely dry. Some areas of northern Minnesota and Wisconsin that missed out on the rain continued to dry out, and abnormal dryness developed or expanded in a few areas. However, the region remained free of drought this week.
South
Widespread precipitation fell this week across parts of central and north Texas, including parts of the Texas Panhandle. Widespread rain also fell in Oklahoma, though this missed the western part of the Oklahoma Panhandle. Rain also fell over much of Arkansas (excluding far southeast), much of Louisiana (though generally excluding the immediate Gulf Coast), and southeast Mississippi. Heavier rain (2-3 inches) also occurred in eastern Tennessee this week, although eastern Kentucky received greater amounts. Moderate drought conditions improved in parts of south-central Louisiana, where soil moisture and short-term precipitation deficits had lessened. Drought conditions improved in parts of Texas where rainfall this week lessened short-term deficits, while many areas that missed the higher rainfall amounts worsened, particularly in the drier parts of the Texas Panhandle. In Oklahoma, parts of western Oklahoma and the Panhandle that received more rainfall had improvements. However, rainfall missed the western Oklahoma Panhandle, where severe drought continues, and precipitation deficits on both short- and long-term scales have continued to worsen here.
High Plains
As several slow-moving low pressure systems crossed the region this week and weekend, areas of rain and thunderstorms were common, excluding northeast South Dakota, eastern North Dakota, and parts of the southeast Colorado high plains. Temperatures were quite variable across the region, but were generally lowest (2 to 4 degrees cooler than normal) in central Kansas and south-central Nebraska, and warmest in South Dakota and North Dakota, the latter of which had widespread temperatures from 6 to 8 degrees warmer than normal. Rain from a cluster of thunderstorms on Thursday in southwest Kansas prevented conditions from worsening there, though southwest Kansas and adjacent eastern Colorado remain very dry, and moderate, severe, and extreme drought persisted across parts of these areas. Extreme drought lessened in coverage in part of eastern Colorado due to recent rainfall and lessened short-term precipitation deficits. In northern Kansas and Nebraska, heavy rain from a series of slow-moving storm systems improved what had been abnormally dry conditions in some areas. Short-term moderate drought persisted this week in southwest North Dakota and far northwest South Dakota.
West
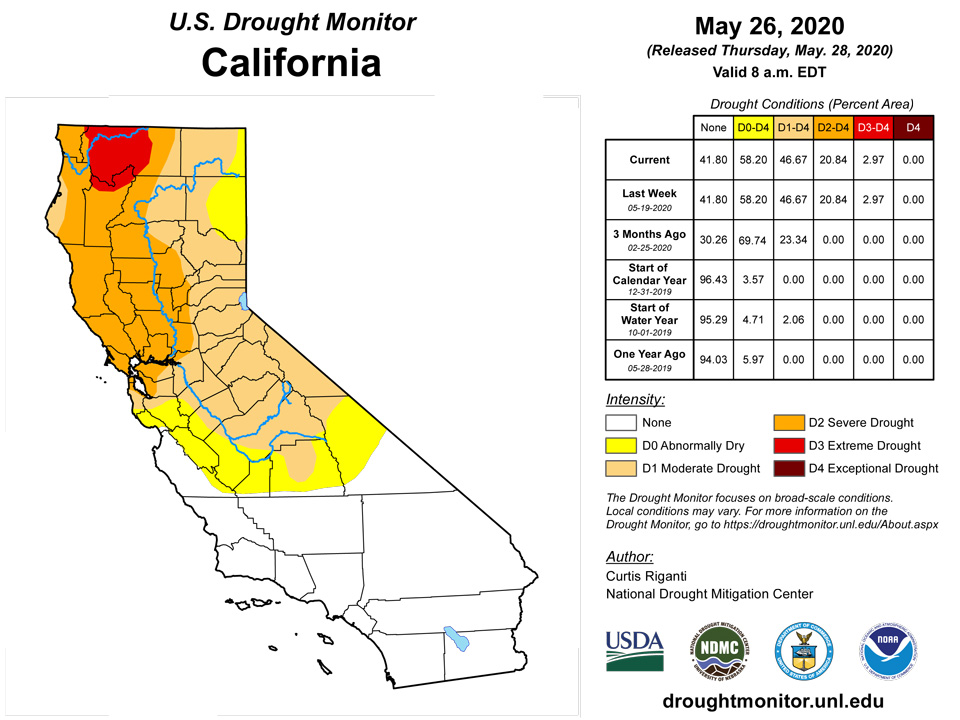
Precipitation fell this week across much of Montana (excluding southwest Montana), Idaho, eastern Oregon, parts of Washington, central and northeast Nevada, northern Utah, northwest Wyoming, central Colorado, and parts of eastern Wyoming. New Mexico was mostly dry this week, aside from a bit of rain across the far northeastern high plains. Warmer than normal temperatures could be found in coastal California, but otherwise, below-normal temperatures were common across the Intermountain West. In western Utah, severe drought expanded westward as a result of worsened short- and long-term precipitation deficits. Severe drought expanded northward in central Idaho, where streamflow had become very low in the Big Lost River area. Farther northwest in Idaho, and in adjacent parts of northeast Oregon and southeast Washington, recent precipitation resulted in lessened precipitation deficits and improved streamflow, leading to improvements in drought conditions and abnormal dryness in these areas. Recent precipitation also led to the removal of moderate drought in northwest Montana. Areas of southwest Montana and adjacent northeast Idaho that missed out on the larger precipitation amounts this week slipped into moderate drought as a result of growing short- and long-term precipitation deficits. Severe drought was added to the map in southeast Oregon, where short- and long-term precipitation deficits continued to grow. Growing precipitation deficits over the water year and lessening streamflow led to the extension of moderate drought in a small part of north-central Oregon and adjacent south-central Washington. Recent precipitation led to a slight reduction in coverage of moderate and severe drought in western Oregon. Moderate drought coverage increased in eastern New Mexico due to increasing short-term precipitation deficits and high evaporative demand.
Alaska, Hawaii, and Puerto Rico
No changes were made this week to the Drought Monitor depiction in Alaska or Puerto Rico. In Hawaii, drought impacts to vegetation led to the expansion of moderate drought on parts of Molokai and the Big Island, and the introduction of severe drought in western Molokai.
Pacific Islands
The weather conditions across the U.S.-Affiliated Pacific Islands (USAPI) during this USDM week (5/20/20-5/26/20) were dominated by dry trade winds in the north and an Inter-Tropical Convergence Zone (ITCZ) further south. Faster trade winds converging upon slower trade winds enhanced the precipitation across the Federated States of Micronesia (FSM) and Marshall Islands (RMI), while a near-equatorial trough and other surface troughs brought rain to parts of western Micronesia. A weak circulation briefly developed in central Micronesia. The ITCZ rains extended south but ended just short of Kapingamarangi. South of the equator, a surface trough lingered just southwest of the Samoan Islands. The trough teased American Samoa with moisture and unstable air for part of the week, competing against high pressure with a drier and more stable air mass.
Satellite-based estimates of 7-day precipitation (QPE) showed the ITCZ as a band of precipitation extending from Micronesia eastward across the Pacific between the equator and 10 degrees North latitude. A broken band of precipitation extended from Indonesia southeastward past the Samoan Islands as the South Pacific Convergence Zone (SPCZ). Two-plus inches of rain were indicated on the QPE across the FSM and southern RMI, with embedded areas of 4+ inches, and surrounded by lesser amounts to the north and south. Areas with 1+ inches of rain stretched westward across Palau, while little to no rain was indicated across the Marianas and northern RMI. South of the equator, the QPE showed a large area of 4+ inches of rainfall south of the Samoan Islands, with a band of 2+ inches stretching to the west of the islands and weaker fingers extending across the islands.
A surface trough continued a wet pattern across the Republic of Palau this week, dumping over 4 inches of rain on Koror (5.47 inches was recorded at the Palau IAP and 4.31 inches at the Koror COOP station). The monthly totals were well above the 8-inch monthly minimum: 23.71 inches at the Palau IAP and 22.22 inches at Koror COOP, both through May 25. As reported by the National Weather Service, the May monthly total for the weather station at the Palau Airai IAP was a record, surpassing the previous May record of 22.71 inches in 2005. The record May precipitation for the Koror COOP station is 27.46 inches which occurred in May of 1954. With April and May wet, D-Nothing continued at Palau.
It was another dry week for the Marianas, with a third of an inch or less of rain measured at all of the main reporting stations. Reports ranged from 0.07 inch at the Saipan IAP and 0.09 inch at the Guam airport station to 0.33 inch at Tinian and 0.37 inch at Rota (Saipan’s value had one day missing this week). The last 2 weeks were dry (less than the 1-inch weekly minimum needed to meet most water needs) at Guam, but beneficial showers fell early in the month. However, the showers did not reach the Commonwealth of the Northern Marianas Islands, with this week marking the 16th consecutive dry week at Saipan & Rota. With 0.58 inch of rain so far in May, the Saipan IAP has the driest May, April-May, March-May, February-May, and January-May on record. With 0.84 inch so far in May, Rota has the driest May, April-May, and March-May. Southern portions of Guam have had a few wildfires recently but relatively light winds and recent rains have limited spread. Wildfires have been a daily occurrence across Saipan. D3-SL continued for Saipan, D3-S continued at Rota, and D1-S continued for Guam.
The ITCZ created a wet band that split the FSM in half. The week was wet (more than the 2-inch weekly minimum) across central and eastern portions, but dry in parts of the north, west, and south. More than 2 inches of rain was reported this week at Chuuk (2.45 inches), Pohnpei (4.81), Kosrae (8.28), Lukonor (3.42), and Nukuoro (5.65). But it was dry in the far south, where Kapingamarangi measured 0.74 inch for the week, and in western Yap State, where Yap had 1.05 inches, North Fanif 1.43, Ulithi 1.04, and Woleai 1.59 (Woleai’s value had one day missing this week). With this week marking the third consecutive dry week, and the monthly total (so far) of 3.62 inches ranking as the third driest May on record, the status at Kapingamarangi was changed to D0-S. Even though Woleai received less than the 2-inch weekly minimum this week, the previous weeks have been wet and the monthly total of 10.50 inches is above the 8-inch monthly minimum, so the status was improved to D1-S. Woleai still has the seventh driest January-May and fourth driest June-May. The last 2 weeks have been dry at Yap and the reservoir still remains low, so D2-S continued for Yap. February-May ranked 6th driest and January-May 8th driest, so D0-S continued at Chuuk. D1-S continued at Ulithi, where the last 2 weeks have been dry. D-Nothing continued at the rest of the FSM stations.
In the RMI, no data was received this week so an analysis could not be made for Utirik. ITCZ rain gave southern portions of the Marshall Islands a wet week, with Jaluit reporting 6.31 inches of rain, Mili 3.54, and Majuro 2.53. It was dry at Wotje (0.15 inch for the week), Kwajalein (0.03), and Ailinglapalap (1.18). With May wet (10.02 inches of rain so far) and the reservoir level at 85% of maximum (above the 80% threshold for concern), D-Nothing continued at Majuro. D-Nothing also continued at Jaluit and Mili, where May has been wet. Drought continued at Wotje (D3-SL), Kwajalein (D1-SL), and Ailinglapalap (D1-S).
A nearby surface trough lent some moisture to convective instability across parts of American Samoa, where weekly rainfall totals ranged from 0.51 inch and 1.10 inches at the automated stations on Toa Ridge and Siufaga Ridge, respectively, to 1.30 inches at the Pago Pago Airport station. With the May monthly total at Pago Pago (6.03 inches) and Siufaga Ridge (4.67) above the 4-inch monthly minimum, and this month continuing a string of wet to very wet months, D-Nothing continues at Tutuila.
Virgin Islands
The weather conditions across the U.S. Virgin Islands (USVI) during this USDM week (5/20/20-5/26/20) were dominated by a mid- to upper-level ridge which brought stable and dry air and warm temperatures. Rohlsen AP on St. Croix had maximum temperatures in the 90s F for most of the week and tied a record with 91 on May 20. High pressure, which persisted over the central to eastern Atlantic, fed easterly trade winds across the USVI. Pockets of moisture were embedded within the trade-wind flow, but the upper-level ridge inhibited convection. A weak layer of Saharan dust helped keep the weather dry.
Radar-based estimates of rainfall for the 7 days ending at 12z on Tuesday depicted little to no precipitation across the islands. Up to a fourth of an inch was indicated for parts of St. Thomas, with a tenth of an inch to no rainfall indicated for the rest of the islands.
Due to the very dry weather conditions, the Virgin Islands Fire Service (VIFS) issued a ban on burning. Effective Friday, May 22, all outdoor burning was temporarily prohibited in the territory.
On St. Croix, 0.02 inch of rain was reported for the week at Rohlsen AP, East Hill, and the CoCoRaHS stations at Christiansted 1.8 ESE and 4.1 ESE, although the CoCoRaHS station at Christiansted 1.8 ESE was missing several days. The station at the UVI Sheep Farm reported 0.06 inch for the week. Rohlsen AP has measured 0.54 inch of rain so far this month, giving May 2020 a rank of ninth driest. The normal May precipitation at Rohlsen AP is 4.15 inches. April 1-May 26 has had 1.15 inches, ranking fourth driest out of 61 years, equating to a percentile of 0.07 which is at the D2 USDM level. Year-to-date precipitation is at 78% of normal. East Hill has reported 1.01 inches of rain for the month so far, which is about 31% of normal, and 2.08 inches for April 1-May 26, which is about 38% of normal. May monthly totals (based on data received so far) included 0.34 inch at Christiansted 4.1 ESE, 0.56 inch at Christiansted 1.8 ESE, and 0.68 inch at the UVI Sheep Farm. The Standardized Precipitation Index (SPI) values for the Rohlsen/Hamilton Airport and East Hill stations ranged from D0 to D3 levels. East Hill SPI is at D0 levels for the last 1, 9, and 12 months, but the Rohlsen AP SPI values are at the D1 level for the last 1 and 12 months, the D0 level at the 6-month time scale, and D3 level for the last 9 months. Current groundwater data is not available for the USGS Adventure 28 well; the latest data is through April 25, 2020, but it was in steady decline for a month to that point. The USDM status was worsened to D2-SL for St. Croix.
On St. Thomas, King AP had no measurable rain while the CoCoRaHS station at Anna’s Retreat reported 0.02 inch. The May monthly totals are a trace for King AP and 0.63 inch for Anna’s Retreat. The May monthly normal for King AP is 3.06 inches. With 0.92 inch in April, this ranks April 1-May 26, 2020 at the airport as the third driest such period out of 57 years of data. This translates to the 5th percentile in the historical record, which is at the D3 USDM level. The year-to-date precipitation at King AP was about 80% of normal. The SPI at King AP was at the D0 level for the last 9 months, but dropped to the D1 level for the last 3 months and continued at the D3 level for the last month. The USGS Grade School 3 well level has been steadily declining since the end of March, with the decline accelerating precipitously in the last week, and is now the lowest it's been in the last 12 months. The USDM status was worsened to D2-S for St. Thomas.
On St. John, the station at Windswept Beach reported 0.06 inch of rain this week through May 25, bringing the May total to 1.20 inches. The long-term average for May is 4.54 inches. The SPI continued at the D1 level for the last 3 and 9 months and worsened to the D1 level for the last month. The USGS Susannaberg well level has been steadily declining since the end of January, and is now the lowest it’s been since August 2019. We have no USDM impacts table for the USVI (https://droughtmonitor.unl.edu/Data/StateImpacts.aspx), but nearby Puerto Rico is included in the impacts table, and D2 includes “Trees and plants show stress”. Photos provided by the Windswept Beach observer showed widespread stress of trees across St. John (Mary’s Point), including a stressed Maran bush which is a very drought-tolerant species. As a consequence of the impacts, precipitation, and groundwater data, the USDM status for St. John was worsened to D2-S.
Looking Ahead
During the first week of June, the National Weather Service Climate Prediction Center is forecasting a high probability of warmer than normal temperatures across most of the continental United States (excluding the East Coast, south Texas, and the Pacific Northwest). The highest probability for above-normal temperatures is centered on the Central Great Plains. The Intermountain West, in particular the Four Corners, northwest Nevada, and southeast Oregon, are favored to have above-normal precipitation, while areas close to the Canadian border (to the west of Lake Huron) are also slightly favored for above-normal precipitation. Meanwhile, most areas from the central and southern Great Plains to the Atlantic Seaboard are favored to have below-normal precipitation, with the exceptions of south Florida and south Texas.
Author(s):
Curtis Riganti, National Drought Mitigation Center
Richard Heim, NOAA/NCEI
Dryness Categories
D0 Abnormally Dry—used for areas showing dryness but not yet in drought, or for areas recovering from drought.
Drought Intensity Categories
D1 Moderate Drought
D2 Severe Drought
D3 Extreme Drought
D4 Exceptional Drought
Drought or Dryness Types
S Short-Term, typically less than 6 months (e.g. agricultural, grasslands)
L Long-Term, typically greater than 6 months (e.g. hydrologic, ecologic)
Source: National Drought Mitigation Center

