


IMPORTANT NOTE: The employment data for the month of September 2020 is taken from the survey week including September 12. Data for the survey week including October 12 is scheduled for release on November 20.
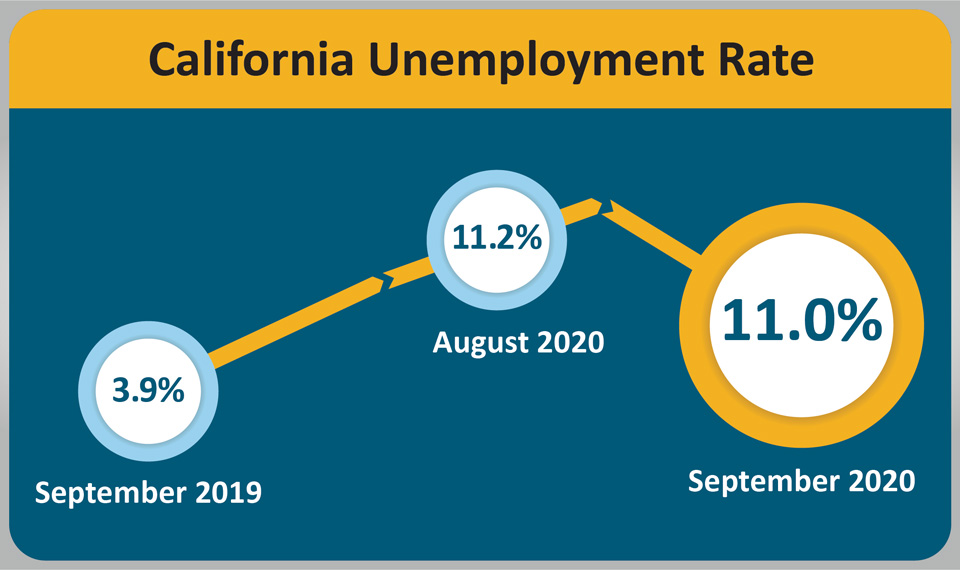
October 17, 2020 - SACRAMENTO – California’s unemployment rate improved to an even 11 percent in September as the state’s employers added 96,000 jobs1, according to data released on Friday by the California Employment Development Department (EDD) from two surveys. This comes after August’s upward-revised gain of 113,800 jobs (+11,900 jobs from previously reported gain). California has now regained more than a third (38 percent) of the 2,615,800 nonfarm jobs lost during March and April as a direct result of the COVID-19 pandemic.

California’s Labor Market, by the Numbers...
- September’s unemployment rate of 11.0 percent2 marked the second consecutive month since March 2020 that California’s unemployment rate was lower than the 12.3 percent mark set during the height of the Great Recession (March, October, and November 2010).
- Seven of California’s 11 industry sectors gained jobs last month. Leisure & Hospitality (+48,400) had the largest job gain after experiencing the largest month-over loss in August thanks to large growth in Accommodation and Food Services.
- Month-over growth in Trade, Transportation and Utilities (+30,600) was aided by gains in Retail Trade – specifically Clothing and Clothing Accessory Stores.
- Government (-14,300) posted the largest industry job loss in September with losses in Federal Government largely due to losses in census worker employment driving the sector’s numbers down.
1. The nonfarm payroll job numbers come from a federal survey of 80,000 California businesses.
2. The unemployment rate comes from a separate federal survey of 5,100 California households.
Data Trends about Jobs in the Economy
Total Nonfarm Payroll Jobs
This information comes from a monthly survey of approximately 80,000 California businesses that estimates jobs in the economy – seasonally adjusted.
- Month-over – Total nonfarm jobs in California’s 11 major industries totaled 15,982,300 in September – a net gain of 96,000 jobs from August. This followed an upward-revised (+11,900) gain of 113,800 jobs in August.
- Year-over – Total nonfarm jobs decreased by 1,488,900 (an 8.5 percent decrease) from September 2019 to September 2020 compared to the U.S. annual loss of 9,648,000 jobs (a 6.4 percent decrease).

Total Farm jobs – The number of jobs in the agriculture industry increased by 2,000 from August 2020 to 328,800 jobs in September. The agricultural industry has lost 96,600 farm jobs since September 2019.
Data Trends about Workers in the Economy
Employment and Unemployment in California
This information is based on a monthly federal survey of 5,100 California households which focuses on workers in the economy.
- Employed – The number of Californians holding jobs in September was 16,618,200, an increase of 47,300 jobs from August’s total of 16,570,900, but down 2,082,200 from the employment total in September of last year.
- Unemployed – The number of unemployed Californians was 2,058,800 in September, a decrease of 27,900 over the month, but up by 1,300,900 compared with September of last year.

Unemployment Insurance Claims (Not Seasonally Adjusted)
The following data is from a sample week that includes the 19th of each month: In related data that figures into the state’s unemployment rate, there were 2,801,538 people certifying for Unemployment Insurance benefits during the September 2020 sample week. That compares to 2,837,209 people in August 2020 and 281,060 people in September 2019. Concurrently, 226,272 initial claims were processed in the September 2020 sample week, which was a month-over increase of 29,417 claims from August 2020 and a year-over increase of 190,944 claims from September 2019.

| COUNTY | LABOR FORCE | EMPLOYMENT | UNEMPLOYMENT | RATE |
|---|---|---|---|---|
| STATE TOTAL | 18,761,200 | 16,744,000 | 2,017,200 | 10.8% |
| ALAMEDA | 806,200 | 731,400 | 74,900 | 9.3% |
| ALPINE | 460 | 410 | 50 | 10.7% |
| AMADOR | 14,150 | 12,920 | 1,230 | 8.7% |
| BUTTE | 93,900 | 85,900 | 8,000 | 8.5% |
| CALAVERAS | 20,320 | 18,810 | 1,510 | 7.4% |
| COLUSA | 9,850 | 8,810 | 1,040 | 10.6% |
| CONTRA COSTA | 536,000 | 486,200 | 49,800 | 9.3% |
| DEL NORTE | 9,130 | 8,320 | 810 | 8.8% |
| EL DORADO | 88,800 | 82,200 | 6,600 | 7.5% |
| FRESNO | 442,500 | 396,500 | 45,900 | 10.4% |
| GLENN | 12,650 | 11,730 | 920 | 7.3% |
| HUMBOLDT | 59,600 | 55,000 | 4,500 | 7.6% |
| IMPERIAL | 67,800 | 53,300 | 14,600 | 21.5% |
| INYO | 8,130 | 7,540 | 590 | 7.3% |
| KERN | 369,100 | 323,500 | 45,700 | 12.4% |
| KINGS | 55,200 | 49,500 | 5,700 | 10.3% |
| LAKE | 28,680 | 26,200 | 2,480 | 8.6% |
| LASSEN | 9,150 | 8,580 | 570 | 6.3% |
| LOS ANGELES | 4,942,400 | 4,196,300 | 746,100 | 15.1% |
| MADERA | 61,600 | 55,800 | 5,800 | 9.4% |
| MARIN | 133,400 | 124,700 | 8,600 | 6.5% |
| MARIPOSA | 7,660 | 7,010 | 650 | 8.4% |
| MENDOCINO | 36,670 | 33,620 | 3,050 | 8.3% |
| MERCED | 114,600 | 102,500 | 12,100 | 10.6% |
| MODOC | 3,030 | 2,830 | 200 | 6.5% |
| MONO | 6,610 | 5,870 | 740 | 11.2% |
| MONTEREY | 194,200 | 177,200 | 17,100 | 8.8% |
| NAPA | 71,500 | 66,000 | 5,400 | 7.6% |
| NEVADA | 45,780 | 42,380 | 3,390 | 7.4% |
| ORANGE | 1,571,600 | 1,429,300 | 142,200 | 9.0% |
| PLACER | 181,300 | 168,400 | 12,800 | 7.1% |
| PLUMAS | 7,540 | 6,950 | 590 | 7.8% |
| RIVERSIDE | 1,084,100 | 969,900 | 114,200 | 10.5% |
| SACRAMENTO | 703,700 | 634,800 | 68,900 | 9.8% |
| SAN BENITO | 30,400 | 27,700 | 2,700 | 8.7% |
| SAN BERNARDINO | 951,900 | 853,800 | 98,200 | 10.3% |
| SAN DIEGO | 1,560,000 | 1,419,100 | 140,900 | 9.0% |
| SAN FRANCISCO | 564,600 | 517,100 | 47,500 | 8.4% |
| SAN JOAQUIN | 323,000 | 286,200 | 36,800 | 11.4% |
| SAN LUIS OBISPO | 130,100 | 120,800 | 9,400 | 7.2% |
| SAN MATEO | 439,900 | 408,600 | 31,300 | 7.1% |
| SANTA BARBARA | 211,700 | 196,100 | 15,600 | 7.4% |
| SANTA CLARA | 1,023,900 | 951,700 | 72,100 | 7.0% |
| SANTA CRUZ | 128,700 | 118,300 | 10,400 | 8.1% |
| SHASTA | 72,600 | 66,900 | 5,700 | 7.8% |
| SIERRA | 1,250 | 1,170 | 80 | 6.7% |
| SISKIYOU | 15,920 | 14,570 | 1,350 | 8.5% |
| SOLANO | 202,600 | 182,900 | 19,700 | 9.7% |
| SONOMA | 250,900 | 232,800 | 18,100 | 7.2% |
| STANISLAUS | 237,100 | 212,800 | 24,300 | 10.3% |
| SUTTER | 41,200 | 36,900 | 4,200 | 10.3% |
| TEHAMA | 24,630 | 22,620 | 2,010 | 8.2% |
| TRINITY | 4,340 | 4,050 | 290 | 6.7% |
| TULARE | 190,600 | 167,300 | 23,300 | 12.2% |
| TUOLUMNE | 19,400 | 17,540 | 1,860 | 9.6% |
| VENTURA | 407,300 | 373,100 | 34,100 | 8.4% |
| YOLO | 103,800 | 96,400 | 7,400 | 7.1% |
| YUBA | 28,100 | 25,100 | 3,000 | 10.6% |
Source: CA. EDD

