


California and National Drought Summary for November 10, 2020
Summary
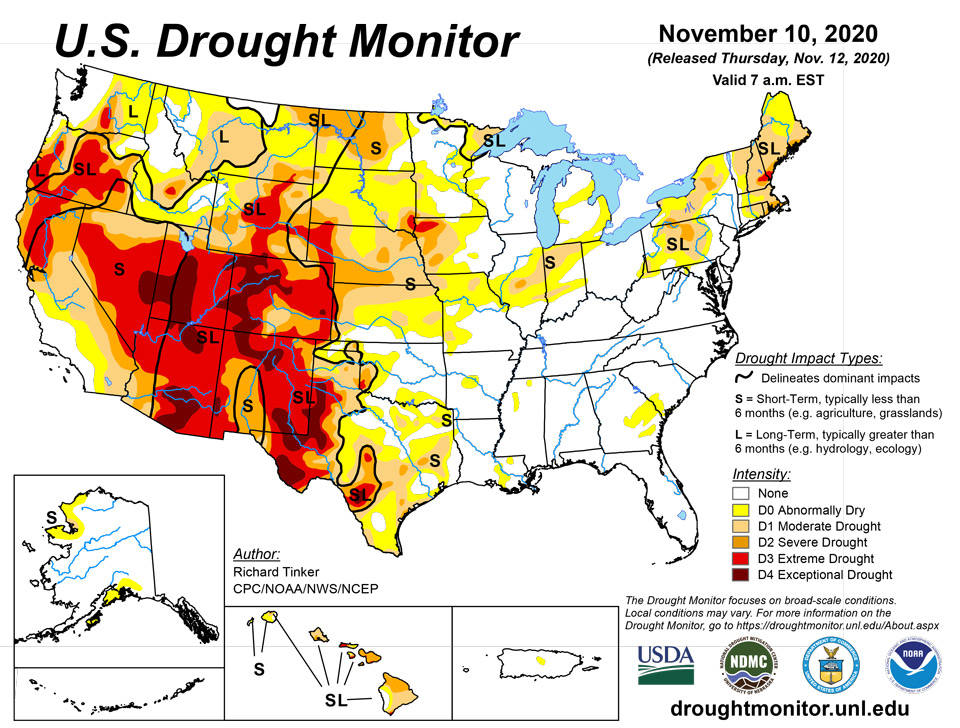
November 12, 2020 - The heaviest precipitation fell on northwestern and southeastern parts of the country. The higher elevations of Washington and Oregon recorded 1.5 to locally 8.0 inches, with 2 to 4 inch totals reported in northwest Montana, north Idaho, and parts of eastern Washington and Oregon. On the other side of the country, Tropical Storm Eta dropped heavy rains on southern Florida. Amounts between 5 and 10 inches soaked parts of the greater Miami area. Meanwhile, moderate precipitation – with locally heavy amounts in the higher elevations – fell in association with the Pacific Northwest storm as it moved eastward. In general, precipitation totals (and drought relief) generally increased moving north and west away from southern California and the southern Rockies. Most higher elevations, in addition to a broad area across Montana, received at least 0.5 inch. East of the Rockies, moderate precipitation of 0.5 to locally 2.5 inches covered a swath from the central Great Plains northward through the upper Mississippi Valley and western Great Lakes. Similar amounts fell on a small area in the Louisiana Bayou, but across the rest of the central and eastern United States, little or no precipitation fell. The High Plains and lower elevations of the southern Intermountain West and Rockies also recorded no more than a few tenths of an inch. Above-normal temperatures broadly dominated the Nation from the Intermountain West eastward to the Atlantic Coast. Temperatures averaged 10 to 18 deg. F above normal from the southern High Plains northward and eastward through the Great Plains and Great Lakes Region. Slightly below normal temperatures were restricted to the western tier of states.
Northeast
A very dry week kept drought and dryness essentially unchanged. Increasing 60- and 90-day precipitation shortfalls induced some deterioration in central Pennsylvania.
Southeast
Over 4 inches of rain fell on most of southern Florida in association with Tropical Storm Eta. Farther north, moderate amounts of several tenths to locally about 2 inches fell on the northern Florida Peninsula and the eastern fringes of southern Georgia and adjacent South Carolina. Elsewhere, little if any precipitation fell. As a result, the area of abnormal dryness from east-central Georgia into South Carolina was unchanged.
South
Light to moderate rain fell on much of Louisiana, but the rest of the region was warm and dry. As a result, dryness expanded in parts of Oklahoma, and a few patches of D0 began to dot the lower Mississippi Valley. More significantly, dryness and drought broadly intensified across Texas south of the Panhandle. Conditions are abnormally dry or worse across much of the state. Areas of D1 and a few patches of D2 were brought into parts of central and eastern Texas, while severe to exceptional drought is common in central Texas and the western tier of the state. Broad patches of D4 exceptional drought now cover much of the Big Bend and along the New Mexico border. Farther north, little change was noted across the Panhandles of Texas and Oklahoma, and near the Red River Valley
Midwest
Moderate precipitation brought improvement to eastern Nebraska, central and western Iowa, and part of extreme southeast South Dakota. Elsewhere, lesser precipitation and unseasonably warm weather maintained or worsened extant dryness. D0 covered western and northern Missouri and a swath from southwestern Illinois through parts of Indiana and into southern Michigan, with moderate drought covering a stripe across southern Indiana and from central Illinois into northern Indiana. A small area of D2 was introduced in central Illinois due to increasing precipitation deficits on time scales from several weeks to several months. Moderate to heavy precipitation brought improvement to central and western Iowa, but severe dryness remains across much of the western Iowa, with D3 continuing in a patch in the northwest part of the state. Closer to the Canadian Border, existing dryness and drought across Minnesota – mostly in southwestern and northeastern parts of the state – remained unchanged.
High Plains
Moderate to heavy precipitation brought some improvement into eastern Nebraska and small sections of southeastern South Dakota, but drier conditions farther west allowed dryness and drought to persist. Some deterioration to D1 was brought into a small area in south-central South Dakota, and D2 was expanded northward through much of north-central North Dakota. Across the vast majority of the region, dryness and drought remained essentially unchanged from the previous week. Now, a few areas of D1-D2 extend from northern Kansas northward through the Dakotas, with a small area of extreme drought assessed in southeastern South Dakota. Across Wyoming and Colorado, protracted and entrenched drought continues. Western Nebraska, most of Colorado, and the central tier of Wyoming are covered by extreme (D3) drought, and the most intense drought classification (D4, exceptional drought) was common across the western half of Colorado.
West
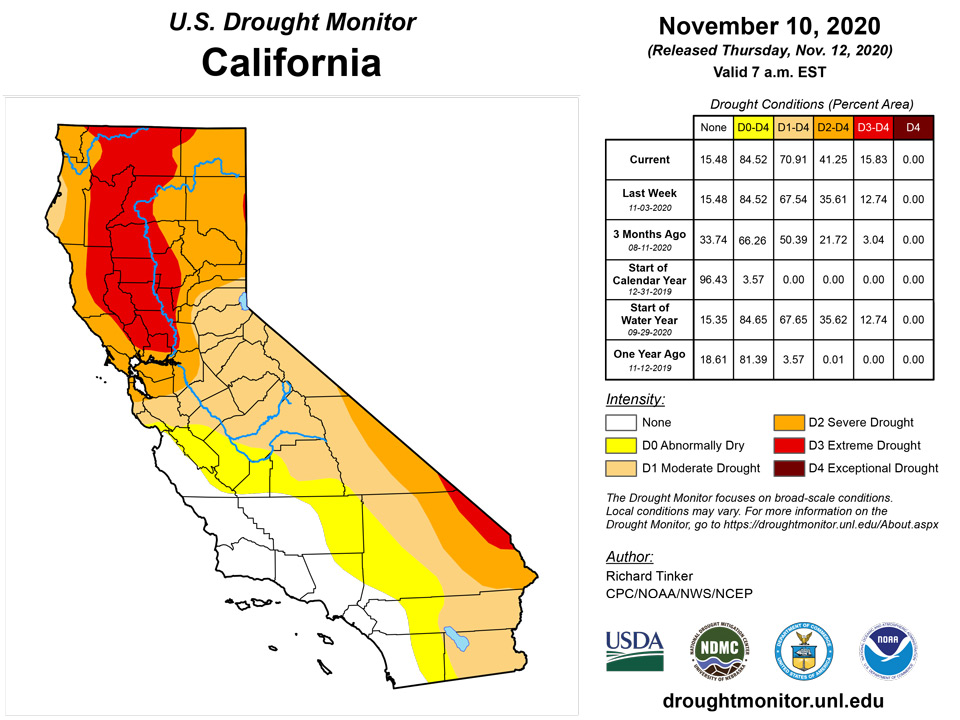
The Pacific storm dropped significant, widespread precipitation on areas from Washington and Oregon northeastward through the northern tier of Montana. Improvement was introduced in much of this region, although D2 to D3 conditions remain in central and southern Washington, and large areas of Oregon south of the immediate Washington border. Farther south, scattered light precipitation fell on lower elevations while moderate to isolated heavy precipitation dotted the higher mountains. Amounts were insufficient to bring improvement anywhere to south and east of northern Oregon, and conditions deteriorated in northern California, and in much of a broad swath from southwestern California eastward across New Mexico. Severe drought (D3) now covers most of Nevada and the Four Corners States, and broad sections of D4 persisted or expanded in east-central Nevada, much of central and southern Utah, north-central and south-central Arizona, and portions of northern and eastern New Mexico.
Alaska, Hawaii, and Puerto Rico
A confused pattern of dryness and drought changes covered Hawaii, with at least D0 conditions observed over most of the state. Some improvements were noted in southern sections of Kauai and northern Oahu, but hydrologic conditions worsened to D2 on the opposite sides of both islands. Severe drought (D2) also covers Maui and the northern half of the Big Island, and small areas of D3 remain over western Molokai, southernmost sections of Lanai and Maui, and the far southern Big Island.
In the 3 areas of abnormal dryness in southern and western Puerto Rico, at least a couple inches of rain fell almost everywhere, and several inches doused northwestern parts of the Island. As a result, all 3 areas of D0 were removed. In central Puerto Rico, however, rainfall has been 6 to 9 inches below normal over the past 2 to 3 months, so a patch of D0 was introduced there.
D0 with a small coastal area of D1 extends across the northwest part of Alaska, and D0 stretches from the Kenai Peninsula through greater Anchorage and eastward into Valdez. No changes were observed since the previous week.
Pacific Islands
The weather across the U.S.-Affiliated Pacific Islands (USAPI) during this USDM week (11/04/20-11/10/20) was influenced by surface troughs, weak cyclonic circulations, convergent low-level flow, weak trade wind disturbances, Typhoon Vamco (25W) over western portions of the USAPI region, and the ITCZ over eastern portions of the USAPI region. Vamco developed from a tropical disturbance approximately 600 miles east-southeast of Manila, Philippines, on November 9th. As of this writing (Noon EST, November 11th), Vamco is now a typhoon with maximum sustained winds of 90 kts (gusts to 110 knots), and located about 100 miles east of Manila. South of the equator, a weak surface ridge early in the drought week subsequently gave way to a slow-moving surface trough and an extended period of wet weather to American Samoa.
Satellite-based estimates of 7-day precipitation (QPE) showed two east-west oriented bands of precipitation: one from about 8N-13N/130E-155E, and another from about the equator to 8N, and 130E to near the Date Line. Within these bands, 1-4 inches of rain are generally indicated, with embedded 4-8 inch amounts. At least 4 inches of rain are indicated north and west of Palau and Yap state, associated with the track of Typhoon Vamco. Southern sections of Micronesia and the Marshall Islands received significantly more precipitation than did areas to the north. South of the equator, the satellite QPE estimated rainfall amounts of up to 2 inches in the vicinity of American Samoa. However, ground-based rain gauges provide a more complete and detailed picture of the event, with rainfall measurements ranging from 3-6 inches. This is suggestive of very localized orographic enhancement of precipitation, which is not well captured by satellite estimates.
The Palau International Airport received 4.46 inches of rain this drought week, which is nearly 2.25 times the weekly minimum (2 inches) considered adequate to meet most water needs. The Koror COOP was not far behind, with 4.08 inches of rain observed. Palau retains its drought-free designation.
Rainfall measurements across Saipan ranged from 0.53-inch (ASOS) to 0.59-inch (manual gauge at the International Airport) to 1.37 inches (National Park Service). The ASOS location on Saipan has been wet for the past four months, exceeding the 4-inch minimum threshold required to meet most water needs. The monthly precipitation tallies for July through October were (respectively) 5.11 inches, 6.69 inches, 10.81 inches, and 11.08 inches. The nearby island of Tinian received 0.59-inch of rain this week. Guam reported 1.46 inches of rain this week, and has exceeded the weekly minimum threshold of 1-inch for the last 12 weeks. Guam has also greatly exceeded the monthly minimum threshold of 4-inches for the last 4 months (8.26 inches of rain in July, 12.68 inches in August, 10.96 inches in September, and 16.75 inches in October). Nearby Rota received 1.77 inches of rain this week, and like Guam, exceeded the weekly minimum threshold for the past 12 weeks, and the monthly minimum threshold for the past 4 months. Accordingly, the CNMI and Guam remain drought-free.
Western portions of Micronesia (FSM) experienced a wet week with Yap reporting 6.46 inches of rain (2 days missing), Rumung 6.37 inches (2 days missing), Ulithi 3.89 inches (1 day missing) and Woleai 2.54 inches (2 days missing). Inspection of the monthly rainfall totals from each of these stations reveals a sharp transition from dryness to wetness in May, with most if not all of the months since then being wet. A wet week was also noted in most of central Micronesia. Precipitation amounts reported for the drought week include 3.75 inches at Nukuoro, 3.67 inches at Chuuk, 3.08 inches at Lukunor (1 day missing), and 2.20 inches at Fananu (2 days missing). However, in stark contrast to this heavy rainfall, Kapingamarangi received only 0.26-inch of rain this week, which secured exceptional drought status (D4-S) for at least another week. It has been reported that one of the two concrete water tanks on the island has about 300 gallons of water left, while the other tank is empty. The Pohnpei State Government dispatched a ship called the “Lady Minto” to Kapingamarangi, which delivered (among other things) 500 5-gallon water containers, and food supplies. These supplies have been distributed to island residents. Eastern portions of Micronesia received their fair share of rain this week, with 8.43 inches of rain reported at Pohnpei, 4.74 inches at Kosrae, and 1.80 inches at Pingelap. No changes were rendered to any of the drought depictions in Micronesia, with all stations remaining free of drought, except for Kapingamarangi.
The Marshall Islands (RMI) received significantly less precipitation this week than did Micronesia, but the amounts were still sufficient to prolong drought-free conditions across the region. Kwajalein and Wotje (2 days of data still missing) saw the highest rainfall totals, with 3.49 and 3.21 inches measured, respectively. Ailinglapalap trailed only slightly, with 2.83 inches reported. Majuro, Mili, and Jaluit came in with 1.45 inches, 1.11 inches, and 1.08 inches, respectively. As of November 5th, Majuro reservoir storage stood at 30.7 million gallons, which is 85.3% of its total storage capacity (36 million gallons). Utirik rainfall data continues to be missing. Drought-free conditions persist across the RMI this week.
South of the equator In American Samoa, Pago Pago reported 3.83 inches of rain this week which not only shatters the 1-inch weekly rainfall minimum to meet most water needs, but also approaches the monthly threshold of 4 inches. The elevated National Park Service sites of Siufaga Ridge and Toa Ridge measured even greater rainfall totals: 5.34 inches and 4.80 inches, respectively. Drought-free conditions continue therefore on the island of Tutuila.
Virgin Islands
Towards the end of the drought week (November 4-10), a tropical wave passing just south of the islands brought showers and thunderstorms to the region, which likely triggered localized areas of flooding. Rainfall received from this tropical wave, and in the weeks prior to this event, help to recharge soil moisture going into the climatological dry season. The USVI remains drought-free this week.
At the Cyril E. King Airport in St. Thomas, 3.31 inches of rain was reported yesterday, which raises the Month-To-Date (MTD) total to 4.40 inches. This precipitation was associated with a late season tropical wave that passed close to the Virgin Islands. Yesterday’s rainfall ranks as the 6th wettest November day on record (dating back to 1953), with the number 1 ranking being 5.74 inches, measured on November 5, 1984. Since September 1st, 13.84 inches of rain fell, which is 0.86-inch above normal. Year-To-Date (YTD) rainfall is 30.39 inches, which is a shortfall of 2.74 inches of rain. CoCoRaHS station VI-ST-1 (Anna’s Retreat) reported a total of 2.21 inches of rain during this drought week (November 4-10). USGS well data continues to be missing for St. Thomas, and also for St. John and St. Croix. SPI values at 1,3,6,9, and 12-months for the King Airport are -0.93, -0.51, -0.65, -0.75, and -0.69, respectively. No changes to the drought depiction were deemed necessary for St. Thomas this week.
CoCoRaHS station VI-SJ-3 (Windswept Beach, St. John) reported 3.01 inches of rain this week, and 7.96 inches for the month of October. SPI values at 1,3,6,9, and 12-months for Windswept Beach are +1.01, +0.28, -0.13, -0.50, and +0.08, respectively. Based on these fairly wet SPI values, and the observed rainfall totals noted above, no changes to the drought depiction were deemed necessary for St. John this week.
On the island of St. Croix, the Henry E. Rohlsen Airport measured 1.40 inches of rain yesterday, which brings the MTD total to 1.87 inches. Since September 1st, 9.47 inches of rain have fallen, which is a deficit of 2.65 inches for that period. Since January 1st, this station has received 83.47% of its normal rainfall (26.92 out of 32.25 inches). CoCoRaHS station VI-SC-10 (Christiansted 1.6 E) measured 1.66 inches of rain this drought week. SPI values at 1,3,6,9, and 12-months for the Rohlsen Airport are -0.62, -0.27, -0.58, -0.57, and -0.90, respectively. Although a little dry at 12 months, no changes to the drought depiction were deemed necessary for St. Croix this week.
Looking Ahead
Through November 16, 2020, heavy precipitation is expected from an interaction of a frontal system and Tropical Storm Eta in the Southeast. Up to 5 inches are expected in parts of the eastern Carolinas, and amounts of 1.5 to 4.0 inches are expected in the west-central Florida Peninsula and across the remainder of the Carolinas northward into the middle Atlantic states. Heavy precipitation is also expected in the Pacific Northwest, with 5 to 10 inches fairly common along the north half of the Pacific Coast and over the central and northern Cascades. Lesser amounts are forecast over the rest of the Pacific Northwest from the Cascades westward, and in some higher elevations across the Intermountain West. Moderate precipitation, with isolated amounts approaching 2 inches, could fall on the higher elevations in the central Rockies and in a swath across central Missouri and southern Illinois. In contrast, little or no precipitation is expected through the Plains, Gulf Coast, desert Southwest, and southern parts of California and Nevada. Meanwhile, most of the contiguous United States should average a few degrees above normal, with subnormal temperatures restricted to the northern Rockies and Intermountain West.
The Climate Prediction Center’s 6-10 day outlook (November 17-21) favors above-normal precipitation across much of Alaska, the northern and central Intermountain West, northern California, and the Pacific Northwest. From the Great Plains eastward to the Atlantic Coast, odds favor below-normal precipitation outside Maine and southern Florida. It should be cooler than normal in southeast Alaska, New England, the middle Atlantic region, and the eastern Carolinas. Warm weather should cover northern and western Alaska, from the Mississippi Valley west to the Pacific Coast, and along the Gulf Coast.
Author(s):
Richard Tinker, NOAA/NWS/NCEP/CPC
Anthony Artusa, NOAA/NWS/NCEP/CPC
Dryness Categories
D0 Abnormally Dry—used for areas showing dryness but not yet in drought, or for areas recovering from drought.
Drought Intensity Categories
D1 Moderate Drought
D2 Severe Drought
D3 Extreme Drought
D4 Exceptional Drought
Drought or Dryness Types
S Short-Term, typically less than 6 months (e.g. agricultural, grasslands)
L Long-Term, typically greater than 6 months (e.g. hydrologic, ecologic)
Source: National Drought Mitigation Center

