


IMPORTANT NOTE: The employment data for the month of June 2021 is taken from the survey week including June 12. Data for the month of July is scheduled for release on Aug. 20, 2021.
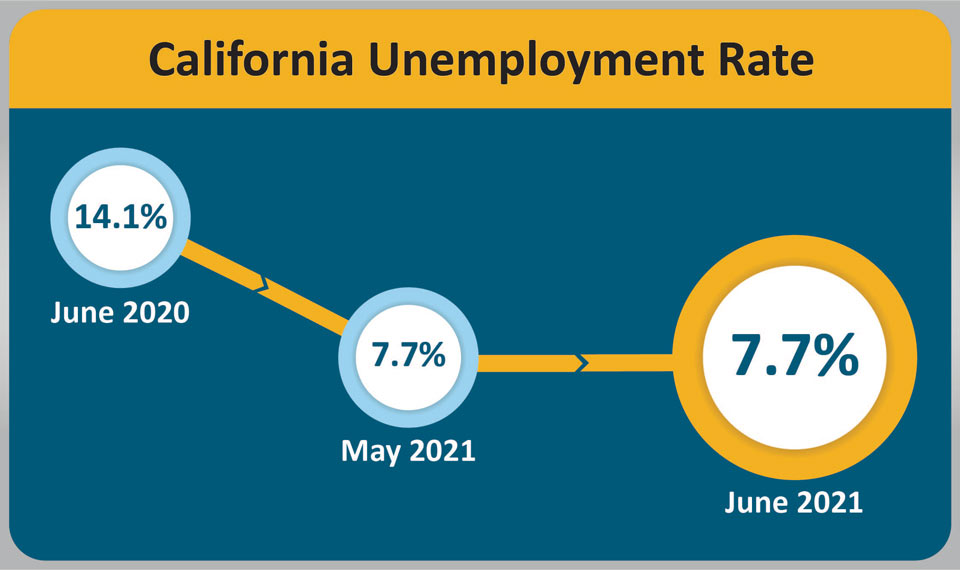
July 16, 2021 - SACRAMENTO – California’s unemployment rate held steady at 7.7 percent in June as the state’s employers gained 73,500 non-farm payroll jobs1, according to data released today by the California Employment Development Department (EDD) from two surveys. This comes after May’s unemployment rate was revised downward from 7.9 percent to 7.7 percent due to a downward-revised (-32,700) month-over loss in unemployed persons for the month.

California’s Labor Market, by the Numbers...
- The unemployment rate2 of 7.7 percent in June is nearly half of the 14.1 percent hit just one year ago, but is still 3.4 percentage points above the pre-pandemic level seen in February 2020.
- Prior to the pandemic, a 98,500-job increase in April 2016 was California’s single largest job gain on record since 1990. The state has exceeded this gain in six of the 14 months of the ongoing recovery as of June, including three times in 2021.
- Of the 2,714,800 jobs lost in March and April 2020 due to the COVID-19 pandemic, California has now regained 1,470,500 jobs (54.2 percent).
- Eight of California’s 11 industry sectors gained jobs in June. Leisure & Hospitality (+44,400) continued to have the state’s largest month-over increase for the fifth consecutive month thanks to restaurants hiring and increased tourism. Other Services (+7,200) also performed well with increases in Personal and Laundry Services.
- Construction (-3,000) suffered the largest month-over job reduction due to losses in Building Foundation and Exterior Contractors.
1. The nonfarm payroll job numbers come from a federal survey of 80,000 California businesses.
2. The unemployment rate comes from a separate federal survey of 5,100 California households.
Data Trends about Jobs in the Economy
Total Nonfarm Payroll Jobs
This comes from a monthly survey of approximately 80,000 California businesses that estimates jobs in the economy – seasonally adjusted.
- Month-over – Total nonfarm jobs in California’s 11 major industries totaled 16,416,600 in June – a net gain of 73,500 jobs from May 2021. This followed a downward revision of 9,800 jobs for a revised month-over gain of 94,700 jobs in May.
- Year-over – Total nonfarm jobs increased by 804,900 (a 5.2 percent increase) from June 2020 to June 2021 compared to the U.S. annual gain of 7,919,000 jobs (a 5.7 percent increase).

Total Farm jobs – The number of jobs in the agriculture industry increased by 13,000 from May 2021 to 422,900 jobs in June. The agricultural industry has 17,000 more farm jobs in June 2021 than it did the June prior.
Data Trends about Workers in the Economy
Employment and Unemployment in California
This information is based on a monthly federal survey of 5,100 California households which focuses on workers in the economy.
- Employed – The number of Californians employed in June was 17,441,800, an increase of 24,500 jobs from May’s total of 17,417,300 and up 1,280,800 from the employment total in June of last year.
- Unemployed – The number of unemployed Californians was 1,456,900 in June, an increase of 11,000 over the month, but down 1,195,200 in comparison to June of last year.

Unemployment Insurance Claims (Not Seasonally Adjusted)
The following data is from a sample week that includes the 19th of each month: In related data that figures into the state’s unemployment rate, there were 592,867 people certifying for Unemployment Insurance benefits during the June 2021 sample week. That compares to 569,512 people in May and 2,778,771 people in June 2020. Concurrently, 64,123 initial claims were processed in the June 2021 sample week, which was a month-over decrease of 7,136 claims from May and a year-over decrease of 220,177 claims from June 2020.

| COUNTY | LABOR FORCE | EMPLOYMENT | UNEMPLOYMENT | RATE |
|---|---|---|---|---|
| STATE TOTAL | 19,003,600 | 17,481,000 | 1,522,700 | 8.0% |
| ALAMEDA | 803,500 | 750,900 | 52,600 | 6.5% |
| ALPINE | 470 | 430 | 40 | 8.9% |
| AMADOR | 14,700 | 13,680 | 1,020 | 6.9% |
| BUTTE | 92,600 | 85,900 | 6,700 | 7.3% |
| CALAVERAS | 21,670 | 20,410 | 1,260 | 5.8% |
| COLUSA | 11,070 | 9,760 | 1,300 | 11.8% |
| CONTRA COSTA | 536,000 | 499,100 | 36,800 | 6.9% |
| DEL NORTE | 9,390 | 8,650 | 750 | 7.9% |
| EL DORADO | 90,800 | 85,300 | 5,500 | 6.0% |
| FRESNO | 448,700 | 406,600 | 42,100 | 9.4% |
| GLENN | 13,050 | 12,140 | 910 | 7.0% |
| HUMBOLDT | 59,900 | 56,100 | 3,800 | 6.4% |
| IMPERIAL | 68,100 | 56,200 | 11,900 | 17.5% |
| INYO | 8,270 | 7,770 | 500 | 6.0% |
| KERN | 381,300 | 340,100 | 41,200 | 10.8% |
| KINGS | 55,600 | 50,000 | 5,700 | 10.2% |
| LAKE | 29,670 | 27,460 | 2,210 | 7.4% |
| LASSEN | 9,750 | 9,200 | 560 | 5.7% |
| LOS ANGELES | 5,080,000 | 4,547,800 | 532,200 | 10.5% |
| MADERA | 63,000 | 57,200 | 5,700 | 9.1% |
| MARIN | 131,800 | 125,600 | 6,200 | 4.7% |
| MARIPOSA | 7,730 | 7,190 | 550 | 7.1% |
| MENDOCINO | 36,670 | 34,320 | 2,340 | 6.4% |
| MERCED | 116,600 | 104,100 | 12,400 | 10.7% |
| MODOC | 3,440 | 3,230 | 210 | 6.0% |
| MONO | 7,620 | 7,060 | 570 | 7.4% |
| MONTEREY | 225,900 | 209,300 | 16,500 | 7.3% |
| NAPA | 70,700 | 66,500 | 4,300 | 6.0% |
| NEVADA | 46,560 | 43,820 | 2,740 | 5.9% |
| ORANGE | 1,564,400 | 1,464,000 | 100,400 | 6.4% |
| PLACER | 185,600 | 175,500 | 10,100 | 5.4% |
| PLUMAS | 8,130 | 7,510 | 620 | 7.6% |
| RIVERSIDE | 1,113,500 | 1,026,000 | 87,500 | 7.9% |
| SACRAMENTO | 709,800 | 657,300 | 52,500 | 7.4% |
| SAN BENITO | 31,300 | 29,000 | 2,300 | 7.5% |
| SAN BERNARDINO | 976,400 | 898,300 | 78,100 | 8.0% |
| SAN DIEGO | 1,527,300 | 1,421,000 | 106,300 | 7.0% |
| SAN FRANCISCO | 551,500 | 521,400 | 30,000 | 5.4% |
| SAN JOAQUIN | 332,600 | 302,400 | 30,100 | 9.1% |
| SAN LUIS OBISPO | 130,800 | 123,200 | 7,600 | 5.8% |
| SAN MATEO | 432,700 | 411,200 | 21,500 | 5.0% |
| SANTA BARBARA | 221,800 | 208,700 | 13,100 | 5.9% |
| SANTA CLARA | 1,013,300 | 961,700 | 51,600 | 5.1% |
| SANTA CRUZ | 134,300 | 125,100 | 9,200 | 6.9% |
| SHASTA | 74,900 | 69,700 | 5,200 | 6.9% |
| SIERRA | 1,390 | 1,320 | 70 | 4.9% |
| SISKIYOU | 16,900 | 15,610 | 1,290 | 7.6% |
| SOLANO | 202,400 | 186,800 | 15,700 | 7.7% |
| SONOMA | 246,200 | 232,100 | 14,100 | 5.7% |
| STANISLAUS | 239,200 | 218,000 | 21,100 | 8.8% |
| SUTTER | 46,800 | 42,600 | 4,200 | 9.0% |
| TEHAMA | 25,700 | 23,770 | 1,930 | 7.5% |
| TRINITY | 4,800 | 4,520 | 270 | 5.7% |
| TULARE | 202,000 | 179,800 | 22,200 | 11.0% |
| TUOLUMNE | 19,830 | 18,340 | 1,490 | 7.5% |
| VENTURA | 408,800 | 382,600 | 26,300 | 6.4% |
| YOLO | 106,600 | 100,100 | 6,500 | 6.1% |
| YUBA | 30,200 | 27,600 | 2,700 | 8.8% |
Source: EDD
