


IMPORTANT NOTE: The employment data for the month of July 2021 is taken from the survey week including July 12. Data for the month of August is scheduled for release on Sept. 17, 2021.
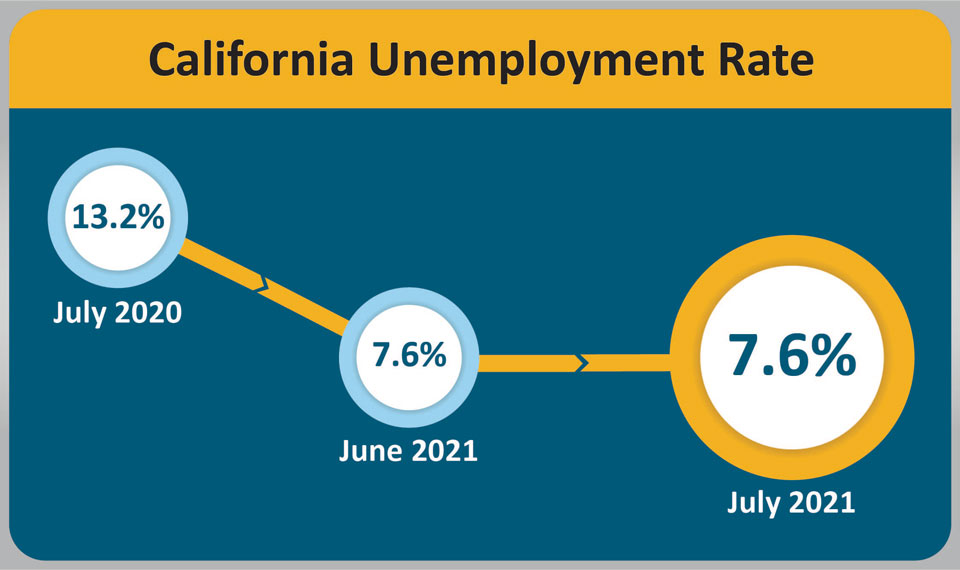
August 21, 2021 - SACRAMENTO – California’s unemployment rate remained at 7.6 percent in July as the state’s employers added 114,400 non-farm payroll jobs1, according to data released today by the California Employment Development Department (EDD) from two surveys. This comes after June’s unemployment rate was revised downward from 7.7 percent to 7.6 percent due to a downward-revised (-17,300) month-over decline in unemployed persons for the month.

California’s Labor Market, by the Numbers...
- The unemployment rate of 7.6 percent2 in July 2021 is 5.6 percentage points better than that of July 2020 and is California’s lowest unemployment rate since March 2020.
- From February 2021 through July 2021, California has added 671,100 total non-farm payroll jobs, which is an average of 111,850 jobs per month for that time period.
- Of the 2,714,800 jobs lost in March and April 2020 due to the COVID-19 pandemic, California has now regained 1,582,900 jobs (58.3 percent).
- Nine of California’s 11 industry sectors gained jobs in July. Leisure & Hospitality (+56,600) continued to have the state’s largest month-over increase for the sixth straight month thanks to significant increases in Food Services and Drinking Places.
- Educational & Health Services (+10,400) also did well due to increased hiring in telehealth and cybersecurity within healthcare firms.
- Manufacturing (-4,500) suffered the largest month-over job reduction due a large decrease in Transportation Equipment Manufacturing.
1. The nonfarm payroll job numbers come from a federal survey of 80,000 California businesses.
2. The unemployment rate comes from a separate federal survey of 5,100 California households.
Data Trends about Jobs in the Economy
Total Nonfarm Payroll Jobs
This comes from a monthly survey of approximately 80,000 California businesses that estimates jobs in the economy – seasonally adjusted.
- Month-over – Total nonfarm jobs in California’s 11 major industries totaled 16,529,000 in July – a net gain of 114,400 jobs from June 2021. This followed a downward revision of 2,000 jobs for a revised month-over gain of 71,500 jobs in June.
- Year-over – Total nonfarm jobs increased by 864,400 (a 5.5 percent increase) from July 2020 to July 2021 compared to the U.S. annual gain of 7,255,000 jobs (a 5.2 percent increase).

Total Farm jobs – The number of jobs in the agriculture industry decreased by 3,600 from June 2021 to 419,300 jobs in July. The agricultural industry has 25,400 more farm jobs in July 2021 than it did the July prior.
Data Trends about Workers in the Economy
Employment and Unemployment in California
This information is based on a monthly federal survey of 5,100 California households which focuses on workers in the economy.
- Employed – The number of Californians employed in July was 17,493,600, an increase of 56,000 persons from June’s total of 17,437,600 and up 1,225,600 from the employment total in July of last year.
- Unemployed – The number of unemployed Californians was 1,433,800 in July, a decrease of 5,800 over the month and down 1,029,700 in comparison to July of last year.

Unemployment Insurance Claims (Not Seasonally Adjusted)
The following data is from a sample week that includes the 19th of each month: In related data that figures into the state’s unemployment rate, there were 834,513 people certifying for Unemployment Insurance benefits during the July 2021 sample week. That compares to 592,867 people in June and 3,144,098 people in July 2020. Concurrently, 64,642 initial claims were processed in the July 2021 sample week, which was a month-over increase of 519 claims from June, but a year-over decrease of 179,864 claims from July 2020.

| COUNTY | LABOR FORCE | EMPLOYMENT | UNEMPLOYMENT | RATE |
|---|---|---|---|---|
| STATE TOTAL | 19,164,600 | 17,659,100 | 1,505,500 | 7.9% |
| ALAMEDA | 811,000 | 758,900 | 52,100 | 6.4% |
| ALPINE | 480 | 440 | 50 | 9.4% |
| AMADOR | 14,690 | 13,690 | 1,000 | 6.8% |
| BUTTE | 93,300 | 86,600 | 6,700 | 7.2% |
| CALAVERAS | 21,990 | 20,730 | 1,260 | 5.7% |
| COLUSA | 11,250 | 10,060 | 1,190 | 10.6% |
| CONTRA COSTA | 541,300 | 504,800 | 36,500 | 6.7% |
| DEL NORTE | 9,590 | 8,860 | 730 | 7.6% |
| EL DORADO | 91,500 | 86,100 | 5,400 | 5.9% |
| FRESNO | 449,200 | 407,400 | 41,800 | 9.3% |
| GLENN | 13,040 | 12,120 | 920 | 7.0% |
| HUMBOLDT | 59,600 | 55,800 | 3,800 | 6.4% |
| IMPERIAL | 68,000 | 55,100 | 12,800 | 18.9% |
| INYO | 8,380 | 7,890 | 490 | 5.9% |
| KERN | 380,800 | 340,100 | 40,800 | 10.7% |
| KINGS | 56,600 | 51,100 | 5,500 | 9.7% |
| LAKE | 29,360 | 27,180 | 2,190 | 7.4% |
| LASSEN | 9,680 | 9,130 | 560 | 5.7% |
| LOS ANGELES | 5,102,700 | 4,581,300 | 521,300 | 10.2% |
| MADERA | 61,800 | 56,100 | 5,600 | 9.1% |
| MARIN | 135,000 | 128,900 | 6,100 | 4.5% |
| MARIPOSA | 7,970 | 7,430 | 550 | 6.8% |
| MENDOCINO | 37,010 | 34,670 | 2,340 | 6.3% |
| MERCED | 118,500 | 106,300 | 12,100 | 10.2% |
| MODOC | 3,430 | 3,220 | 210 | 6.2% |
| MONO | 8,060 | 7,510 | 560 | 6.9% |
| MONTEREY | 229,700 | 213,800 | 15,900 | 6.9% |
| NAPA | 71,700 | 67,500 | 4,100 | 5.8% |
| NEVADA | 47,110 | 44,390 | 2,720 | 5.8% |
| ORANGE | 1,586,700 | 1,487,200 | 99,500 | 6.3% |
| PLACER | 186,900 | 176,900 | 10,000 | 5.3% |
| PLUMAS | 8,220 | 7,610 | 610 | 7.4% |
| RIVERSIDE | 1,123,700 | 1,035,300 | 88,400 | 7.9% |
| SACRAMENTO | 714,800 | 662,400 | 52,400 | 7.3% |
| SAN BENITO | 31,800 | 29,500 | 2,300 | 7.2% |
| SAN BERNARDINO | 985,600 | 907,200 | 78,400 | 8.0% |
| SAN DIEGO | 1,543,900 | 1,437,600 | 106,300 | 6.9% |
| SAN FRANCISCO | 561,600 | 532,400 | 29,200 | 5.2% |
| SAN JOAQUIN | 333,000 | 302,900 | 30,100 | 9.0% |
| SAN LUIS OBISPO | 131,200 | 123,700 | 7,500 | 5.7% |
| SAN MATEO | 441,100 | 420,000 | 21,200 | 4.8% |
| SANTA BARBARA | 222,100 | 209,300 | 12,900 | 5.8% |
| SANTA CLARA | 1,027,700 | 977,100 | 50,600 | 4.9% |
| SANTA CRUZ | 135,100 | 126,100 | 9,000 | 6.6% |
| SHASTA | 74,100 | 69,000 | 5,200 | 7.0% |
| SIERRA | 1,410 | 1,340 | 70 | 4.8% |
| SISKIYOU | 17,350 | 16,050 | 1,300 | 7.5% |
| SOLANO | 204,300 | 188,800 | 15,600 | 7.6% |
| SONOMA | 249,400 | 235,600 | 13,800 | 5.6% |
| STANISLAUS | 245,700 | 224,900 | 20,800 | 8.5% |
| SUTTER | 47,400 | 43,400 | 4,000 | 8.5% |
| TEHAMA | 25,610 | 23,680 | 1,920 | 7.5% |
| TRINITY | 4,800 | 4,520 | 280 | 5.8% |
| TULARE | 199,100 | 176,900 | 22,200 | 11.1% |
| TUOLUMNE | 20,080 | 18,580 | 1,500 | 7.5% |
| VENTURA | 411,300 | 385,100 | 26,200 | 6.4% |
| YOLO | 107,400 | 101,000 | 6,400 | 5.9% |
| YUBA | 30,500 | 27,800 | 2,700 | 8.8% |
Source: CA. EDD
