


IMPORTANT NOTE: The employment data for the month of August 2021 is taken from the survey week including Aug. 12th. Data for the month of September is scheduled for release on Oct. 22, 2021.
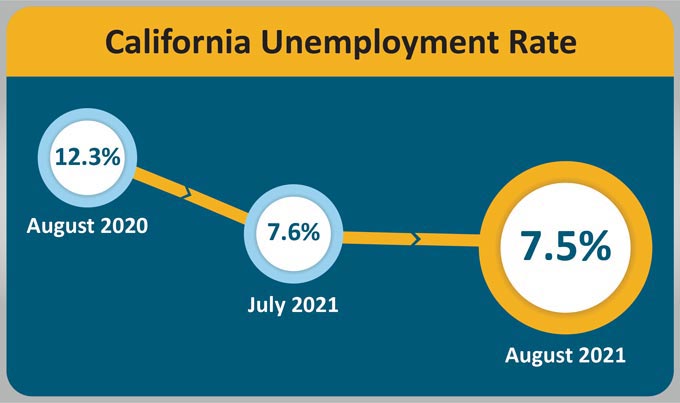
September 17, 2021 - SACRAMENTO – California’s unemployment rate decreased to 7.5 percent1 in August as the state’s employers gained 104,300 non-farm payroll jobs2, according to data released today by the California Employment Development Department (EDD) from two surveys. The state unemployment rate has now dropped 8.5 percent from its pandemic peak of 16 percent in April 2020.

California’s Labor Market, by the Numbers...
- California’s gain of 104,300 nonfarm jobs accounted for 44 percent of the nation’s 235,000 overall jobs gain in August 2021.
- From February 2021 through August 2021, California added 774,200 total non-farm payroll jobs – an unprecedented average of 110,600 jobs per month.
- Of the 2,714,800 jobs lost in March and April 2020 due to the COVID-19 pandemic, California has now regained 1,686,000 jobs (62.1 percent).
- Nine of California’s 11 industry sectors gained jobs in August. Government (+46,900) has the state’s largest month-over gain driven by hiring in Local Government Education as a new school year begins and public schools reopen.
- Professional & Business Services (+14,000) performed well as its Professional, Scientific, and Technical Services subsector has now regained all jobs it had lost since the beginning of the pandemic.
- Educational & Health Services (-6,300) had the largest month-over job reduction due a large decrease in Health Services.
1. The nonfarm payroll job numbers come from a federal survey of 80,000 California businesses.
2. The unemployment rate comes from a separate federal survey of 5,100 California households.
Data Trends about Jobs in the Economy
Total Nonfarm Payroll Jobs
This comes from a monthly survey of approximately 80,000 California businesses that estimates jobs in the economy – seasonally adjusted.
- Month-over – Total nonfarm jobs in California’s 11 major industries totaled 16,632,100 in August – a net gain of 104,300 jobs since July 2021. This followed a downward revised (-1,200 jobs) month-over gain of 113,200 jobs in July.
- Year-over – Total nonfarm jobs increased by 874,300 (a 5.5 percent increase) from August 2020 to August 2021 compared to the U.S. annual gain of 6,041,000 jobs (a 4.3 percent increase).

Total Farm jobs – The number of jobs in the agriculture industry decreased by 1,500 from July 2021 to 419,700 jobs in August. The agricultural industry has 18,000 more farm jobs in August 2021 than it did the August prior.
Data Trends about Workers in the Economy
Employment and Unemployment in California
This information is based on a monthly federal survey of 5,100 California households which focuses on workers in the economy.
- Employed – The number of Californians employed in August was 17,551,100, an increase of 57,500 persons from July’s total of 17,493,600, and up 1,185,800 from the employment total in August of last year.
- Unemployed – The number of unemployed Californians was 1,431,600 in August, a decrease of 2,200 over the month and down 869,700 in comparison to August of last year.

Unemployment Insurance Claims (Not Seasonally Adjusted)
The following data is from a sample week that includes the 19th of each month:
In related data that figures into the state’s unemployment rate, there were 638,976 people certifying for Unemployment Insurance benefits during the August 2021 sample week. That compares to 834,513 people in July and 2,837,209 people in August 2020. Concurrently, 63,553 initial claims were processed in the August 2021 sample week, which was a month-over decrease of 1,089 claims from July as well as a year-over decrease of 133,302 claims from August 2020.

| COUNTY | LABOR FORCE | EMPLOYMENT | UNEMPLOYMENT | RATE |
|---|---|---|---|---|
| STATE TOTAL | 19,024,400 | 17,600,200 | 1,424,300 | 7.5% |
| ALAMEDA | 807,100 | 757,000 | 50,000 | 6.2% |
| ALPINE | 480 | 440 | 40 | 8.9% |
| AMADOR | 14,780 | 13,800 | 980 | 6.6% |
| BUTTE | 93,100 | 86,800 | 6,300 | 6.8% |
| CALAVERAS | 22,030 | 20,800 | 1,230 | 5.6% |
| COLUSA | 11,400 | 10,340 | 1,060 | 9.3% |
| CONTRA COSTA | 538,500 | 503,500 | 35,000 | 6.5% |
| DEL NORTE | 9,760 | 9,070 | 690 | 7.1% |
| EL DORADO | 91,300 | 86,200 | 5,100 | 5.6% |
| FRESNO | 445,500 | 406,200 | 39,400 | 8.8% |
| GLENN | 12,730 | 11,850 | 880 | 6.9% |
| HUMBOLDT | 59,900 | 56,200 | 3,700 | 6.1% |
| IMPERIAL | 68,500 | 55,200 | 13,300 | 19.4% |
| INYO | 8,290 | 7,810 | 480 | 5.8% |
| KERN | 385,800 | 347,400 | 38,400 | 10.0% |
| KINGS | 55,900 | 50,800 | 5,100 | 9.1% |
| LAKE | 29,650 | 27,570 | 2,080 | 7.0% |
| LASSEN | 9,740 | 9,190 | 550 | 5.6% |
| LOS ANGELES | 5,023,800 | 4,538,300 | 485,400 | 9.7% |
| MADERA | 62,800 | 57,600 | 5,200 | 8.3% |
| MARIN | 133,600 | 127,700 | 5,900 | 4.4% |
| MARIPOSA | 7,830 | 7,310 | 520 | 6.6% |
| MENDOCINO | 36,700 | 34,460 | 2,240 | 6.1% |
| MERCED | 119,700 | 108,500 | 11,200 | 9.4% |
| MODOC | 3,450 | 3,250 | 200 | 5.8% |
| MONO | 9,000 | 8,460 | 530 | 5.9% |
| MONTEREY | 224,200 | 209,400 | 14,800 | 6.6% |
| NAPA | 71,000 | 67,100 | 3,900 | 5.5% |
| NEVADA | 47,860 | 45,230 | 2,630 | 5.5% |
| ORANGE | 1,580,600 | 1,485,700 | 94,900 | 6.0% |
| PLACER | 186,700 | 177,100 | 9,600 | 5.1% |
| PLUMAS | 8,200 | 7,560 | 640 | 7.8% |
| RIVERSIDE | 1,113,200 | 1,028,400 | 84,700 | 7.6% |
| SACRAMENTO | 713,400 | 663,300 | 50,100 | 7.0% |
| SAN BENITO | 31,500 | 29,400 | 2,200 | 6.9% |
| SAN BERNARDINO | 977,700 | 903,100 | 74,600 | 7.6% |
| SAN DIEGO | 1,533,600 | 1,431,800 | 101,700 | 6.6% |
| SAN FRANCISCO | 557,500 | 529,600 | 27,900 | 5.0% |
| SAN JOAQUIN | 334,300 | 305,900 | 28,400 | 8.5% |
| SAN LUIS OBISPO | 129,000 | 121,800 | 7,100 | 5.5% |
| SAN MATEO | 438,000 | 417,700 | 20,200 | 4.6% |
| SANTA BARBARA | 220,300 | 208,200 | 12,100 | 5.5% |
| SANTA CLARA | 1,024,200 | 975,500 | 48,700 | 4.8% |
| SANTA CRUZ | 134,400 | 126,000 | 8,500 | 6.3% |
| SHASTA | 74,800 | 69,900 | 4,900 | 6.5% |
| SIERRA | 1,390 | 1,320 | 70 | 5.0% |
| SISKIYOU | 17,260 | 16,010 | 1,240 | 7.2% |
| SOLANO | 203,500 | 188,600 | 14,900 | 7.3% |
| SONOMA | 248,700 | 235,500 | 13,200 | 5.3% |
| STANISLAUS | 246,400 | 226,800 | 19,700 | 8.0% |
| SUTTER | 47,200 | 43,500 | 3,700 | 7.9% |
| TEHAMA | 25,810 | 24,020 | 1,790 | 6.9% |
| TRINITY | 4,920 | 4,660 | 260 | 5.3% |
| TULARE | 201,200 | 180,100 | 21,100 | 10.5% |
| TUOLUMNE | 20,100 | 18,680 | 1,430 | 7.1% |
| VENTURA | 408,300 | 383,100 | 25,300 | 6.2% |
| YOLO | 107,300 | 101,300 | 6,000 | 5.6% |
| YUBA | 30,500 | 28,000 | 2,500 | 8.3% |
Source: EDD
