


California and National Drought Summary for October 19, 2021
Summary
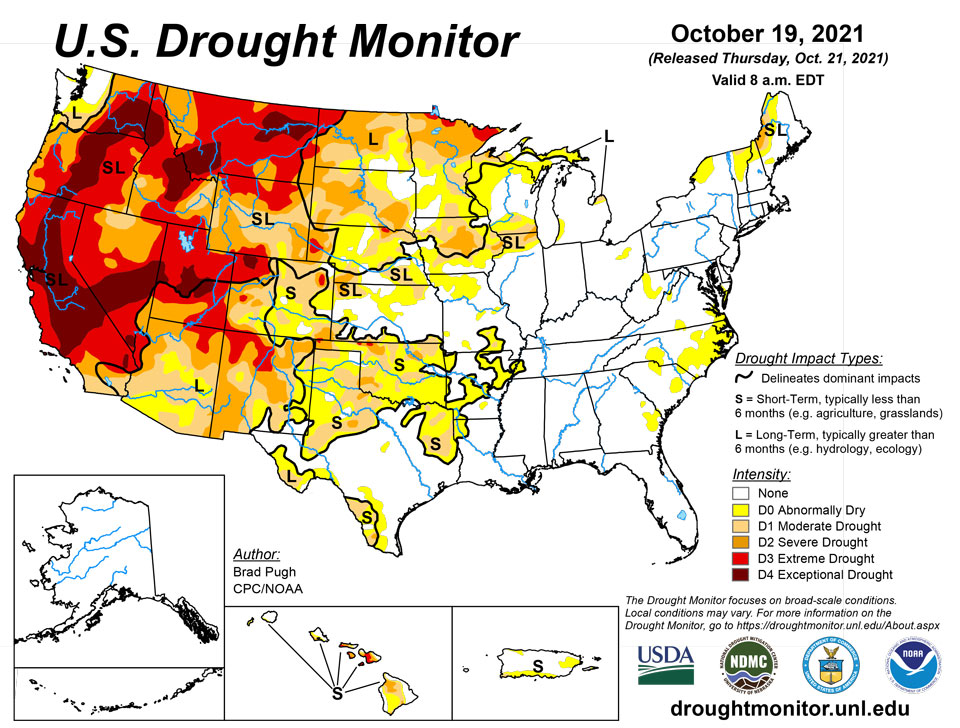
October 21, 2021 - A strong low pressure system resulted in widespread precipitation (0.5 to 3 inches, liquid equivalent) from the central Rockies east to the northern and central Great Plains from October 11 to 13. More than a foot of snow blanketed parts of Montana, Wyoming, and western South Dakota. Along a trailing cold front, heavy to excessive rainfall (1 to 3 inches, locally more) occurred across eastern Oklahoma and central to eastern Texas. As this front progressed eastward, scattered thunderstorms with locally more than one inch of rainfall swept across the Ohio and Tennessee Valleys. Much of New York and northern New England received 1 to 2.5 inches of rainfall on October 16. Only light weekly precipitation amounts (generally less than 1 inch, liquid equivalent) were observed along the Cascades, coastal ranges of the Pacific Northwest, and northern Sierra Nevada Mountains from October 12 to 18. Dry weather prevailed throughout much of the Southeast, Southwest, and northern Intermountain West during this 7-day time period. Southeastern Mainland Alaska and the Alaska Panhandle received near normal precipitation amounts during mid-October. Enhanced trade winds resulted in locally heavy rain across east-facing slopes of the Big Island of Hawaii recently. Locally heavy rainfall also occurred throughout Puerto Rico this past week. 7-day temperatures (Oct 12-18) remained above average across the eastern third of the U.S., while below average temperatures were observed over the West.
Northeast
Heavy rainfall (1 to 3 inches) this past week prompted a slight decrease in abnormal dryness (D0) across northern New York and the D0 to D1 areas of northern Vermont. However, there are lingering long-term precipitation deficits and 28-day average streamflows remain below average for parts of northern New York and northern New England.
Southeast
Abnormal dryness continues to expand across South Carolina due to increasing short-term precipitation deficits and worsening soil moisture. A couple of small areas of abnormal dryness (D0) were added to the coastal plain of Georgia due to 60-day precipitation deficits and soil moisture indicators such as GRACE. Small areas of abnormal dryness (D0) persist across parts of Virginia and its Piedmont region will be closely monitored in subsequent weeks. 30 to 60-day precipitation deficits continue to increase across eastern North Carolina where an addition of moderate drought (D1) may be required soon. The remainder of the Southeast has generally received above normal precipitation at the short and long-term time scales. Year-to-date precipitation surpluses exceed 20 inches across much of Alabama and the Florida Panhandle where precipitation has averaged 125 to 200 percent of normal since the beginning of the year.
South
Following rapid expansion of D0 (abnormal dryness) and D1 (short-term moderate drought) during September across Oklahoma and northwest Arkansas, above normal precipitation during the first half of October resulted in a continued decrease in the coverage of D0 and D1. Month-to-date rainfall amounts totaled 2 to 6 inches throughout much of central and eastern Oklahoma along with northwest Arkansas. Farther south into central Texas, recent heavy rainfall also supported minor modification to the ongoing D0 and D1 areas. Abnormal dryness (D0) was maintained for parts of southeast Oklahoma due to ongoing 30 to 60-day indicators and lower rainfall amounts during the past two weeks. Abnormal dryness (D0) and short-term moderate drought (D1) was expanded slightly to include more of southwest Arkansas and northwest Louisiana which missed out on the heavier rainfall this past week and precipitation deficits have increased. Moderate (D1) to severe (D2) drought continues to expand across west Texas where 60-day precipitation deficits range from 2 to 5 inches and soil moisture indicators have worsened.
Midwest
Recent rainfall and improving stream flows resulted in a 1-category improvement to parts of western and northern Minnesota, while insufficient precipitation during the past 30 days prompted an expansion of abnormal dryness (D0) from southeast Minnesota into parts of Wisconsin. Rainfall during mid-October resulted in a slight decrease in the southern extent of D0 and D1 areas of northern Illinois. Also, the spatial extent of D0 was decreased in Missouri based on 30-day precipitation and improving streamflows. SPIs at various time scales, 28-day average streamflows, and soil moisture remain near or above normal throughout the eastern Corn Belt and Ohio Valley.
High Plains
Widespread precipitation (1 to 3 inches, liquid equivalent) since 12Z on Oct 12 prompted a large 1-category improvement across the Dakotas and an adjustment to only show long-term drought impacts for much of the northern Plains. Excluding the northwest corner of North Dakota, 14-day precipitation amounts have totaled 2 to 6 inches. Extreme drought (D3) remains across northwest North Dakota, based on long-term SPIs and soil moisture below the 5th percentile. Improvements were also made across parts of Nebraska and Kansas due to weekly precipitation amounts of greater than 1 inch and soil moisture recovery. Likewise, an increase in soil moisture indicators resulted in small improvements across parts of Wyoming.
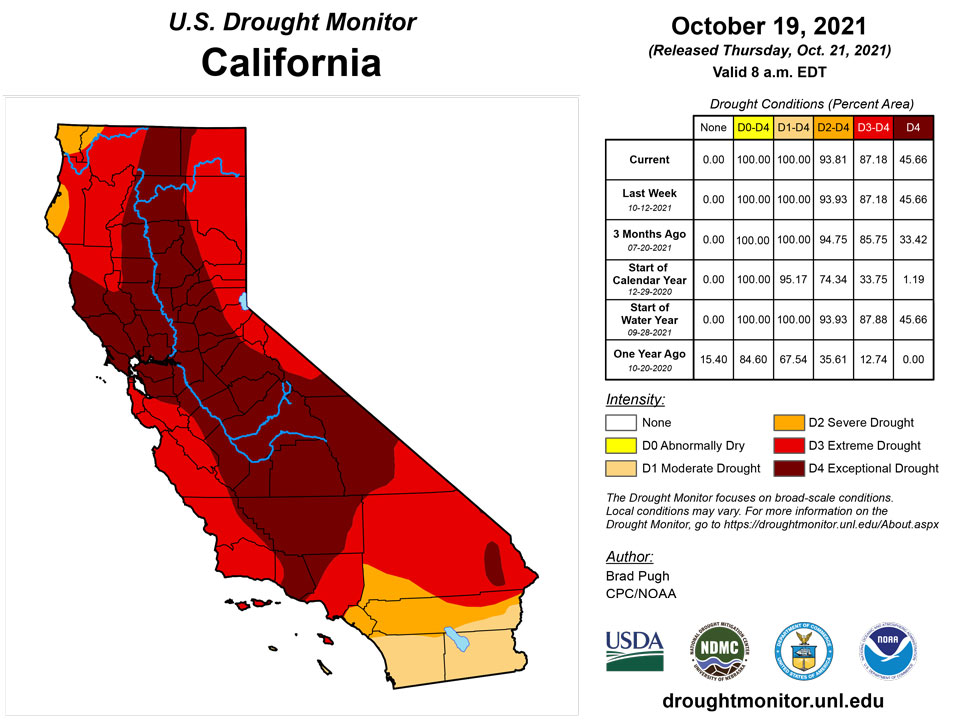
West
Severe (D2) to exceptional (D4) drought continues throughout much of the Pacific Northwest, California, and the Great Basin. Nearly all of this region remained status-quo in terms of drought changes as the Monsoon season ended and the wet season just began. A robust Monsoon brought an end to short-term drought impacts across Arizona and southern Utah, but long-term drought impacts persist. Along and west of the Cascades, above normal precipitation was observed across western Oregon and Washington since mid-September. This favorable start to the wet season along with improving streamflows and SPI values support the removal of small D4 in Douglas and Linn counties of Oregon. Periods of beneficial precipitation and cooler temperatures led to an improvement from D4 to D3 along the mountain range front in Utah. However, D4 persists across the Sevier River Basin of southern Utah. The increase in precipitation, related to the onset of the wet season, along with much cooler temperatures resulted in a large decrease in the number of large wildfires throughout the West during mid-October. Extreme drought (D3) was expanded across northwest Montana based on 28-day streamflows near the 5th percentile along with 30 to 60-day SPIs. Conversely, last week’s major storm prompted slight reduction in drought intensity across parts of eastern Montana.
Caribbean
According to AHPS, 7-day precipitation amounts across Puerto Rico averaged at or above normal from October 12 to 18. Based on recent rainfall, a 1-cateogroy improvement was made to northwest and southern Puerto Rico. Due to continued 60-day precipitation deficits and lower 28-day streamflows, D0 (abnormal dryness) and D1 (moderate drought) are maintained for parts of eastern Puerto Rico.
A moist tropical wave moved through the islands early in the USDM period, bringing widespread heavy rains to the U.S. Virgin Islands (USVI). Satellite estimates of weekly rainfall totals showed a strong southeast to northwest precipitation gradient across the region, with 4+ inches of rain in the southeast (over St. Croix) to 1 to 2 inches in the northwest (over St. Thomas). CoCoRaHS station rain gauge measurements ranged from 0.57 inch to 3.57 inches on St. Thomas, 3.11-6.85 inches on St. John, and 1.94-5.41 inches on St. Croix. The airport stations were generally on the lower end of the scale, with 0.44 inch at King AP (St. Thomas) and 2.37 inches at Rohlsen AP (St. Croix). The East Hill station (St. Croix) measured 4.64 inches of rain this week.
The October month-to-date total at Rohlsen AP was 3.85 inches, which is above normal. But even with this rain, the year-to-date and wet season totals are still below normal, with January-October and May-October still at D1 levels. The SPI (Standardized Precipitation Index) values were still at D0 (3- and 6-month time scales) to D2 (12-month) levels. The wet week this week and these percentiles and SPI values prompted the change on St. Croix from D1-SL to D1-L. With so much rain falling on the island, D-Nothing continued on St. Thomas. Nearly 8 inches (7.93) has been measured at the Windswept Beach CoCoRaHS station on St. John so far this month, with 3.99 inches at the CoCoRaHS station at Cruz Bay 1.6 E and 4.97 inches at Cruz Bay 0.8 NE. The heavy rains, and SPI values at Windswept Beach free of drought or abnormal dryness at all time scales from 1 month to 12 months, prompted the improvement of USDM status at St. John from D0-L to D-Nothing this week.
In spite of the recent rains, little improvement in groundwater has occurred. Groundwater at the USGS Grade School 3 well on St. Thomas showed some recovery early in the week, but resumed a decline as the week progressed. The groundwater level was in mid-range compared to the last 5 years. Groundwater at the USGS Adventure 28 well on St. Croix was near the lowest level it has been in the last 5 years. The level had been in steady decline; the recent rains stopped the decline but were not enough for any groundwater recovery. Groundwater at the USGS Susannaberg DPW 3 well on St. John showed significant recovery this week, but was still at historically low levels.
Pacific
Enhanced trade winds resulted in heavy rainfall along the east-facing slopes of the Big Island during mid-October, but this rainfall occurred in drought-free areas. Although rainfall was observed over drought areas of the northern Big Island, no changes were made this week. Severe (D2) to extreme (D3) drought continues across Maui and reports from producers that non-irrigated crops have significant yield reductions support this drought intensity.
The weather conditions across the U.S.-Affiliated Pacific Islands (USAPI) during this USDM week (10/13/21-10/19/21) consisted of several trade-wind surface troughs which migrated across Micronesia and a weak circulation early in the week over western areas. The surface convergence from the surface troughs interacted with upper-level divergence associated with a couple TUTT (Tropical Upper Tropospheric Trough) cells over the Marianas and northwest Yap State early in the week and over Chuuk and Pohnpei States later in the week. The NOAA Climate Prediction Center issued a La Niña Advisory to reflect the redevelopment of La Niña with the expectation that it will persist into spring 2022. Tropical cyclone activity in Micronesia tends to be reduced during La Niñas with trade winds a bit more prevalent than normal. High pressure dominated American Samoa.
Satellite-based estimates of 7-day precipitation (QPE) are available from two products: one using mainly infrared (IR) sensors (NESDIS GOES-R AHI) and the other incorporating microwave sensors (GPM IMERG). These QPE products showed a rainfall pattern consisting of patches of 1 to 4 inches roughly north of 5 degrees North latitude, and little to no rain south of that latitude; less than half an inch of precipitation was indicated for Tutuila in American Samoa.
Rain gauge totals were above the 1- or 2-inch weekly minimum needed to meet most water needs (“wet”) at some stations in the Marianas, Federated States of Micronesia (FSM), and the Marshall Islands (RMI), but they were below the weekly minimum (“dry”) at many others, especially in southern parts of the FSM. In the Marianas, weekly totals ranged from 0.92 inch at Guam to 1.29 inches at Dededo; in American Samoa they ranged from 0.10 inch at Pago Pago to 1.38 inches at the automated station at Toa Ridge; and in the Republic of Palau, they included 1.38 inches at Koror COOP and 1.54 inches at Palau IAP. The dry stations in the RMI included Ailinglaplap (with 0.30 inch for the week), Wotje (0.48), Jaluit (0.89), and Majuro (1.84). Kwajalein (2.18 inches) and Mili (2.84) were wet. Based on data received for the week, no rain was measured at Kapingamarangi and Nukuro, 0.15 inch was reported at Kosrae, and 0.20 inch at Lukunor. Reports at other dry stations in the FSM ranged from 0.82 inch at Pingelap to 1.98 inches at Woleai. The wet FSM stations included Pohnpei (2.01 inches), Chuuk (3.78), and North Fanif (4.67).
Reports have been received of some yellowing of vegetation on Kapingamarangi. No rain has been measured so far this week (with one day missing). It has been dry for the last 3 months. If no more rain falls for the rest of October, then this October (with 1.46 inches of rain so far) would rank as the sixth driest October out of 32 years of data (19th percentile); September-October (5.44 inches) would rank as 7th driest out of 28 years (25th percentile); and August-October (9.70 inches) would rank as 4th driest out of 25 years (16th percentile). These ranks and percentiles are mostly in the D1 range, so D1-SL continued at Kapingamarangi.
For Lukunor, Nukuoro, Pingelap, and Jaluit, this week and last week were dry and October to date is dry. But previous weeks and months have been wet. D-Nothing continued this week, but if next week is dry, that would make 3 consecutive dry weeks, so D0 could be considered for next week.
Wotje recorded 0.48 inch of rain this week, and October so far is dry, but last week was wet, so D-Nothing continued.
For the rest of the stations, those that were wet this week were also wet for October. Those stations that were dry this week were wet for last week/previous weeks and wet for October, so D-Nothing continued. No data has been received at Fananu and Utirik, so a drought analysis could not be made for those stations.
The Majuro reservoir level has been above the 80% threshold of concern (28.8 million gallons) for most of this month, but it has been declining for the last ten days and just dropped below the threshold on October 16. Majuro had 1.84 inches of rain this week but was wet the previous two weeks and has 8.98 inches so far this month, which is above the 8-inch monthly minimum needed to meet most water needs.
High pressure kept Pago Pago dry this week, but previous weeks, and the month so far, have been wet.
Looking Ahead
During the next 5 days (October 21 to 25), a series of low pressure systems with an increasingly strong onshore flow are likely to bring heavy to excessive precipitation (2 to 10 inches, locally more) to the Pacific Northwest and northern California. Elsewhere, the most widespread precipitation (0.5 to 2 inches) is forecast over the Corn Belt. Little to no precipitation is expected for much of the Great Plains, Southwest, Gulf Coast States, and East Coast. Along with the dry weather for the southern Great Plains, a return of above normal temperatures are forecast.
The CPC 6-10 day extended range outlook (valid from October 26 to 30) favors above normal temperatures across the central and eastern U.S. with below normal temperatures more likely for the West. Near to below normal temperatures are favored for a majority of Alaska. Above normal precipitation is likely across the Pacific Northwest, northern California, and the Great Basin, while below normal precipitation is most likely across the Southwest and southern high Plains. Probabilities for above normal precipitation are elevated from the Mississippi Valley to the East Coast.
Author(s):
Brad Pugh, NOAA/CPC
Richard Heim, NOAA/NCEI
Dryness Categories
D0 Abnormally Dry—used for areas showing dryness but not yet in drought, or for areas recovering from drought.
Drought Intensity Categories
D1 Moderate Drought
D2 Severe Drought
D3 Extreme Drought
D4 Exceptional Drought
Drought or Dryness Types
S Short-term, typically less than 6 months (agriculture, grasslands)
L Long-term, typically more than 6 months (hydrology, ecology)
SL Area contains both short- and long-term impacts
Source: National Drought Mitigation Center
