


IMPORTANT NOTE: The employment data for the month of September 2021 is taken from the survey week including September 12. Data for the month of October is scheduled for release on Nov. 19, 2021.
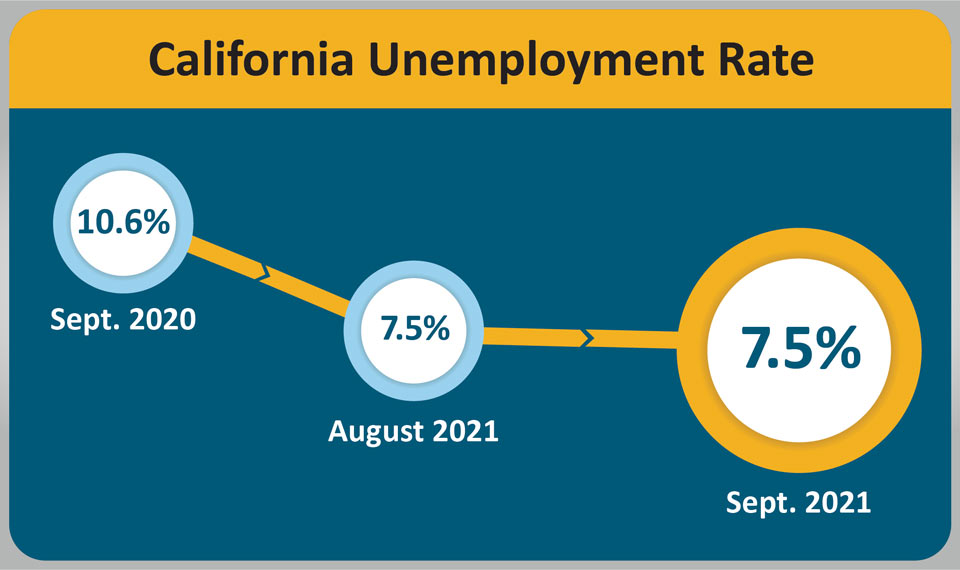
October 23, 2021 - SACRAMENTO – California’s unemployment rate held steady at 7.5 percent1 in September as the state’s employers added 47,400 non-farm payroll jobs2, according to data released today by the California Employment Development Department (EDD) from two surveys. This comes as the state has now regained 1,723,800, or 63.5 percent, of the 2,714,800 jobs that were lost in March and April 2020 due to the COVID-19 pandemic.

California’s Labor Market, by the Numbers...
- California’s gain of 47,400 nonfarm jobs accounted for nearly a quarter (24.4 percent) of the nation’s 194,000 overall jobs gain in September 2021.
- From February 2021 through September 2021, California has averaged approximately 101,500 monthly jobs gains in a robust employment recovery.
- Nine of California’s 11 industry sectors gained jobs in September. Leisure & Hospitality (+23,300) enjoyed the state’s largest month-over gain driven by strength in Performing Arts and Spectator Sports.
- Professional & Business Services (+6,900) also posted a notable gain thanks to increases in Computer Systems Design and Architectural and Engineering Services.
- Other Services (-3,700) suffered the largest month-over employment decline with more than half of its losses coming in Religious, Grants, Civic, and Professional and Like Organizations.
1. The unemployment rate comes from a separate federal survey of 5,100 California households.
2. The nonfarm payroll job numbers come from a federal survey of 80,000 California businesses.
Data Trends about Jobs in the Economy
Total Nonfarm Payroll Jobs
This comes from a monthly survey of approximately 80,000 California businesses that estimates jobs in the economy – seasonally adjusted.
- Month-over – Total nonfarm jobs in California’s 11 major industries totaled 16,669,900 in September – a net gain of 47,400 jobs since August 2021. This followed a downward revised (-9,600) month-over gain of 94,700 jobs in August.
- Year-over – Total nonfarm jobs increased by 795,800 (a 5.0 percent increase) from September 2020 to September 2021 compared to the U.S. annual gain of 5,688,000 jobs (a 4.0 percent increase).

Total Farm jobs – The number of jobs in the agriculture industry increased by 700 from August 2021 to 420,400 jobs in September. The agricultural industry has 16,900 more farm jobs in September 2021 than it did the September prior.
Data Trends about Workers in the Economy
Employment and Unemployment in California
This information is based on a monthly federal survey of 5,100 California households which focuses on workers in the economy.
- Employed – The number of Californians employed in September was 17,594,600, an increase of 43,300 persons from August’s total of 17,551,300, and up 1,159,100 from the employment total in September of last year.
- Unemployed – The number of unemployed Californians was 1,418,800 in September, a decrease of 12,700 over the month and down 531,300 in comparison to September of last year.

Unemployment Insurance Claims (Not Seasonally Adjusted)
The following data is from a sample week that includes the 19th of each month:
In related data that figures into the state’s unemployment rate, there were 493,987 people certifying for Unemployment Insurance benefits during the September 2021 sample week. That compares to 638,976 people in August and 2,801,538 people in September 2020. Concurrently, 78,878 initial claims were processed in the September 2021 sample week, which was a month-over increase of 15,325 claims from August, but a year-over decrease of 147,394 claims from September 2020.

| COUNTY | LABOR FORCE | EMPLOYMENT | UNEMPLOYMENT | RATE |
|---|---|---|---|---|
| STATE TOTAL | 19,041,600 | 17,825,000 | 1,216,600 | 6.4% |
| ALAMEDA | 805,200 | 763,000 | 42,200 | 5.2% |
| ALPINE | 480 | 440 | 40 | 8.0% |
| AMADOR | 14,710 | 13,870 | 840 | 5.7% |
| BUTTE | 93,800 | 88,400 | 5,400 | 5.7% |
| CALAVERAS | 21,840 | 20,810 | 1,040 | 4.7% |
| COLUSA | 11,240 | 10,300 | 940 | 8.4% |
| CONTRA COSTA | 537,400 | 507,600 | 29,800 | 5.5% |
| DEL NORTE | 9,530 | 8,950 | 590 | 6.1% |
| EL DORADO | 91,500 | 87,000 | 4,500 | 4.9% |
| FRESNO | 445,000 | 410,400 | 34,600 | 7.8% |
| GLENN | 12,870 | 12,140 | 730 | 5.7% |
| HUMBOLDT | 60,700 | 57,600 | 3,100 | 5.0% |
| IMPERIAL | 68,200 | 55,900 | 12,300 | 18.1% |
| INYO | 8,250 | 7,840 | 410 | 4.9% |
| KERN | 385,100 | 351,500 | 33,600 | 8.7% |
| KINGS | 56,300 | 51,900 | 4,500 | 8.0% |
| LAKE | 29,260 | 27,440 | 1,820 | 6.2% |
| LASSEN | 9,810 | 9,350 | 450 | 4.6% |
| LOS ANGELES | 5,034,500 | 4,621,500 | 413,000 | 8.2% |
| MADERA | 62,600 | 58,100 | 4,500 | 7.3% |
| MARIN | 133,900 | 129,100 | 4,800 | 3.6% |
| MARIPOSA | 7,730 | 7,290 | 440 | 5.7% |
| MENDOCINO | 36,960 | 35,060 | 1,900 | 5.1% |
| MERCED | 118,300 | 108,600 | 9,800 | 8.2% |
| MODOC | 3,390 | 3,220 | 170 | 5.1% |
| MONO | 8,420 | 7,950 | 460 | 5.5% |
| MONTEREY | 225,400 | 212,600 | 12,800 | 5.7% |
| NAPA | 71,300 | 68,000 | 3,300 | 4.6% |
| NEVADA | 47,730 | 45,510 | 2,220 | 4.6% |
| ORANGE | 1,582,000 | 1,502,200 | 79,800 | 5.0% |
| PLACER | 186,800 | 178,800 | 8,000 | 4.3% |
| PLUMAS | 7,990 | 7,460 | 530 | 6.7% |
| RIVERSIDE | 1,114,900 | 1,041,500 | 73,400 | 6.6% |
| SACRAMENTO | 712,400 | 669,300 | 43,100 | 6.1% |
| SAN BENITO | 31,600 | 29,700 | 1,900 | 6.0% |
| SAN BERNARDINO | 978,700 | 914,000 | 64,700 | 6.6% |
| SAN DIEGO | 1,534,700 | 1,448,600 | 86,100 | 5.6% |
| SAN FRANCISCO | 558,800 | 535,700 | 23,100 | 4.1% |
| SAN JOAQUIN | 333,100 | 308,200 | 24,900 | 7.5% |
| SAN LUIS OBISPO | 131,000 | 125,000 | 6,000 | 4.6% |
| SAN MATEO | 439,400 | 422,600 | 16,800 | 3.8% |
| SANTA BARBARA | 221,400 | 211,100 | 10,300 | 4.7% |
| SANTA CLARA | 1,027,100 | 986,800 | 40,300 | 3.9% |
| SANTA CRUZ | 134,200 | 127,100 | 7,200 | 5.4% |
| SHASTA | 75,000 | 70,800 | 4,200 | 5.6% |
| SIERRA | 1,410 | 1,350 | 60 | 4.3% |
| SISKIYOU | 17,240 | 16,160 | 1,080 | 6.2% |
| SOLANO | 202,600 | 189,700 | 12,800 | 6.3% |
| SONOMA | 249,600 | 238,400 | 11,200 | 4.5% |
| STANISLAUS | 244,900 | 227,900 | 17,000 | 6.9% |
| SUTTER | 46,200 | 42,900 | 3,300 | 7.1% |
| TEHAMA | 26,260 | 24,720 | 1,540 | 5.9% |
| TRINITY | 4,740 | 4,510 | 220 | 4.7% |
| TULARE | 200,500 | 181,800 | 18,700 | 9.3% |
| TUOLUMNE | 19,900 | 18,680 | 1,220 | 6.1% |
| VENTURA | 410,200 | 388,600 | 21,600 | 5.3% |
| YOLO | 107,300 | 102,200 | 5,100 | 4.7% |
| YUBA | 30,300 | 28,100 | 2,200 | 7.3% |
Source: CA. EDD
