


IMPORTANT NOTE: The employment data for the month of October 2021 is taken from the survey week including October 12. Data for the month of November is scheduled for release on December 17, 2021.
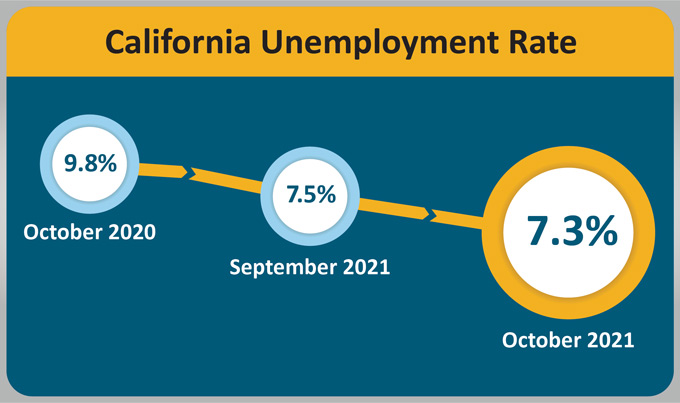
November 19, 2021 - SACRAMENTO – California’s unemployment rate fell to 7.3 percent1 in October as the state’s employers added 96,800 non-farm payroll jobs2 to the economy, according to data released today by the California Employment Development Department (EDD) from two surveys. Thanks to October’s job growth, the state has now regained 1,828,500, or 67.4 percent, of the 2,714,800 jobs that were lost in March and April 2020 due to the COVID-19 pandemic.

California’s Labor Market, by the Numbers...
- California’s gain of 96,800 nonfarm jobs accounted for roughly 18.2 percent of the nation’s 531,000 overall jobs gain in October 2021.
- From February 2021 through October 2021, California has averaged more than 100,000 payroll jobs gained each month helping lead the nation in job growth in 2021.
- Ten of California’s 11 industry sectors gained jobs in October with Professional & Business Services (+39,500) leading the way thanks to large gains in Employment Services.
- Leisure & Hospitality (+21,500) and Trade, Transportation, & Utilities (+14,900) also did well thanks to good growth in Food Services and Drinking Places, and strong hiring in the Retail Trade sector.
- Government (-4,000) was the only industry sector to lose jobs in October. The loss reflects reductions in city and county government, excluding Education.
1. The unemployment rate comes from a separate federal survey of 5,100 California households.
2. The nonfarm payroll job numbers come from a federal survey of 80,000 California businesses.
Data Trends about Jobs in the Economy
Total Nonfarm Payroll Jobs
This comes from a monthly survey of approximately 80,000 California businesses that estimates jobs in the economy – seasonally adjusted.
- Month-over – Total nonfarm jobs in California’s 11 major industries totaled 16,774,600 in October – a net gain of 96,800 jobs since September 2021. This followed an upward revised (+7,900) month-over gain of 55,300 jobs in September.
- Year-over – Total nonfarm jobs increased by 811,200 (a 5.1 percent increase) from October 2020 to October 2021 compared to the U.S. annual gain of 5,774,000 jobs (a 4.1 percent increase).

Total Farm jobs – The number of jobs in the agriculture industry decreased by 3,100 from September 2021 to 416,500 jobs in October. The agricultural industry has 7,400 more farm jobs in October 2021 than it did the October prior.
Data Trends about Workers in the Economy
Employment and Unemployment in California
This information is based on a monthly federal survey of 5,100 California households which focuses on workers in the economy.
- Employed – The number of Californians employed in October was 17,639,100, an increase of 32,700 persons from September’s total of 17,606,400, and up 588,800 from the employment total in October of last year.
- Unemployed – The number of unemployed Californians was 1,383,200 in October, a decrease of 41,200 over the month and down 471,200 in comparison to October of last year.

Unemployment Insurance Claims (Not Seasonally Adjusted)
The following data is from a sample week that includes the 19th of each month:
In related data that figures into the state’s unemployment rate, there were 463,257 people certifying for Unemployment Insurance benefits during the October 2021 sample week. That compares to 493,987 people in September and 1,650,946 people in October 2020. Concurrently, 59,879 initial claims were processed in the October 2021 sample week, which was a month-over decrease of 18,999 claims from September and a year-over decrease of 92,762 claims from October 2020.

| COUNTY | LABOR FORCE | EMPLOYMENT | UNEMPLOYMENT | RATE |
|---|---|---|---|---|
| STATE TOTAL | 19,103,500 | 17,936,800 | 1,166,700 | 6.1% |
| ALAMEDA | 809,500 | 769,400 | 40,100 | 5.0% |
| ALPINE | 470 | 430 | 40 | 7.7% |
| AMADOR | 14,760 | 13,930 | 830 | 5.6% |
| BUTTE | 94,700 | 89,500 | 5,200 | 5.4% |
| CALAVERAS | 21,660 | 20,650 | 1,010 | 4.7% |
| COLUSA | 11,180 | 10,250 | 930 | 8.3% |
| CONTRA COSTA | 540,700 | 511,900 | 28,800 | 5.3% |
| DEL NORTE | 9,500 | 8,930 | 570 | 6.0% |
| EL DORADO | 92,000 | 87,700 | 4,300 | 4.7% |
| FRESNO | 443,400 | 409,500 | 33,900 | 7.6% |
| GLENN | 12,930 | 12,230 | 700 | 5.4% |
| HUMBOLDT | 60,700 | 57,800 | 2,900 | 4.8% |
| IMPERIAL | 68,400 | 56,300 | 12,100 | 17.7% |
| INYO | 8,220 | 7,840 | 390 | 4.7% |
| KERN | 390,100 | 357,800 | 32,300 | 8.3% |
| KINGS | 56,200 | 51,800 | 4,400 | 7.9% |
| LAKE | 28,800 | 27,010 | 1,790 | 6.2% |
| LASSEN | 10,340 | 9,910 | 430 | 4.1% |
| LOS ANGELES | 5,027,300 | 4,632,800 | 394,500 | 7.8% |
| MADERA | 61,600 | 57,100 | 4,500 | 7.3% |
| MARIN | 134,300 | 129,700 | 4,600 | 3.4% |
| MARIPOSA | 7,520 | 7,100 | 420 | 5.6% |
| MENDOCINO | 36,750 | 34,900 | 1,850 | 5.0% |
| MERCED | 117,800 | 108,300 | 9,500 | 8.0% |
| MODOC | 3,450 | 3,290 | 160 | 4.6% |
| MONO | 8,020 | 7,550 | 470 | 5.9% |
| MONTEREY | 222,600 | 210,300 | 12,300 | 5.5% |
| NAPA | 71,100 | 67,900 | 3,200 | 4.5% |
| NEVADA | 47,740 | 45,610 | 2,140 | 4.5% |
| ORANGE | 1,588,300 | 1,512,900 | 75,400 | 4.7% |
| PLACER | 187,700 | 180,100 | 7,600 | 4.1% |
| PLUMAS | 7,800 | 7,270 | 530 | 6.7% |
| RIVERSIDE | 1,125,800 | 1,055,300 | 70,500 | 6.3% |
| SACRAMENTO | 715,700 | 674,000 | 41,700 | 5.8% |
| SAN BENITO | 31,800 | 30,000 | 1,900 | 5.8% |
| SAN BERNARDINO | 988,200 | 925,700 | 62,500 | 6.3% |
| SAN DIEGO | 1,553,900 | 1,471,000 | 82,900 | 5.3% |
| SAN FRANCISCO | 562,100 | 540,200 | 21,800 | 3.9% |
| SAN JOAQUIN | 333,100 | 309,000 | 24,100 | 7.2% |
| SAN LUIS OBISPO | 132,600 | 127,000 | 5,700 | 4.3% |
| SAN MATEO | 442,200 | 426,300 | 15,900 | 3.6% |
| SANTA BARBARA | 220,800 | 211,000 | 9,900 | 4.5% |
| SANTA CLARA | 1,034,500 | 996,300 | 38,200 | 3.7% |
| SANTA CRUZ | 134,200 | 127,300 | 6,900 | 5.2% |
| SHASTA | 75,400 | 71,300 | 4,100 | 5.4% |
| SIERRA | 1,390 | 1,330 | 60 | 4.3% |
| SISKIYOU | 17,320 | 16,290 | 1,040 | 6.0% |
| SOLANO | 202,400 | 190,000 | 12,400 | 6.1% |
| SONOMA | 249,300 | 238,700 | 10,600 | 4.3% |
| STANISLAUS | 241,500 | 224,900 | 16,600 | 6.9% |
| SUTTER | 46,300 | 43,100 | 3,200 | 6.8% |
| TEHAMA | 26,380 | 24,900 | 1,470 | 5.6% |
| TRINITY | 4,630 | 4,410 | 220 | 4.6% |
| TULARE | 199,200 | 180,900 | 18,300 | 9.2% |
| TUOLUMNE | 19,690 | 18,510 | 1,180 | 6.0% |
| VENTURA | 411,900 | 391,100 | 20,700 | 5.0% |
| YOLO | 107,200 | 102,300 | 4,900 | 4.6% |
| YUBA | 30,500 | 28,300 | 2,100 | 7.0% |
Source: EDD
