


December 20, 2021 - SACRAMENTO – California’s population declined by 173,000 between July 1, 2020 and July 1, 2021 to total 39.37 million, according to official population estimates released last Friday by the Department of Finance.
The 0.44-percent decline is slightly less than, but follows a similar pattern of, the population decline reported for the January 2021 calendar year estimates.
Three principal factors contributed once again to this net population decrease:
• Continuing declines in natural increase – births minus non-COVID-19 deaths. While natural increase for this period was 76,100, it represents slower growth, as past 12-month average increases were above 100,000.
• Continuing declines in foreign immigration (loss of 90,000), accelerated in recent years by federal policy.
• Deaths in 2020-21 separately associated with the COVID-19 pandemic [loss of 56,500]
Other factors contributing to the decrease include the loss of 53,000 international students due to pandemic restrictions, and declines in domestic in-migration.
In recent years, the first two factors – which mirror nationwide trends – have contributed to the state’s population growth slowing and plateauing. Though a new federal administration took office in January, immigration policies were not altered until late February, and lags in implementing these changes remain. The additional COVID-19-related deaths on top of these existing trends further compounded the annual loss.
Natural increase—births minus deaths—added 76,100 people to the state over the period with 420,300 births and 344,200 deaths. Births were down from 437,300 in the year ending July 1, 2020, while deaths were up from 280,300 in the preceding year, some due to the COVID-19 pandemic. While deaths are generally rising due to an aging population, state vital statistics data indicate the COVID-19 pandemic directly increased deaths for this period by 56,479.
“Excess deaths” — or, deaths above their pre-pandemic three-year average, but not attributed to a single factor—were observed in all counties, from 3.9 percent above average in Lake County to 29.3 percent above average in Imperial County. Seven counties had death rates at least 20 percent above average; 23 counties had rates between 10 and 20 percent above average, and 28 counties had death rates at less than 10 percent above average.
Since 2011, California has experienced negative net domestic migration, where the number of people moving out of the state in a year exceed the number moving in. Since 2016, net domestic outmigration has exceeded net international migration, leaving natural increase as the only source of population growth. However, with continuing fertility declines and increased 1 deaths from aging and the pandemic, natural increase did not offset the declines in net migration—total migration into the state minus total out-migration —during this period.
Net international migration to California declined significantly to 27,000 persons in fiscal year 2020-21, reflecting the suspension of visa processing in March 2020 through December 2020, which was extended to certain types of foreign worker visas through June 2021. Global travel restrictions during the pandemic also resulted in 53,000 fewer international students in California, a decline of 29 percent.
While net international migration added population during this period, negative domestic net migration outweighed these gains, resulting in an overall net migration loss of 249,200 residents. Domestic out-migration saw some increase, while domestic in-migration slowed considerably.
California’s 58 counties range in size from Alpine County, with just over 1,100 residents, to Los Angeles County with 9.9 million residents. The population increased in 20 counties largely in the Central Valley, the Sacramento Valley, and the Inland Empire. San Benito and Colusa counties had the highest growth rates, at 1.27 percent and 1.07 percent, respectively. Most inland counties had positive population growth rates, continuing a trend that started in 2016. No urban coastal counties gained population.
Counties in the San Francisco Bay Area had increasing outmigration flow. For the first time, all nine counties in the Bay Area had a drop in population, ranging from a -0.19 percent in Solano County to -1.77 percent in San Francisco. Distance work and school combined with restricted international travel led to a net loss of 15,400 persons between 2019-2020 and 2020-2021 in San Francisco. Alameda, Contra Costa, and Solano counties also declined in population for the first time since 2010.
Besides Bay Area counties, San Diego County registered its first 12-month period of negative population growth, due to declines in natural increase of about 5,000, losses of around 4,000 in international migration, and reductions in Group Quarters of around 4,000. Population also declined in seven of the ten counties with one million or more people: Alameda, Contra Costa, Los Angeles, Orange, San Bernardino, San Diego, and Santa Clara.
Group quarters (GQ) account for about two percent (793,200) of the state population. This total includes college dormitories (132,900), state and federal prisons (120,900), local jails (60,600), and military group quarters (55,500). Efforts to halt the spread of COVID-19 drove declines in the GQ population by 14 percent or 125,000. Dormitory population declined by 97,500 persons (42 percent) compared to the previous year, representing 78 percent of total change in GQ population. Additionally, 20 percent of the decline (25,600) occurred among the prison/jail population. Counties affected by GQ declines were Sacramento, which retained positive growth, and Del Norte, Lassen, Humboldt, San Louis Obispo, and Tuolumne counties, which saw negative growth.
Highlights of the July 1, 2021 county population report include:
- The state’s ten largest counties were Los Angeles, San Diego, Orange, Riverside, San Bernardino, Santa Clara, Alameda, Sacramento, Contra Costa, and Fresno, with each having more than one million residents. These ten counties represented 72 percent of California’s population. Only three of these counties (Riverside, Sacramento, and Fresno) had positive population growth. In addition, only Fresno and Riverside counties had positive population growth from net migration.
- Among the 10 counties with the highest numeric change, Riverside and San Joaquin counties had the largest gains, with growth largely due to net domestic migration. Fresno County’s growth reflected natural increase and moderate positive net migration.
- Since the 2010 Census, Los Angeles County’s population had grown to 10 million in 2013. The county continued to increase its population size to 10.1 million in 2017. However, Los Angeles County’s population began to decline in 2018 and fell below 10 million people in 2021.
- Population growth rates ranged from a high of 1.27 percent in San Benito County to a low of -4.76 percent in Butte County. Butte County was still losing population after the Camp Fire in November 2018; however, the magnitude was much slower than the previous year. The number of counties with negative population growth has increased each year across the decade. Thirty-eight counties had population losses this year.
- Although natural increase was a main source of population growth in the state, 26 counties experienced natural decrease—more deaths than births—an increase from 18 counties in the preceding year. Among those counties, natural decrease in El Dorado, Placer, and Shasta counties was offset by positive net migration, especially net domestic migration.
Background Information
Population estimates produced by the Department of Finance are mandated by the California Constitution and various codes. They are used by state agencies, California counties, academic institutions, private research organizations, the media, and the public. Primary uses include budgeting, needs assessment, program planning and evaluation, distribution of state funds, and the calculation of rates (such as birth, death, and incarceration).
Population estimates are developed using aggregate data from a variety of sources, including birth and death counts provided by the Department of Public Health, driver's license and driver’s license address change data from the Department of Motor Vehicles, housing unit data from local governments, school enrollment data from the Department of Education, and federal income tax return data from the U.S. Internal Revenue Service. These statistical reports of administrative records do not disclose any information about individuals. Due to the pandemic, many tax, license renewals, and other deadlines were extended, thus there may be larger than usual revisions to these estimates once more complete data is available.
Significant adjustments to the prison and college dorm population were made by transferring them into the household population:
- A majority of dormitory losses were shifted back into the household population. A proportion of students were kept in the county hosting the school while the remainder were returned to their county of origin. A small portion of students were removed from the state to represent out of state and international students.
- The prison population was shifted back into the household population by returning them to their intake counties using data from the California Department of Corrections and Rehabilitation.
This data series continues to use Census 2010 as the benchmark population since Census 2020 results with necessary detail are not yet available. The Department of Finance estimates population each year based on population changes in births, deaths, domestic migration, and international migration. Following the release of the 2020 Decennial Census PL 94-171 3 redistricting data in August 2021, the department closed a gap between the 2010- 2020 estimates series and 2020 Census data using intercensal population estimation methods consistent with those employed by the Census Bureau. Postcensal data years of July 2020 and July 2021 also used the 2010 estimates base due to the lack of detailed age data in the current census release.
This estimate reflects revisions to the preliminary July 1, 2020 state and county estimates released in December 2020. The preliminary estimate had the state population at 39,761,200 and this year’s revised estimate for 2020 is 39,541,800, a downward revision of 219,400. The change mostly reflects the process of controlling to Census 2020 data.
The pandemic has affected data sources used in the population estimates process. There also are indications the pandemic has altered recent population patterns in some parts of the state. Revisions to the estimates are likely. The report reflects the current release of initial 2020 Census results. Additional decennial census population, age and other data will be released in the coming year and incorporated into future estimates.
County ranking tables, maps, and the E-2 (California County Population Estimates and Components of Change by Year, July 1, 2010-2021) methodology and data tables are included. The E-2 and companion reports E-6 (Population Estimates and Components of Change by County, July 1, 2010-2021) and E-7 (California Population Estimates, with Components of Change and Crude Rates, July 1, 1900-2021), are on the Department's website: http://www.dof.ca.gov/Forecasting/Demographics/Estimates.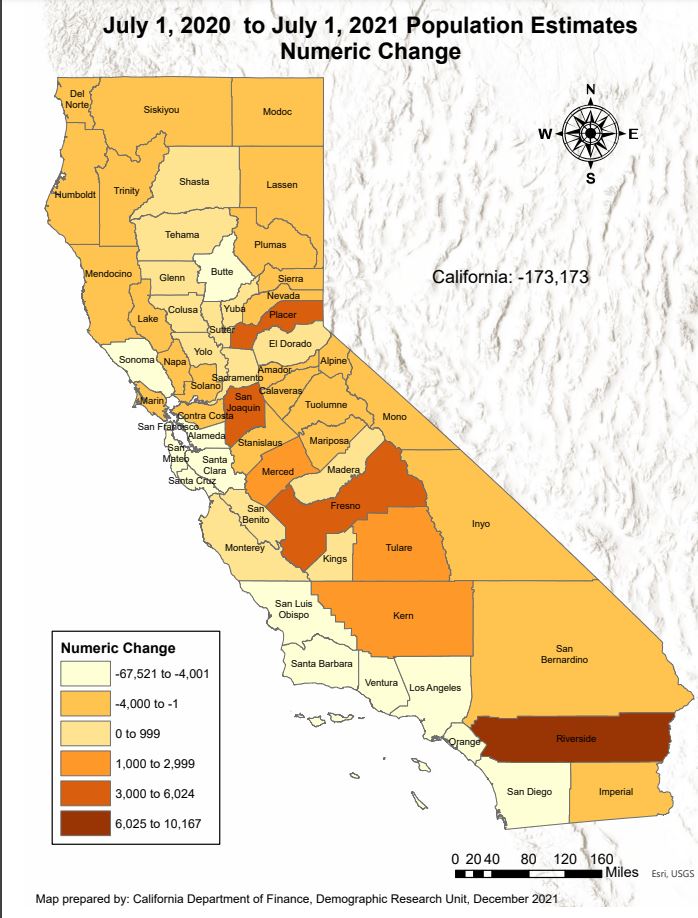
Source: CA. Dept; of Finance
California Population Declines Slightly By 173,000 in Fiscal Year 2020-2021 – Mariposa County With 17,044 Residents, Continues Yearly Loss of Residents With 79 Fewer Than 2020
- Details
