


California and National Drought Summary for December 21, 2021
Summary
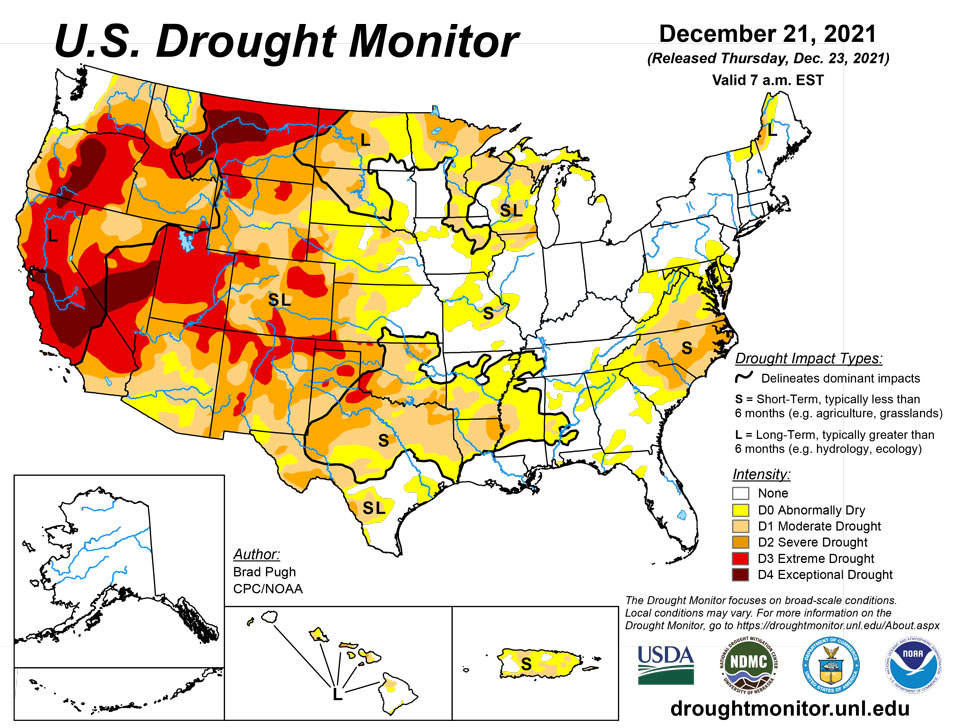
December 23, 2021 - On December 14, a strong mid-level low pressure system progressed inland into southern California where heavy precipitation (0.5 to 3 inches, liquid equivalent) occurred. As this area of mid-level low pressure continued to track eastward, a powerful surface low developed across the high Plains with a subsequent track northeastward to the upper Mississippi Valley. This intense low surface low resulted in widespread damaging winds and a dust storm across the central and southern Plains. The high winds and antecedent dryness contributed to a number of wildfires across Kansas, Oklahoma, and the Texas Panhandle. According to the Storm Prediction Center preliminary data, nearly two dozen tornadoes were reported across eastern Nebraska and Iowa on December 15. As this storm tracked northeast to the upper Mississippi Valley, widespread precipitation (0.5 to 2 inches, liquid equivalent) fell over this region with heavy snow blanketing northern Minnesota. A slow-moving cold front resulted in a widespread area of rainfall (0.5 to 3 inches) from the Ozarks Region south to the western Gulf Coast. On December 18, a wave of low pressure developed along the front which led to rainfall (0.5 to 3 inches, locally more) overspreading the Southeast. However, this rainfall remained south of the increasingly dry Mid-Atlantic. A series of low pressure systems and frontal passages resulted in 7-day amounts of 0.5 to 1.5 inches, liquid equivalent, throughout the Northeast. Periods of enhanced onshore flow continued to bring rain and high-elevation snow to the Pacific Northwest and northern Rockies through mid-December. The heaviest 7-day precipitation (2 to 5 inches, or more, liquid equivalent) was observed along and west of the Cascades in Oregon. Month-to-date temperatures (Dec 1-20) have averaged more than 6 degrees F above normal across the central and southern Great Plains. In contrast to the above-normal temperatures throughout nearly all of the central and eastern continental U.S. so far this month, temperatures have averaged below normal across most of California. Following the heavy precipitation associated with a Kona low earlier this month, enhanced trade winds continued to maintain a fairly wet pattern for Hawaii through mid-December. More than 1 inch of rainfall occurred across northeast Puerto Rico from December 14 to 20.
Northeast
Since the beginning of November, precipitation deficits continue to increase across the Mid-Atlantic. Washington, DC recorded only 1.15 inches of precipitation from Nov 1 to Dec 20. Based on increasing short-term precipitation deficits, 60-day SPI values, 28-day average streamflows, and declining soil moisture, abnormal dryness (D0) was expanded north to include more of Delaware, Maryland, New Jersey, and Pennsylvania.
Southeast
Short-term indicators such as soil moisture and 28-day streamflows supported an expansion of moderate drought (D1) across Virginia and western North Carolina. This D1 expansion was limited to areas that received less than 0.5 inch of rainfall this past week. Although impacts are minimized given the time of year, short-term indicators including SPI values strongly depict increasing coverage of D1 for the Piedmont and southern Appalachians. Severe drought (D2) was expanded north to include the Virginia Eastern Shore based on 30 to 90-day SPIs and groundwater indicators. Widespread rainfall of more than 1.5 inches prompted a decrease in D0 farther south across parts of South Carolina, Georgia, and Alabama.
South
Based on worsening soil moisture conditions and recent warmth and enhanced winds, severe drought (D2) was expanded to include all of the Oklahoma Panhandle and this D2 expansion included the northeast Texas Panhandle. Extreme drought (D3) increased across southwestern Oklahoma where a few locations have received less than 0.10 inch of precipitation during the past 70 days. As of December 21, no measurable precipitation has been recorded at Amarillo, Texas for 70 consecutive days which is the 4th longest streak on record. Abnormal dryness (D0) and D1 to D2 drought continue to expand across west-central Texas. Month-to-date temperatures (Dec 1-20) have averaged 6 to 10 degrees F above normal throughout Texas. Impacts, related to the expanding and worsening drought conditions across the southern Great Plains, include poor grazing for livestock. Farther to the east, moderate to heavy rainfall (1 to 3 inches, locally more) resulted in a 1-category improvement to parts of Arkansas, Louisiana, eastern Oklahoma, and eastern Texas. Despite the recent rainfall, 60 to 90-day SPI values continue to support D0 and D1 across eastern Texas and northern Louisiana. Moderate to heavy rainfall (1 to 3 inches) prompted a decrease in the abnormal dryness (D0) for parts of western Tennessee and northern Mississippi.
Midwest
Heavy precipitation (0.5 to 2 inches, liquid equivalent) for this time of year and longer term SPI values supported a 1-category improvement to parts of central and northeast Minnesota. Widespread precipitation of more than 1.5 inches prompted a decrease in abnormal dryness (D0) and moderate drought (D1) across southern Missouri along with a small reduction in D0 for southwestern Illinois, near the Mississippi River. However, a slight expansion of D1 was made to east-central Missouri which remained north of the swath of moderate to heavy rainfall this month.
High Plains
Based on 60 to 90-day SPI values and soil moisture, abnormal dryness (D0) and moderate drought (D1) were expanded across parts of southern Nebraska and western Kansas. Severe drought (D2) increased across southeastern Colorado and southwestern Kansas due to rapidly worsening soil moisture and the EDDI. Based on below-average SWE and SPI, the Sangre de Cristo Mountain Range was degraded to extreme drought (D3). Minor improvements were made to parts of North Dakota due to recent snowfall and above-normal precipitation dating back through the fall.
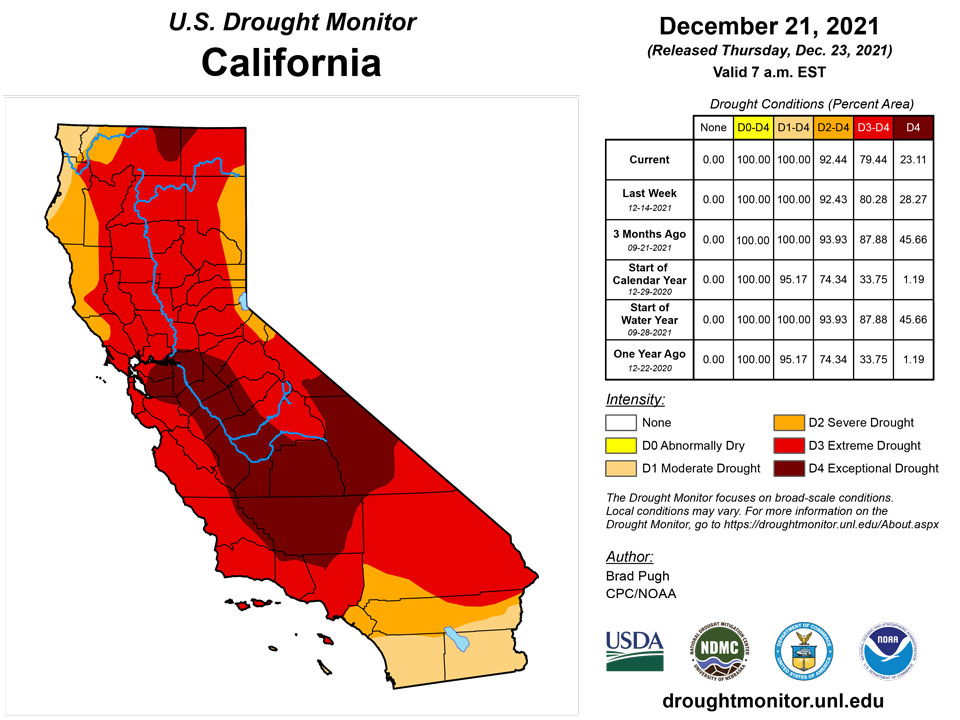
West
During early to mid-December, precipitation averaged more than 150 percent of normal across much of California along with western areas of Oregon and Washington. According to the California Department of Water Resources as of Dec 21, snow water equivalent (SWE) statewide is 93 percent of normal. During the past two weeks, temperatures have averaged 2 to 4 degrees F below normal which has contributed to the favorable snow water content numbers through mid-December. Above-normal precipitation during the past two weeks, current SWE numbers, and 12 to 24-month SPI considerations supported a reduction of D4 (exceptional drought) across much of the Sierra Nevada Mountains. Also, D4 was decreased to the north of Los Angeles due to recent heavy precipitation. As a result of December precipitation, a slight decrease in extreme drought (D3) was made to the north of San Francisco. The exceptional drought (D4) was eliminated from southern Nevada and southeastern California due to the lack of support from long-term SPI values. A persistent wet pattern resulted in a 1-category improvement to western Oregon as longer term indicators slowly improve. As of Dec 20, Oregon statewide SWE is at 95 percent of normal with generally above average SWE along and west of the Cascades but continued below average SWE throughout northeastern Oregon. WYTD (Oct 1-Dec 20) precipitation along with assessment of long-term SPIs resulted in a 1-category improvement to western Idaho and adjacent Washington. Recent heavier precipitation, especially at the higher elevations, resulted in improving drought conditions throughout many locations of Montana. The areas of exceptional drought (D4) were decreased due to recent wetness and lack of support from longer term SPIs. Due to current low SWE, there is growing concern for worsening conditions across the Bear and Snake River basins of southern Idaho. These ongoing low SWE numbers supported a 1-category degradation for parts of southern Idaho and adjacent areas of western Wyoming. Due to recent dryness and rapidly worsening soil moisture, D3 was expanded to include more of northeast New Mexico.
Caribbean
According to AHPS, 7-day precipitation amounts from Dec 14 to 20 across Puerto Rico averaged at or above normal. The drought depiction for Puerto Rico will be reassessed next week.
Warmer- and drier-than-normal conditions have been in place for much of the month across the U.S. Virgin Islands. Through December 21, rainfall at the territory’s major airport observation sites totaled 1.18 inches (49% of normal) at Henry E. Rohlsen Airport on St. Croix and 1.24 inches (59%) at Cyril E. King Airport on St. Thomas. The lack of December rainfall follows a disappointingly dry end to the islands’ autumn wet season. As a result, Rohlsen Airport is very close to experiencing its driest year on record (for years with complete weather data); currently, the annual record of 21.61 inches was set in 2002. From January 1 – December 21, 2021, rainfall at Rohlsen Airport totaled 21.46 inches, just 59% of normal. The dryness on St. Croix, at multiple time scales, continues to support the designation of extreme drought (D3-SL). In addition, depth to water at the U.S. Geological Survey’s Adventure 28 Well increased to 28.91 feet by December 22, a modern record, although greater depths were noted at times in the 1980s and early 1990s, before the well went off-line for more than two decades.
Through December 21, the month-to-date average temperature at Rohlsen Airport was 81.7°F, or 2.6°F above normal. The airport’s record-high December average temperature of 81.3°F was set in 1998. Meanwhile, Rohlsen Airport has experienced more days of 90-degree heat this month (five occurrences, on December 1, 2, 4, 5, and 8) than during all other years combined from 1951 to 2020. There were single days of 90-degree heat at Rohlsen Airport in December 1963, 1972, 1995, and 1998. King Airport on St. Thomas has also been warm, with a December 1-21 average temperature of 81.8°F, or 0.8°F above normal.
During the drought-monitoring period ending December 21, rainfall from the airport and CoCoRaHS observation sites indicated totals ranging from 0.30 to 1.07 inches. Although daily showers have occurred at many locations in recent days, amounts have been mostly light. As a result, there are also no changes to the drought depiction for the northern islands, with moderate drought (D1-SL) continuing on St. John and severe drought (D2-SL) persisting on St. Thomas.
Pacific
Following widespread, heavy precipitation from a Kona low earlier this month and a favorable response among agricultural and streamflow indicators, a 1-category improvement was made to most of the Hawaiian Islands. Also, the windward areas remained wet this past week. Although there could be localized areas of short-term dryness and impacts, the recent wetness prompted a change to a designation of long-term drought impacts only for Hawaii.
Alaska remains drought-free with periods of much below normal temperatures continuing to affect the state during the past couple of months.
An active pattern continued across many of the U.S.-Affiliated Pacific Islands. As the previous drought-monitoring period ended, Tropical Storm Rai – later a super typhoon – traversed the Republic of Palau, passing north of Koror late December 14. Another area of disturbed weather (Joint Typhoon Warning Center Invest 98W) passed through the southern reaches of the Federated States of Micronesia during the monitoring period, delivering locally heavy showers before dissipating. However, seasonably drier weather has recently developed across some northern areas, including portions of the Mariana Islands and Republic of the Marshall Islands.
In the Republic of Palau, month-to-date (December 1-21) rainfall at Palau International Airport totaled 11.95 inches. Month-to-date rainfall has also been above normal and has topped 10 inches at several locations in the Federated States of Micronesia, including Chuuk (16.77 inches), Pohnpei (13.38 inches), and Yap (10.34 inches). Woleai was set to “missing,” as daily rainfall data has not been received regularly since early December. Meanwhile, Kapingamarangi had a previously wet monitoring period (more than 6 inches of rain fell during the week ending December 14), but has since turned mostly dry again. With ongoing drought impacts and the return of generally dry weather for Kapingamarangi, the designation of extreme drought (D2-SL) was retained.
The Marianas have trended a bit drier in recent days, but due to earlier wetness all islands remain free of dryness and drought. Through December 21, month-to-date rainfall included 4.23 inches at Guam International Airport and 3.57 inches at Saipan International Airport. Meanwhile in the Republic of the Marshall Islands, D0-S was introduced for Wotje, where completely dry weather has prevailed for the last 2 weeks. A few other sites in the RMI, including Kwajalein, are being monitored due to the recent drying trend, but remain free of dryness and drought. Kwajalein received rainfall totaling 0.25 inch from December 15-21 and has noted a month-to-date sum of 3.62 inches, following a November total of 14.47 inches. Southern islands in the RMI remain generally wet, with month-to-date totals greater than 10 inches on Mili and Jaluit.
Elsewhere, American Samoa continued to receive adequate rain, with Pago Pago International Airport reporting 2.45 inches on December 16-17 and a month-to-date sum of 6.29 inches. American Samoa’s two National Park Service observation sites – Siufaga Ridge and Toa Ridge – reported weekly rainfall exceeding 2 inches.
Looking Ahead
Heavy rain and high-elevation snow are forecast from the West Coast east to the Continental Divide from Dec 23 to 27. According to the Weather Prediction Center, 5-day precipitation amounts could total more than 5 inches, liquid equivalent, along the coastal ranges of the West Coast, Cascades, and Sierra Nevada Mountains. Moderate to heavy precipitation is also forecast to occur across the Great Basin and Four Corners region. Dry weather and above-normal temperatures are likely to persist across the central and southern Great Plains. A mixture of rain and snow is forecast from the Great Lakes east to the Northeast from Dec 23 to 27 with little or no precipitation continuing throughout the Mid-Atlantic. Following beneficial rainfall across the lower Mississippi Valley, western Gulf Coast, and parts of the Southeast during mid-December, dry weather is forecast through Dec 27.
The Climate Prediction Center’s 6-10 day outlook (valid Dec 28, 2021-Jan 1, 2022) favors above-normal temperatures across the East, Gulf Coast States, and southern Great Plains. Below-normal temperatures are likely across the upper Mississippi Valley, northern to central Great Plains, and West. Probabilities for below-normal temperatures exceed 90 percent for parts of the northern Rockies and Pacific Northwest. Near to above-normal temperatures are favored for much of Mainland Alaska, while below-normal temperatures are more likely to persist across the Alaska Panhandle. Near or above-normal precipitation is favored for nearly all of the continental U.S. with only slightly elevated probabilities for below-normal precipitation forecast across the Florida Peninsula.
Author(s):
Brad Pugh, NOAA/CPC
Brad Rippey, U.S. Department of Agriculture
Dryness Categories
D0 Abnormally Dry—used for areas showing dryness but not yet in drought, or for areas recovering from drought.
Drought Intensity Categories
D1 Moderate Drought
D2 Severe Drought
D3 Extreme Drought
D4 Exceptional Drought
Drought or Dryness Types
S Short-term, typically less than 6 months (agriculture, grasslands)
L Long-term, typically more than 6 months (hydrology, ecology)
SL Area contains both short- and long-term impacts
Source: National Drought Mitigation Center
