


California and National Drought Summary for January 25, 2022
Summary
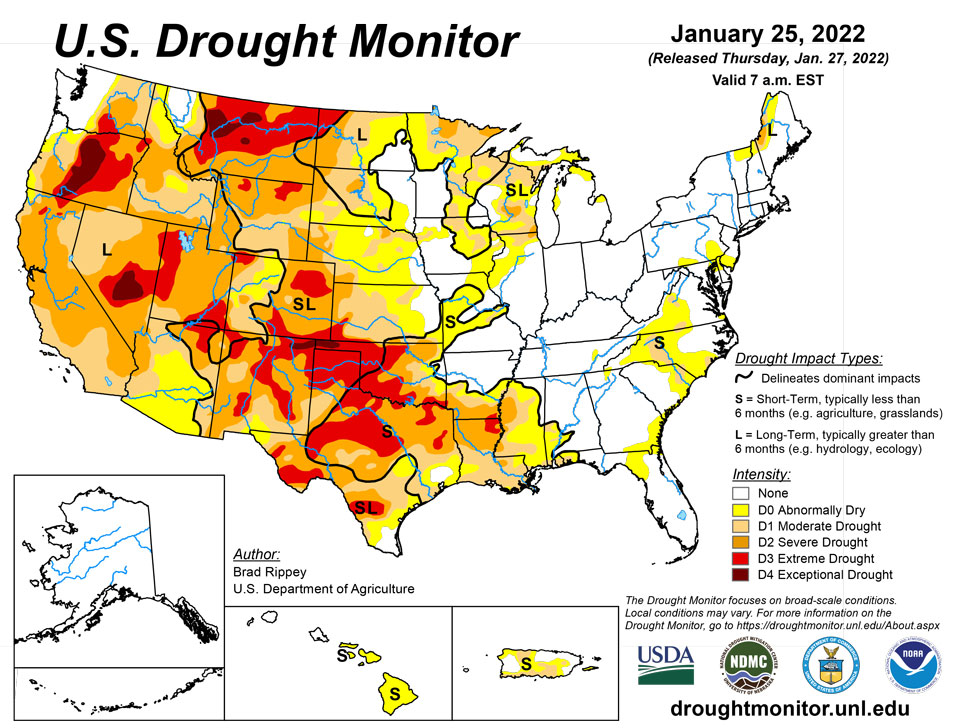
January 27, 2022 - As the drought-monitoring period began on January 18, a moisture-laden storm had just cleared the Atlantic Coast States. A few days later, another system delivered a variety of weather, including rain, freezing rain, sleet, and snow, across parts of the South. The latter storm produced significant snow on January 21-22 near the middle Atlantic Coast, including eastern North Carolina and southeastern Virginia. Most of the remainder of the country experienced a dry week, aside from periods of mostly light precipitation from the Pacific Northwest to the Great Lakes States. However, completely dry weather prevailed through January 24 in several areas, including California and the parched southern Plains, where 71 percent of Texas’ winter wheat was rated in very poor to poor condition. As the drought-monitoring period ended early January 25, some snow developed on the northern and central High Plains, while rain returned along and near the Gulf Coast. Elsewhere, frigid conditions from the Midwest into the Northeast and generally chilly conditions across the eastern half of the country contrasted with near- or above-normal temperatures farther west.
Northeast
Following significant inland snowfall and coastal rain on January 17, cold, mostly dry weather developed across the Northeast. In fact, some northern locations reported temperatures of -30°F or below. On January 21-22 in New York, Saranac Lake (-31°F both days) and Massena (-30°F both days) posted consecutive daily-record lows. With the cold, dry pattern in place, any remaining dryness (D0) and moderate to severe drought (D1 to D2) across northern New England was literally frozen in place. Farther south, coverage of D0 in West Virginia and environs was trimmed, following further assessment of soil moisture, streamflow, and other data in the wake of the mid-January snow and ice storm.
Southeast
Back-to-back storms, including the system at the end of the previous drought-monitoring period, have led to general improvement in the drought situation across Virginia and the Carolinas. As a result, abnormal dryness (D0) and moderate drought (D1) were broadly trimmed where the heaviest precipitation occurred, most notably in eastern North Carolina. On January 21-22, the second storm produced significant snow in eastern North Carolina and southeastern Virginia. In fact, Norfolk, Virginia, measured consecutive daily-record snowfall amounts (3.2 and 3.5 inches, respectively). Other record-setting totals for January 21 included 1.5 inches in Raleigh-Durham, North Carolina, and 0.2 inch in Athens, Georgia. Athens had received 1.8 inches of snow from the earlier storm, on January 16. According to the U.S. Department of Agriculture, nearly three-quarters (74%) of North Carolina’s winter wheat was rated in good to excellent condition on January 23, up from 62% at the end of 2021. Elsewhere, a small area of D0 was retained in southeastern Virginia, where several wells continued to reflect low groundwater levels.
South
Locally heavy rain delivered some drought relief from southeastern Texas to central Mississippi, but largely bypassed other areas of the South. In fact, worsening drought conditions were noted across the southern Great Plains, including large sections of Oklahoma and Texas. Some of the most significant Southern rain fell on January 19-20, when totals approached, reached, or exceeded 2 inches in locations such as Houston, Texas (1.98 inches), and Vicksburg, Mississippi (2.06 inches). Additional rain fell across the Deep South on January 24-25. Farther north and west, however, drought broadly worsened, with exceptional drought (D4) expanding slightly in western Oklahoma. On January 23, according to the U.S. Department of Agriculture, topsoil moisture was rated 81% very short to short in Oklahoma and 64% very short to short in Texas. On the same date, winter wheat was rated 71% very poor to poor in Texas, along with 43% in Oklahoma. Just 3 months ago, in late-November 2021, those numbers stood at 45 and 16% very poor to poor, respectively. Worsening drought on the Plains has also contributed to several mid-winter wildfires; a few, including the Mill Creek Fire in Shackleford County, Texas—which was ignited on January 15—torched more than 1,000 acres of brush and grass. Burn bans were in effect for dozens of counties in Oklahoma and Texas.
Midwest
Like the Northeast, much of the Midwest experienced cold weather, accompanied by brief periods of light snow. Changes in the depiction were limited to the southern tier of the region, mainly across Illinois and Missouri. In those southern areas, ongoing short-term precipitation deficits led to modest expansion of abnormal dryness (D0) and moderate drought (D1). In Missouri, topsoil moisture was rated 33% very short to short on January 23, according to the U.S. Department of Agriculture.
High Plains
Despite some snow on the High Plains late in the drought-monitoring period, the general theme was toward gradually worsening drought conditions, especially in Kansas and Nebraska. U.S. Department of Agriculture statistics from January 23 reflected some of the issues being faced by farmers, with topsoil moisture rated at least one-half very short to short in Colorado (82%), Kansas (77%), Nebraska (73%), and Wyoming (60%). In addition, at least one-quarter of the winter wheat was rated very poor to poor on that date in Kansas (31%), Wyoming (33%), Colorado (40%). Even in the Dakotas, where some drought recovery has occurred in recent months, topsoil moisture was greater than 40% very short to short. In addition, stock water supplies in North Dakota were reported to be 50% very short to short.
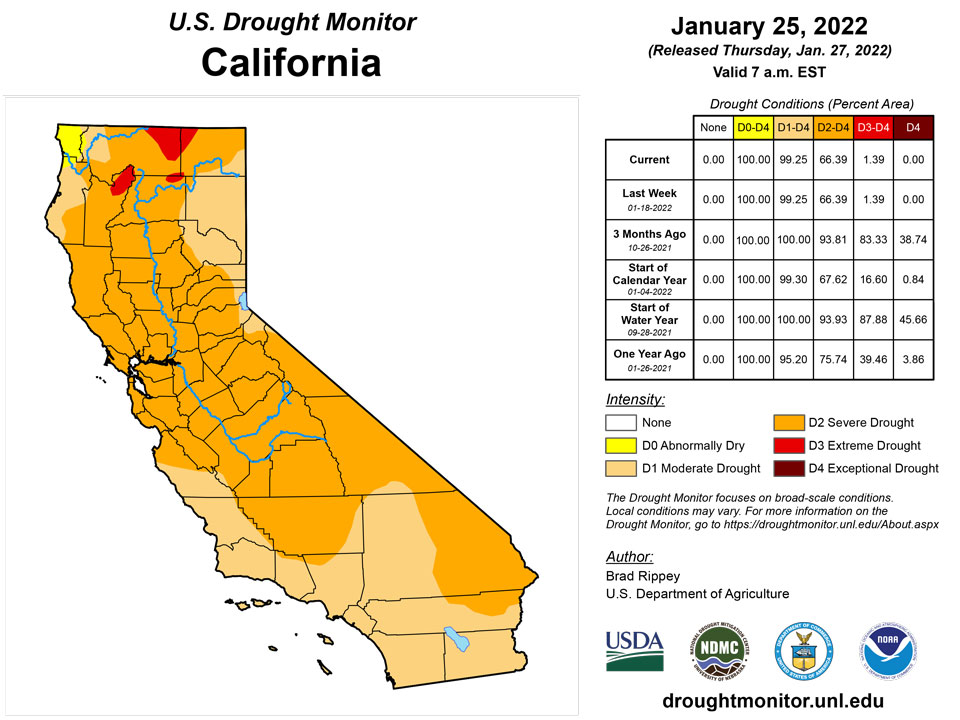
West
Much of the region has experienced alternating periods of wet and dry weather since the Water Year began on October 1, 2021. For example, a wet October was followed by a warm, dry November; an exceptionally stormy December; and a mild, dry January. As the West moves into the second half of its winter wet season, a return to stormy weather will be needed to sustain the drought improvement that occurred during October and December. According to the California Department of Water Resources, the water equivalency of the Sierra Nevada snowpack increased less than an inch (from 15.4 to 16.0 inches) between December 30 and January 26, with the corresponding percent of average for the date falling from 160 to 103%. Compared to normal values, snow-water equivalency was appreciably lower (less than two-thirds of average in several river basins) across the eastern slopes of the Rockies, especially in eastern Wyoming and much of New Mexico, resulting is some drought deterioration. In New Mexico, topsoil moisture was rated 87% very short to short on January 23, according to the U.S. Department of Agriculture, while stock water supplies were 49% very short to short. With the recent dryness, compounded by long-term drought issues and warm, windy weather, a rare January wildfire—the 700-acre Colorado Fire—erupted near Big Sur, California, on January 21.
Caribbean
In Puerto Rico, rainfall during the drought-monitoring period was generally light, resulting in minimal change in the commonwealth’s drought depiction. However, abnormal dryness (D0) was expanded to include Puerto Rico’s eastern islands of Culebra and Vieques.
A mid- to upper-level ridge of dry and stable air dominated the weather across the U.S. Virgin Islands during this USDM week. Shallow areas of moisture embedded in the trade winds brought occasional passing showers, but rainfall totals were light. Radar- and satellite-based estimates of 7-day precipitation (QPE) indicated only a couple tenths of an inch of rain, at best, fell over the islands.
On St. John, CoCoRaHS rainfall observations for this week were very dry, ranging from 0.03 inch to 0.17 inch. The monthly total of 1.39 inches at the long-term Windswept Beach CoCoRaHS station is about 58% of the long-term average for January to date. Standardized Precipitation Index (SPI) values at Windswept Beach range from D0 at the 9-month time scale to D4 at the 3-month time scale, with D1 at the other time scales. This week the USGS Susannaberg DPW 3 Well continued its steady decline in groundwater levels of the past several weeks. D2-SL continues for the island.
On St. Thomas, CoCoRaHS precipitation observations ranged from zero to 0.30 inch this week, with 0.01 inch at King AP. The monthly total so far is 1.33 inches at King AP, which is 61% of normal for January-to-date, but it ranks at the 46th percentile. Total rainfall since August 1 (which encompasses the wet season) is 15.52 inches, which ranks at the 18th percentile (D1). King AP SPI values were at D2 to D3 levels at 3 to 6 months, and D1 at longer time scales. This week the USGS Grade School 3 Well continued to decline. D2-SL continues for St. Thomas.
On St. Croix, weekly CoCoRaHS rainfall observations ranged from 0.15 inch to 0.51 inch, but were mostly a fourth of an inch or less. Rohlsen AP reported 0.06 inch, bringing the total for January to 2.21 inches which is 137% of the month-to-date normal and ranks at the 73rd percentile. The August-January total of 13.62 inches now comes in at the 4th percentile (D3), February 2021-January 2022 ranks at the 4th percentile, and the rolling 12-month period comes in at the 4th percentile; each of these three time periods is the 2nd driest in the 1973-2022 record, behind 1989-90 (for August-January) or 2015-16. Rohlsen AP SPI values are D3 at the 3-, 6-, and 12-month time scales. This week the USGS Adventure 20 Well continued its steady decline of the past several weeks and, in fact, has been in decline throughout the past year. It continued at record low levels for the September 2016-January 2022 period. D3-SL continues for the island.
Pacific
There were no changes in Alaska, which remained free of dryness and drought, although modest snowpack deficits existed in some river basins across the south-central portion of the state.
In Hawaii, a month-long spell with negligible rain across Maui and Hawaii Counties necessitated the broad introduction of abnormal dryness (D0-S). On the Big Island, Hilo’s month-to-date rainfall through January 25 totaled just 1.10 inch (18% of normal). However, January dryness in Hilo followed last month’s 24.99-inch rainfall, which represented the highest December total in that location since 2008. On Hawaii’s western islands, where heavy rain had continued into early January and streamflow conditions were generally more favorable, there was not yet evidence of abnormal dryness.
A circulation moved across the FSM and Palau, generating abundant showers for some islands; this moved through a near-equatorial trough with trade-wind convergence which also generated some rain in various parts of Micronesia; and a shear line/cold front brought rain to parts of the Marianas. A tropical disturbance interacting with the South Pacific Convergence Zone (SPCZ) brought abundant rain to American Samoa. Beyond these rain-producing features, the week was mostly dry. Satellite-based precipitation estimates (QPE) showed an area of 1+ inches of rain across eastern parts of the Federated States of Micronesia (FSM), a band of 2+ inches across central and south central FSM extending to Palau, an arm of 1+ inches touching the southern Marianas, and 4+ inches north and east of the Samoan Islands associated with the SPCZ with a thumb of 2+ inches stretching across American Samoa.
Palau IAP (Airai) reported 7.03 inches of rain this week, which is well above the weekly minimum of 2 inches needed to meet most water needs, and a monthly total of 9.76 inches. Koror COOP measured 6.00 inches for the week, with one day missing, and 9.54 inches for the month so far. With these wet conditions, D-Nothing continues for Palau.
This week, previous weeks, and the month have been wet (above the 1-inch weekly and 4-inch monthly minimums) in American Samoa. Pago Pago reported 2.94 inches of rain this week (with 9.06 inches for the month so far), and the automated stations at Siufaga Ridge and Toa Ridge recorded 2.72 (9.44) and 1.10 (4.46) inches, respectively. D-Nothing continues on Tutuila.
In the Marianas, Guam (with 2.80 inches of rain this week) and Rota (1.49) were wet (above the 1-inch weekly minimum), with monthly totals above the 4-inch monthly minimum (5.54 and 6.46 inches, respectively), so D-nothing continues for those islands. Saipan had 0.55 inch at the IAP, 0.28 inch at the NPS automated station, and 0.44 inch at the ASOS station. This week marks the third consecutive dry week at Saipan. The central part of Saipan has seen some decent showers the last several days, but Tinian and the southern part of Saipan have been dry, so D0-S was introduced at Saipan.
In the Federated States of Micronesia, the week was wet at Yap (3.75 inches), Pohnpei (3.80), Lukunor (2.40), and Ulithi (3.94). It was a dry week at Kosrae (0.60), Fananu (0.46), and Pingelap (0.14), although 3 days were missing this week at each of those stations. Weekly totals were below the 2-inch weekly minimum but above 1 inch at Chuuk (1.81), Kapingamarangi (1.11), Nukuoro (1.70), and Woleai (1.08). These dry values prompted the continuation of D0-S at Chuuk and Nukuoro, and D1 at Fananu and Kapingamarangi. On Fananu, drinking water is being drawn from the school water tank and the only decent rain was during the beginning of the month. At Woleai, rain gauge readings are 1.08 inches for the week and 1.71 inches so far this month, and this is the third consecutive dry week, so D0-S was introduced at Woleai. D-Nothing continued at the other stations since either this week was wet, or previous weeks were wet, and/or the month so far has been wet.
In the Marshall Islands, Majuro recorded 2.46 inches of rain this week (with one day missing), which is above the 2-inch weekly minimum. The reservoir level improved with this week’s rain, increasing to 22.6 million gallons as of January 24, but that is still well below the 28.8 million gallon threshold of concern for drought. With the monthly total 4.17 inches, which is still below the monthly min, and reservoir levels so low, D0-S continued for Majuro. The rest of the RMI stations were dry, with weekly amounts ranging from zero at Wotje, 0.12 inch at Mili, and 0.15 inch at Ailinglaplap, to 0.46 inch at Jaluit and 0.69 inch at Kwajalein. D-Nothing continued at Jaluit since last week was wet, D0-S continued at Ailinglaplap and Mili, and D1-S continued at Kwajalein. Wotje has received no rain in January so far, and no rain since December 4. One other January has had zero precipitation, giving January 2022 (to date) a rank of 2nd driest (ties for driest), or a percentile of 0.05 which is D3 level. The rain in early December gave December-January a percentile of 0.11 (D1), November-January has a percentile of 0.31 (barely D-Nothing), and October-January a percentile of 0.25 (D0). But reports have been received by the NWS that vegetation is browning and drying up, and residential water catchments are empty with residents obtaining water from the local church and school. The USDM status at Wotje was worsened to D3-S to reflect the lack of rain, record dry January, and extreme impacts.
Looking Ahead
During the next 5 days, the only major storm system to affect the country will develop near the southern Atlantic Coast and move northward. The potential exists for significant accumulations of wind-driven snow, starting Friday night and continuing into the weekend, from the middle Atlantic Coast into New England. Most of the remainder of the country will receive little or no precipitation, although exceptions during the next couple of days will include rain from southern Texas to Florida’s peninsula and snow squalls downwind of the Great Lakes. In addition, precipitation should begin to overspread the Northwest during the weekend. Elsewhere, frigid conditions will linger during the next several days from the Midwest into the Northeast, while areas as far south as Florida’s peninsula may experience sub-freezing temperatures as January draws to a close. The NWS 6- to 10-day outlook for February 1 – 5 calls for the likelihood of above-normal temperatures in the eastern U.S., while colder-than-normal conditions will prevail along and west of a line from central Texas to Lake Michigan. Meanwhile, below-normal precipitation in the Far West, including northern and central California and the Great Basin, should contrast with wetter-than-normal weather in most areas from the central and southern Rockies to the Atlantic Coast.
Author(s):
Brad Rippey, U.S. Department of Agriculture
Richard Heim, NOAA/NCEI
Dryness Categories
D0 Abnormally Dry—used for areas showing dryness but not yet in drought, or for areas recovering from drought.
Drought Intensity Categories
D1 Moderate Drought
D2 Severe Drought
D3 Extreme Drought
D4 Exceptional Drought
Drought or Dryness Types
S Short-term, typically less than 6 months (agriculture, grasslands)
L Long-term, typically more than 6 months (hydrology, ecology)
SL Area contains both short- and long-term impacts
Source: National Drought Mitigation Center
