


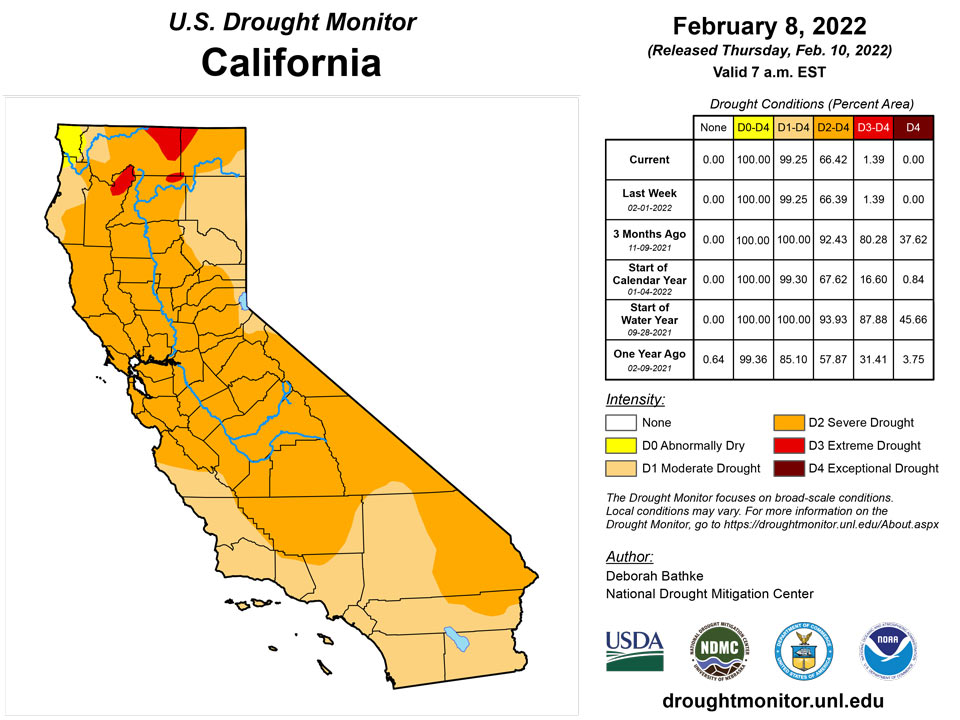
California and National Drought Summary for February 8, 2022
Summary
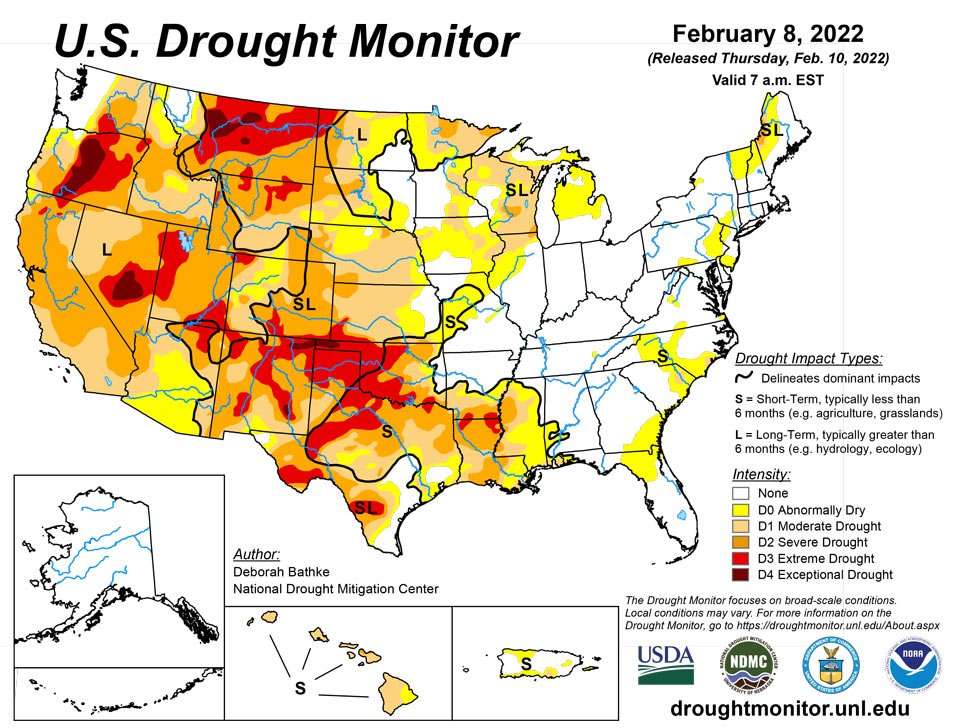
February 10, 2022 - A powerful winter storm last week, stretching from New Mexico to Maine, helped improve drought conditions in 17 states in its path. Meanwhile, another week of dry weather in the West put a halt to drought recovery. Parts of Montana, Wyoming, Utah, and Oregon saw drought expand as the recent dryness on top of long-term drought chipped away at snowpack and lowered streamflow. A wet December left most other parts at near normal for the season, but concerns are growing as dry weather remains in the forecast.
Northeast
Last week’s powerful winter storm dumped heavy snow across parts of the Northeast with the heaviest amounts mostly falling in drought-free areas. New York was the only state in the region to see changes to the map this week. Abnormal dryness (D0) was reduced in the southeast part of the state. Conversely, D0 expanded in the north where 3-month precipitation deficits are 2 to 3.5 inches below normal. While the storm improved precipitation shortfalls in the remaining drought areas, seasonal deficits are still present.
Southeast
Many areas in the Southeast benefited from soaking rains brought by last week’s winter storm system with totals generally ranging from 1 to more than 4 inches or 150% to 300% of normal for the week. Cool temperatures kept evaporative demand low, and streamflow and soil moisture returned to near normal conditions. As a result, this week’s map shows broad areas of 1-cateogry improvements extending from Virginia to northeast Georgia and along the Southern Coastal Plain. A few areas didn’t fare as well. Abnormal dryness (D0) expanded in southeast Georgia and northern Florida. Here, precipitation shortfalls are approaching 4 inches over the last 30 days (50% to 75% of normal).
South
Much needed rain brought by last week’s winter storm improved drought conditions in parts of all six states in the region. Precipitation totals of around 1 to 4 inches – more than 300% of normal in some areas – fell across much of the region helping to reduce short-term rainfall deficits and improve streamflow and soil moisture conditions. Texas saw a wide band of 1-category, with isolated 2-category, improvements. In parts of South and West Texas, the excess moisture was enough to chip away at the long-term drought. Other areas seeing improvements include eastern Kansas, eastern Oklahoma, southeastern Louisiana, and southern Mississippi. Widespread drought remains in the region. Despite last week’s weather, parts of Texas and Louisiana saw expansions of drought. These areas missed out on the heaviest rain, increasing moisture deficits. In South Texas rainfall deficits are approaching 5 to 6 inches (less than 50% of normal) over the last 3 months. In southwest Louisiana, they are about 7 to 10 inches (less than 50 % of normal) over the same time frame, reducing streamflow and drying soils.
Midwest
Dry weather occurred across most of the Upper Midwest adding to existing precipitation deficits and drying soils. Moderate drought (D1) and/or abnormal dryness (D0) expanded across parts of Iowa, northern Indiana, eastern Wisconsin, and Michigan. Located along the outer edges of last week’s heavy rain band, southern Missouri and southern Michigan saw improvements to D0.
High Plains
Last week’s snow brought widespread improvements to eastern Colorado including areas of severe (D3) and extreme drought (D3). The recent event, combined with above average January snowfall, has left a large swath of snow on the ground and improved soil moisture conditions. The remainder of the region saw another week of dry weather. Wyoming saw an expansion of D2 and D3 in the north and west parts of the state as recent warm, dry weather, chipped away at seasonal snowpack. Nebraska and Kansas saw a broad expansion of moderate drought (D1) and abnormal dryness (D0). Here, 30-to-90-day precipitation totals rank in the top 5 driest on record. Fires on the rise in these areas and burn bans are going to effect.
West
Weather across the West was once again dry this week. Western Oregon saw expansions to moderate (D1) and severe (D2) drought increased. Another week of dry weather increased water-year-to-date precipitation shortfalls and lowered streamflow values. The far northern Oregon Cascades saw improvement. Snowpack here is near normal for the water year. Extreme drought (D3) was expanded in Utah as increasing precipitation deficits have dried out soils and lowered streamflow. The rest of the West remains unchanged. Several weeks of dry weather has caused high elevation snowpack in parts of the west to drift away from the above-normal values at the start of the new year.
Caribbean
One week after degrading conditions in Puerto Rico, the island was inundated with rainfall. The eastern half of the island received 6 to 15 inches of rainfall resulting in the removal of almost all drought and abnormal dryness. The rest of the island received 2 to 5 inches, enough to result in broad improvements. Moderate drought (D1) remains along parts of the south coast where streamflow and well levels are low.
Unseasonably heavy rainfall was reported across the Virgin Islands, bringing some relief from the intensely dry conditions observed since mid-August 2021. Over 3 inches fell on Windswept Beach, St. John – more than the prior 2 months combined, and more than the February monthly normal. On St. Croix, the first 8 days of February brought 3.9 inches of rain, compared to a normal of less than one-half inch for the period. Almost 1.7 inches fell on February 5, topping the old daily record from 66 years earlier by over 50 percent. These early February rains were also more than the December – January totals, and brought the December 1, 2021 – February 8, 2022 total to 7.31 inches, which is 1.67 inches more than normal. But despite more than eliminating the deficits accumulated over the prior 2 full months, totals since mid-August remain well below normal. Both locations were improved by one classification and short-term surface dryness was eliminated for the time being, leaving D1(l) on St. John and D2(l) on St. Croix. Heavy rains were also reported on St. Thomas, but amounts did not alter the moisture budget as dramatically as on St. John and St. Croix. King Airport on St. Thomas recorded 1.27 inches of rain on February 7 – more than 3 times the old daily record of 0.46 inch in 2017. The first 8 days of February brought 2.22 inches of rain, which is more than the 1.79 inches normal for the entire month. But on St. Thomas, totals since December 1 remain somewhat below normal, so extreme drought remained, but short-term surface moisture shortages were quelled for the time being (D3(sl) became D3(l)). Local reports indicate many home cisterns and water catchments remain low. Some residents have needed to purchase water from elsewhere. Farmers continued to buy up hay, put up irrigation tubes, and extensively mulch the ground to preserve the water is still in the ground. Poultry producers on all three islands are buying water.
Pacific
Alaska remained free of drought or abnormal dryness this week.
In Hawaii, trade wind rainfall finally returned but only the east-facing slopes of the Big Island received enough to improve drought conditions. The rest of the state received much less, increasing moisture deficits, and lowering streamflow. Severe drought (D2) was added to parts of Maui and moderate drought (D1) was added to Kauai and Oahu.
While the protracted drought affecting Kapingamarangi and the southern reaches of Micronesia continued to ease, short-term drought persisted or intensified across the northern and western Marshall Islands. Meanwhile, heavy rains ended abnormal dryness at Majuro in the southeastern Marshall Islands, but D0s continued in nearby Mili, as well as across central Micronesia and the northern Marianas.
Koror in Palau received 3.16 inches of rain this month (through February 8), bringing the year-to-date total up to 14.65 inches, slightly more than an inch above normal. Three of the last seven months brought only 55 to 75 percent of normal rain, but three others featured 145 to 229 percent of normal. And given the wet climatology, no impactful precipitation deficits are affecting the country.
Saipan in the Marianas recorded only about one-third of an inch of rain in early February, and for the year-to-date through February 8, only 2.73 inches fell, compared to a normal around 4.4 inches. Although November and December brought above-normal precipitation, the 7.3 and 5.9 inches were below the amount that can potentially stress water needs. Earlier – during the wet season – enough rain fell to meet immediate needs, but August – October totals were several inches below normal. As a result, abnormal dryness (D0) remained in place this week. Farther south, rainfall in Rota and Guam has been unremarkable, and no dryness impacts have been reported. The Guam International Airport total of 10.9 inches of rain for Dec. 1, 2021 – Feb. 8, 2022 was about an inch below normal.
In Micronesia, the protracted drought entrenched in Kapingamarangi and other southern reaches of the Islands continued to loosen its grip. The 7.92 inches recorded in January 2022 pushed the 2-month total to 22.5 inches – somewhat above the normal of 19 inches. The prior 4 months brought only 13.4 inches of rain, about 36 percent of normal. The last two months have not eliminated the longer-term rainfall deficits nor their impacts, but conditions have improved considerably. Last week, Kapingamarangi recorded another 3.47 inches of rain, and year-to-date totals are close to normal. Farther north, conditions are essentially unchanged from last week. Moderate drought (D1) remains on Fananu, and abnormal dryness (D0) persists on Woleai, Chuuk Lagoon, and Nukuoro – all for short-term deficits and impacts. Ulithi, Lukunor, Pohnpei, Pingelap, and Kosrae remained free of impacts from deficient rainfall. Fananu reports a variety of impacts from deficient rainfall. There are 2 water tanks the island is using for drinking and cooking - all private tanks are empty. A deep well burnishing brackish water is being used for showering, etc. In late January, about half of their crops were reported stressed for lack of water, and taro patches were drying up, although there is enough stored to meet immediate needs. At Chuuk Lagoon, only 4.18 inches of rain has fallen this year through Feb. 8, compared to a normal of 11.3 inches. Similarly, 2.88 inches fell on Woleai in January – only 38 percent of normal and not enough for water supply to keep pace with demand. The short-term abnormal dryness at Nukuoro continued. There, the October-January total of 36.5 inches was about 10 inches less than normal, and water demand out-paced water supplies for 2 of the last 4 months. At Pohnpei and Lukunor, the first 5 weeks of 2022 brought 11.9 to 14.0 inches of rain – slightly below normal but sufficient to meet water demand.
In the Republic of the Marshall Islands, heavy rain abruptly ended short-term abnormal dryness at Majuro, but marked drought conditions persisted over northern and western parts of the Republic, and less-impactful dryness was affecting southeastern areas around Mili. Majuro recorded 13.94 inches of rain for December 2021 – January 2022, compared to a normal approaching 20 inches; however, the first 8 days of February already brought more rain (7.59 inches) than is normal for the month, and totals since December are now close to normal. Meanwhile, southwestern areas (Jaluit and surrounds) remain free of impactful dryness. No rainfall was reported on Wotje in January 2022, and just 2.55 inches fell during December. The 2-month total was only 35 percent of normal, and not enough for water supply to keep pace with demand. Little or no precipitation has fallen during the first 8 days of February, keeping extreme drought (D3) in place. Half of the past 14 months brought 75 percent or less of normal precipitation, and only one of those months (November 2021) brought more than the 8 inches that ensures water supply keeps pace with demand. Rainfall totaled 53.21 inches for December 2020 – January 2022, which is more than one foot less than normal. Data for nearby Utirik is lacking, but local reports indicate conditions similar to Wotje and consistent with a D3 designation. To the west, drought is not as extreme, but conditions remain far from normal. Kwajalein and Ailinglapalap remain designated D2s and D1s, respectively. Only 1.25 inches of rain fell on Kwajalein in January 2022, bringing the 2-month December - January total to only 4.99 inches, which is 41 percent of normal and not enough for water supplies to keep pace with demand. Rainfall ticked upward during the first 8 days of February (2.17 inches of rain, which is slightly above normal), but this did not significantly change conditions. The wetter time of year (September – November) had near normal rainfall, but the prior 3 summer months had significantly less than normal rain. So despite the wet autumn months, rainfall since June 2021 totaled 57.82 inches – more than 16 inches less than normal. Ailinglapalap recorded 3.2 inches of rain in January 2022 – about half of normal and significantly less than what is needed for supply to keep pace with demand. The prior 4 months were sufficiently wet there, but May – August each brought less rainfall than needed. Meanwhile, marginal abnormal dryness (D0) remained in place in Mili. In parts of the Marshalls, many catchments are very low or empty. Some wells are salty but well water levels are still decent. Catchment water is being used for drinking only on many islands, with some using coconuts for hydration. Plants are yellow to brown with some plants absent of leaves. Some fruits are dropping prematurely. Some islands have reverse osmosis units but many are inoperable. Many islands have 2-4 weeks of water left if no rain falls.
In American Samoa, generally 4 to 6 inches of rain fell this past week. Pago Pago has year-to-date rainfall through February 8, 2022 slightly above their normal of 17.65 inches, keeping impactful dryness at bay. Rainfall has increased since a dry September – October began to raise concerns.
Looking Ahead
The National Weather Service Weather Prediction Center forecast (valid February 10 – 15) calls for relatively dry weather over much of the Lower 48. A pair of storms systems are expected to bring snow to the Upper Midwest and Northeast. Much of the continental U.S. will see above normal temperatures through the weekend. Moving into next week, the Climate Prediction Center (Valid February 15 – 19) Outlooks favor above normal precipitation from the Desert Southwest northeast to the Canadian border. Drier weather is favored for the northern Plains and much of the west. Temperatures are expected to be warmer than normal in the West Coast states, the central and northern Great Plains, and across much of the Lower Midwest and Southeast.
Author(s):
Deborah Bathke, National Drought Mitigation Center
Richard Tinker, NOAA/NWS/NCEP/CPC
Dryness Categories
D0 Abnormally Dry—used for areas showing dryness but not yet in drought, or for areas recovering from drought.
Drought Intensity Categories
D1 Moderate Drought
D2 Severe Drought
D3 Extreme Drought
D4 Exceptional Drought
Drought or Dryness Types
S Short-term, typically less than 6 months (agriculture, grasslands)
L Long-term, typically more than 6 months (hydrology, ecology)
SL Area contains both short- and long-term impacts
Source: National Drought Mitigation Center
