


California and National Drought Summary for February 15, 2022
Summary
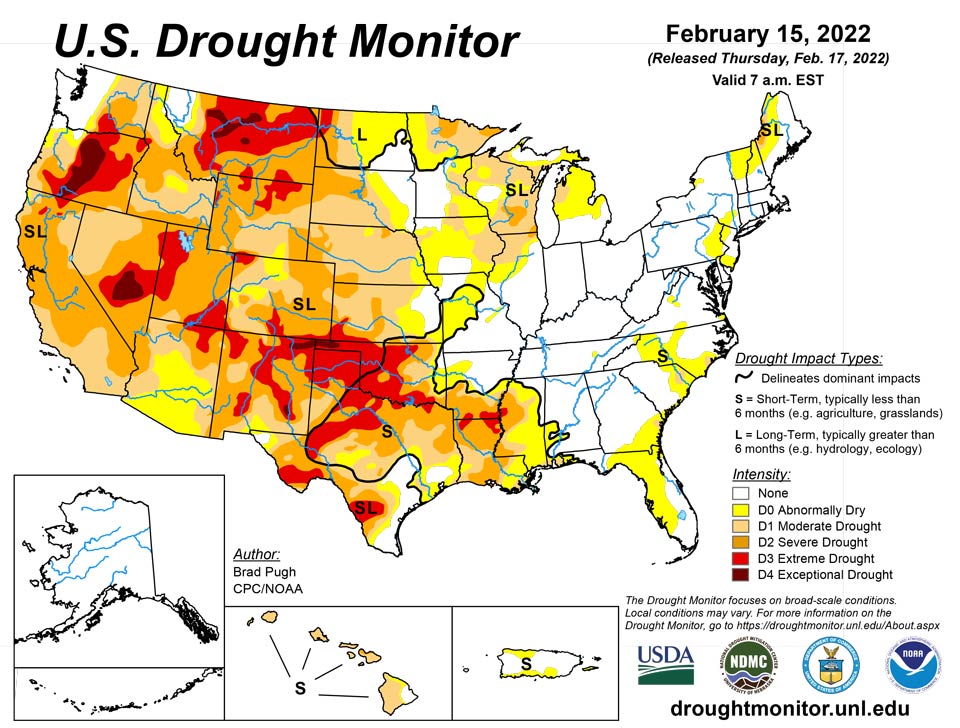
February 17, 2022 - A broad area of surface high pressure resulted in little to no precipitation throughout the contiguous U.S. from February 8 to 14. During this 7-day period, the most significant precipitation (more than 0.5 inch, liquid equivalent) was limited to the Cascades, Upper Mississippi Valley, northern New England, and the Florida Peninsula. Following a wet December with beneficial snowfall, a persistent area of mid-level high pressure anchored near the West Coast led to drier-than-normal conditions across the western U.S. since early January. During the second week of February, above-normal temperatures prevailed throughout the West and much of the Great Plains. Drier weather returned to Puerto Rico by mid-February, while enhanced trade wind showers resumed across the eastern side of Hawaii’s Big Island.
Northeast
Although only light precipitation occurred this past week across southern Pennsylvania, near normal precipitation during January supported a removal of abnormal dryness (D0) for this region. Despite recent periods of wetness including snowfall, there are indicators such as soil moisture and SPI that support maintaining D0 across the Delmarva. In addition, 90-day precipitation deficits continue for this region.
Southeast
Increasing 30 to 90-day precipitation deficits and consistent with 90-day SPI, abnormal dryness (D0) was expanded slightly west across southwest Georgia and south to include the Big Bend of Florida. The 90-day SPI supported the addition of D1 to the south of Savannah where 90-day precipitation deficits exceed 4 inches. Despite light rainfall (0.5 to 1 inch) across the Florida Peninsula from Feb 8 to 14, 90-day precipitation deficits of more than 4 inches, declining soil moisture, and 28-day average streamflows below the 30th percentile resulted in an expansion of abnormal dryness (D0) across much of the Florida Peninsula. According to the USDA’s National Agricultural Statistics Service, 24 percent of the topsoil statewide across Florida is being reported as very short to short. The dryness is causing a more frequent use of irrigation for citrus.
South
Based on 90-day SPI values and soil moisture indicators, a 1-category degradation was made to parts of Arkansas and adjacent northwest Mississippi. Impacts related to these worsening drought conditions include dry ponds and continued high fire danger. The previous week’s D2 areas in southwest Mississippi and adjacent Louisiana were merged and slightly expanded eastward, consistent with SPoRT soil moisture percentiles, 28-day average streamflows, and 90-day SPI values. Precipitation deficits of more than 8 inches are observed during the past 90 days across a broad area of the Lower Mississippi Valley. Statewide precipitation across Mississippi during November-December-January was the driest since 1985/86. On February 15, a statewide burn ban was issued for Louisiana. An expansion of extreme drought (D3) was made across north-central Oklahoma, based on 90-day SPI and worsening soil moisture indicators. Persistent dryness along with periods of above normal temperatures and enhanced winds this winter prompted an expansion of severe to extreme drought (D2 to D3 ) across the middle Rio Grande Valley. Despite a dry week, a reassessment of SPI values at various time scales and soil moisture indicators supported a 1-category improvement from moderate drought (D1) to abnormal dryness (D0) across the southern Edwards Plateau. According to the USDA’s National Agricultural Statistics Service, 77 percent of the topsoil moisture was rated as poor to very poor across Texas as of February 13. Nearly two-thirds of oats, winter wheat, and rangeland and pastures were rated in poor to very poor condition.
Midwest
Increasing 90-day precipitation deficits and consistent with worsening 90 to 120-day SPI values supported an expansion of moderate drought (D1) across eastern Iowa and adjacent areas of northern Illinois and southwest Wisconsin. An increase in the coverage of severe drought (D2) was necessary across southern Wisconsin based on 90 to 120-day SPIs. To be consistent with SPIs at various time scales throughout the Great Lakes, D1 was added to parts of southwest Lower Michigan.
High Plains
Moderate drought (D1) was degraded to severe drought (D2) across central Kansas and merged with ongoing D2 in southwest Kansas, based on 120-day SPI and soil moisture indicators. Since a 1-category degradation was made the previous week across northern Kansas and eastern Nebraska, these areas remained status quo this week given the time of year when worsening conditions are slower to be realized in terms of impacts. Farther to the north, recent dryness with a lack of snow cover and above normal temperatures resulted in an increase of abnormal dryness (D0) and moderate drought (D1) across northern Nebraska and South Dakota. The updated depiction across the northern to central Great Plains follows closely the 30 to 90-day SPI and soil moisture indicators. Also, the SPI dating back 24 months was also weighed. Drought impacts for South Dakota include many days of high fire danger which is unusual during the winter, low stock ponds, and adverse conditions for recreational snowmobiling. Farther to the north across northern and eastern North Dakota, SPIs at various time scales supported a 1-category improvement. Recent snowfall (6 to 12 inches) and 6-month SPIs prompted a 1-category improvement to the Denver/Boulder metro areas, while 1-category degradations were made to parts of western and southern Colorado based on longer-term SPIs and current snowpack.
West
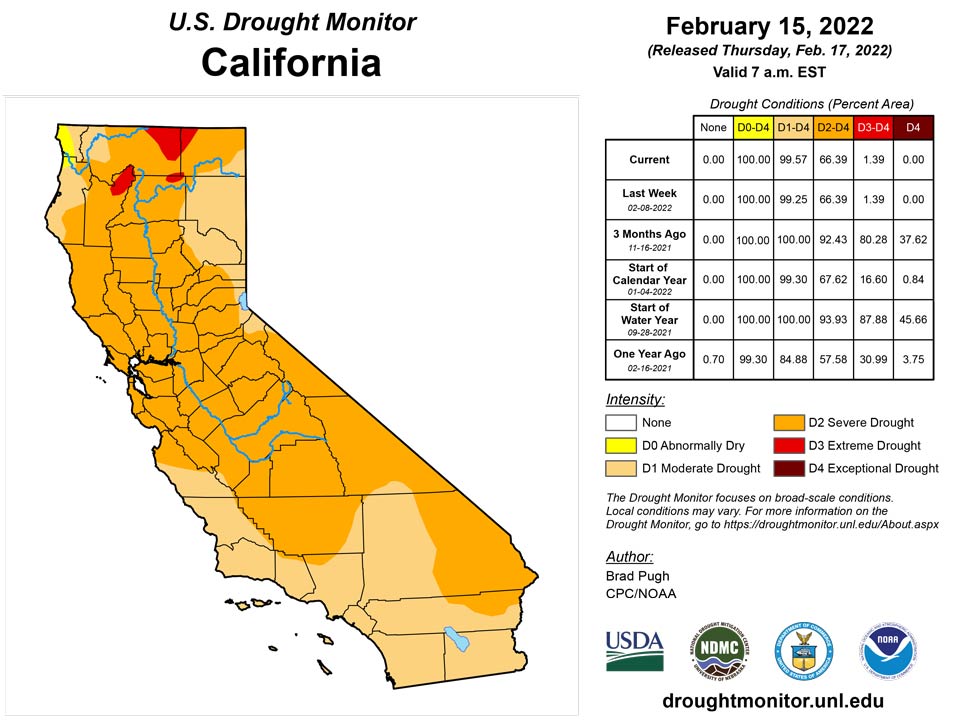
An expansion of extreme (D3) drought was made to parts of south-central Montana, based on SPI and EDDI at various time scales and soil moisture indicators. Although only light precipitation (less than 0.25 inch liquid equivalent) was observed in northeast Montana, a small area was improved from D3 to D2 due to a reassessment of indicators such as SPI values. Continued improvement of long-term SPI supported a slight reduction of D4 in northwest Montana. Severe (D2) drought was increased slightly in coverage across southwest Utah, as a result of low streamflows (below the 10th percentile) and 30-day SPI. 12-month SPEI along with worsening soil moisture indicators and 28-day average streamflows supported a 1-category degradation across parts of Oregon and adjacent areas of northwest California. The lack of precipitation since early January resulted in 28-day average streamflows falling below the 10th percentile throughout much of western Oregon. Following the persistent dryness since early January and above normal temperatures from early to mid-February, California’s statewide snowpack decreased to 73 percent of normal on Feb 14. If the dry pattern persists through the remainder of February, degradations in the current drought levels may be necessary for the remainder of California.
Caribbean
Heavy to excessive rainfall earlier in this month resulted in additional improvements across Puerto Rico.
A dry high pressure ridge dominated the weather over the U.S. Virgin Islands (USVI) during this USDM week. Patches of moisture embedded in the trade wind flow generated fast-moving localized showers. Satellite- and radar-based QPE maps indicated only a few tenths of an inch of rain fell across the USVI, with the higher amounts over western portions of the region. Groundwater levels at the USGS wells on the 3 islands continued to decline this week after the uptick they experienced due to last week’s rains.
About half an inch (0.49) of rain fell this week on St. Thomas at King AP and the CoCoRaHS station at Charlotte Amalie 1.4 NE, which is about normal for the week. The month-to-date total of 2.71 inches at King AP is 263% of normal. The rainfall total for August 25, 2021-February 15 is 13.89 inches, which is second driest for the period, and SPI values were in the D0 (3 months) to D2 (6 months) range. D3-L continues for St. Thomas.
On St. Croix, weekly rainfall totals at the CoCoRaHS stations ranged from 0.29 inch to 0.51 inch, with 0.15 inch of rain recorded at Rohlsen AP. The weekly total at Rohlsen AP was below normal, but the monthly total of 4.05 inches was 555% of normal. The rainfall total for August 25-February 15 is 14.62 inches, which is 9th driest for the period. East Hill recorded 0.28 inch for the week (below normal) and 3.04 inches for the month (428% of normal). Monthly totals for February to date at the CoCoRaHS stations ranged from 2.52 inches to 6.15 inches. SPI values for the 6- to 12-month time scales ranged from D0 to D1 at Rohlsen AP and East Hill. The USGS Adventure 28 Well shows groundwater at St. Croix has steadily declined over the past week and continues at near-record low levels. D2-L continues for St. Croix.
Pacific
Rainfall recently returned to the northeast and east facing slopes of the Big Island of Hawaii which resulted in a 1-category improvement to the east side of the Big Island. Precipitation has averaged near normal for the month-to-date at Hilo. Due to continued low streamflows, moderate drought (D1) was degraded to severe drought (D2) along the eastern side of Molokai.
Trade-wind convergence, a near-equatorial trough, and a weak Inter-Tropical Convergence Zone (ITCZ) generated showers across the length of Micronesia during this USDM week. Satellite-based QPE maps indicated a band of 1-inch precipitation, with embedded areas up to 4 or more inches, extending across Micronesia mostly within a few degrees north and south of 5 degrees North latitude, with little to no rainfall indicated north of this band. South of the equator, a surface to mid-level trough and nearby mid-level low pressure system brought rain to the Samoan Islands.
In the Republic of Palau, about 2 inches of rain fell this week at Airai (2.22 inches) and Koror (1.72 inches), with over 4 inches so far this month (4.68 and 5.04, respectively), which is above the minimum rainfall (at this point in the month) needed to meet most water needs. In American Samoa, over 2 inches of rain was measured at Pago Pago (2.62) and the automated stations at Siufaga Ridge (2.73) and Toa Ridge (3.30), with over 6 inches recorded so far this month. There is no drought or abnormal dryness (D-Nothing) in Palau or American Samoa.
This week was another dry (less than the 1-inch weekly minimum needed to meet most water needs) week in the Marianas. No rain was recorded on Saipan at the International AP or NPS stations, 0.01 inch was observed at Tinian, 0.29 inch at Guam, and 0.53 inch at Rota. Dededo had the greatest weekly total with 0.60 inch (with 5 days missing). Monthly totals so far in February were mostly below an inch and included 0.36 inch at Saipan IAP, 0.63 inch at Guam, and 0.75 inch at Rota. Vegetation was beginning to dry out on Guam. Abnormal dryness (D0-S) continued at Saipan and, with this week marking the third consecutive dry week, began at Guam and Rota.
In the Federated States of Micronesia (FSM), the week was wet at Pohnpei, where 5.78 inches of rain was reported (with one day missing), Kosrae (2.44), and North Fanif (2.93). It was dry (less than the 2-inch weekly minimum) at the rest of the monitored stations, with weekly rainfall totals ranging from 0.23 inch at Woleai to 1.62 inches at Yap. With this week or previous weeks wet, and/or February-to-date wet, D-Nothing continued at Pohnpei, Kosrae, Lukunor, Pingelap, and Ulithi. D-Nothing also continued at Yap. But the last 2 or 3 weeks have been dry, and February month-to-date totals are dry, at Yap, Lukunor, and Ulithi, so D0-S may be considered soon for these locations if dry conditions continue.
Moderate drought (D1-S) began at Chuuk due to persistent low precipitation and worsening impacts. Only 0.77 inch of rain fell this week and the February total so far is only 1.06 inches, which is the third driest February compared to full monthly totals for the month. Only 4.99 inches has fallen since January 1, giving January-February 2022 a rank of fourth driest out of 71 years of data. Reports of drying vegetation have been received from Chuuk Lagoon.
Fananu received some rain this week (0.48 inch for the week and February so far), but amounts were still well below the minimum needed to meet most water needs. Based on impacts that include vegetation and crops withering and water resources running dry, and continued low rainfall totals, the status at Fananu was worsened to severe drought (D2-S).
Abnormal dryness transitioned to moderate drought (D1-S) at Woleai as this week marked the sixth consecutive dry week. The weekly total (0.23 inch) and month-to-date total (1.06) were well below the minimums needed to meet most water needs. Based on data so far in the month, February 2022 ranks as the second driest February in 38 years of data, and January-February 2022 ranks as the fourth driest. Residents on the island are conserving water.
With this week below the weekly minimum rainfall at Kapingamarangi (1.21 inches) and Nukuoro (1.01), abnormal dryness continued. Recent reports indicate that water levels are good on Kapingamarangi and vegetation, as a whole, is starting to become verdant, so D0-L, where the L reflects lingering vegetation impacts, is appropriate.
In the Marshall Islands, Kwajalein was wet with 3.91 inches of rain recorded this week, but the rest of the stations were dry. Weekly rainfall reports ranged from zero inches at Wotje to 1.24 inches at Ailinglaplap. D-Nothing continued at Majuro, where the monthly rainfall so far totaled 8.16 inches (above the monthly min) and the reservoir level (as of February 13) remained fairly steady for the last week at just below the level for concern. This week was dry at Ailinglaplap (1.24 inches) and Mili (0.46 inch), so D1-S and D0-S, respectively, continued. Jaluit was dry this week (1.08 inches); with the month having only 3.87 inches so far, D0-S was introduced at Jaluit. An analysis could not be made at Utirik due to missing data for the last several months.
At Kwajalein, with a wet week this week and last week, the monthly total for February so far is 6.08 inches, which ranks 12th wettest out of 70 years of data. January-February 2022 ranks 30th wettest, and December 2021-February 2022 ranks 18th driest. With the wet conditions and improving precipitation ranks, Kwajalein was improved to D1-S.
No rain has fallen at Wotje since early December, and monthly rainfall totals have been below the 8-inch monthly minimum needed to meet most water needs for 13 of the last 14 months. There were three other Februaries that had no rain, but January-February 2022 ranks as the driest January-February in 39 years of data, and December 2021-February 2022 ranks second driest. Vegetation is withering but reverse osmosis (RO) units have been deployed and are providing some water for residents. The USDM status at Wotje was changed to D3-SL, where the L was added to reflect the longer-term dryness.
Looking Ahead
On February 17, a low pressure system is forecast to develop with a subsequent track northeastward to the Ohio Valley and Northeast. A swath of snowfall, potentially more than 6 inches, is expected to the northwest of surface low track from the central Great Plains to the Midwest. In the warm sector of this storm system, thunderstorms with locally heavy rainfall (more than 1 inch) are forecast from the Ohio River south to the Lower Mississippi Valley. Mostly dry weather is likely across the Coastal Plain of the Southeast and Florida from Feb 17 to 21. As mid-level low pressure develops over the West on Feb 20 and 21, snow is anticipated to overspread the Cascades, Sierra Nevada Mountains, Great Basin, and Rockies.
The Climate Prediction Center’s 6-10 day outlook (valid Feb 22-26, 2022) depicts a major pattern change over the West and north-central U.S. from earlier in the month. Large probabilities (more than 70 percent) of below normal temperatures are forecast throughout the West and much of the Great Plains. Conversely, large probabilities (more than 70 percent) of above normal temperatures are forecast across the Mid-Atlantic and Southeast. Below-normal precipitation is favored for the Pacific Northwest, Great Basin, California, and Florida. A storm track, consistent with La Nina, elevates probabilities for above normal precipitation across the Ohio and Tennessee Valleys.
Author(s):
Brad Pugh, NOAA/CPC
Richard Heim, NOAA/NCEI
Dryness Categories
D0 Abnormally Dry—used for areas showing dryness but not yet in drought, or for areas recovering from drought.
Drought Intensity Categories
D1 Moderate Drought
D2 Severe Drought
D3 Extreme Drought
D4 Exceptional Drought
Drought or Dryness Types
S Short-term, typically less than 6 months (agriculture, grasslands)
L Long-term, typically more than 6 months (hydrology, ecology)
SL Area contains both short- and long-term impacts
Source: National Drought Mitigation Center
