


California and National Drought Summary for February 22, 2022
Summary
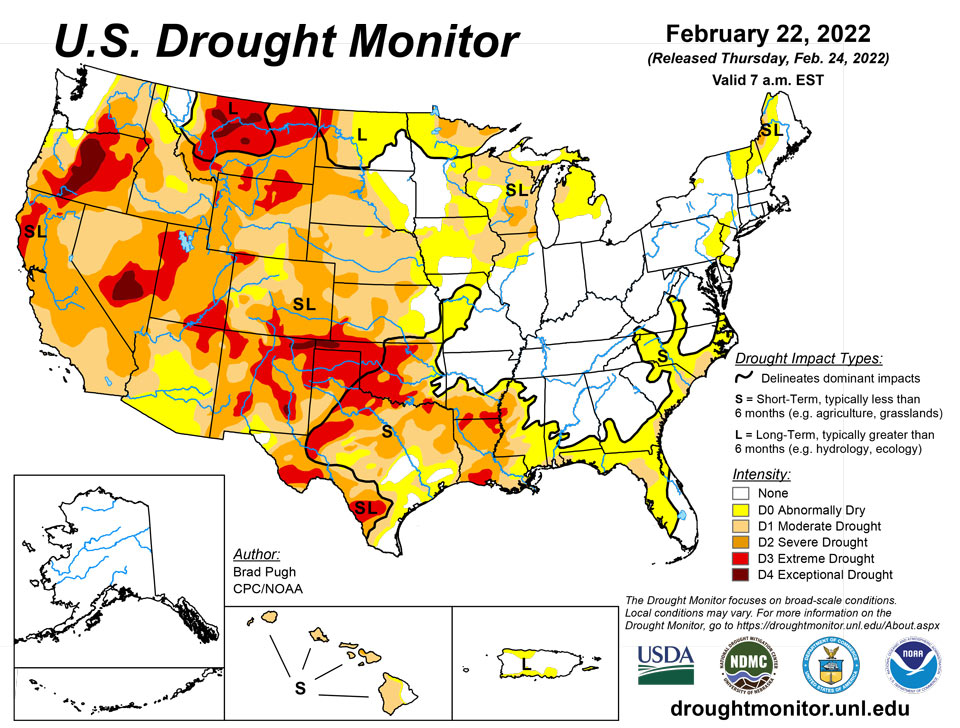
February 24, 2022 - A low pressure system developed across the southern Great Plains by February 17 and rapidly tracked northeastward to the Ohio Valley and Northeast a day later. To the northwest of the surface low track, snowfall amounts exceeded 6 inches across northeast Kansas, northern Missouri, and north-central Illinois. In the warm sector of this storm system, severe thunderstorms with locally heavy rainfall (more than 1 inch) affected the Tennessee Valley and parts of the Lower Mississippi Valley. Another low pressure system developed by February 21 with a similar northeastward track to the Ohio Valley. 7-day precipitation amounts, from February 15 to 21, exceeded two inches across much of the Ohio and Tennessee Valleys, Ozarks region, southeast Oklahoma, and parts of northern Texas. Farther to the south and west, little to no rainfall occurred closer to the Gulf Coast along with the Rio Grande Valley and central to southern high Plains. This precipitation pattern during mid-February and the primary storm track across the Ohio Valley are typical during La Nina. Although there was accumulating snow across the northern to central Rockies and northern Cascades this past week, the drier-than-normal pattern persisted throughout most of the West. 7-day temperatures, for the week ending on February 22, averaged above normal across the East, lower Mississippi Valley, and western Gulf Coast. Meanwhile, intrusions of Arctic air began to shift south from Canada into the northern Great Plains and upper Mississippi Valley where weekly temperatures averaged as much as 10 degrees F below normal. Periods of rainfall continued to occur along the windward sides of the Hawaiian Islands.
Northeast
Despite near to above average precipitation across northern New England since February 1, there are precipitation deficits dating back 180 days for that area. The abnormal dryness (D0) areas in southeastern New York, eastern Pennsylvania, and southern New Jersey mostly received less than 0.5 inch of precipitation from Feb 15 to 21 with the lowest 28-day average streamflows currently across southern New Jersey.
Southeast
Increasing 30 to 60-day precipitation deficits and consistent with 60-day SPI, abnormal dryness (D0) was expanded across southeast Alabama, southwest Georgia, the Florida Panhandle, and the Florida Peninsula. Keetch-Byram Drought Index values are nearing 600 for parts of the Florida Peninsula, indicative of drying fuels. Based on 60-day SPI and soil moisture indicators, short-term moderate drought (D1) was increased slightly east across the western Florida Panhandle and introduced to the Nature Coast of Florida and parts of the north-central Peninsula. The D1 coverage generally coincides where 60-day precipitation deficits exceed 4 inches. The eastern Carolinas and coastal Georgia continue to dry out with some areas receiving only an inch of precipitation during the past 30 days. Based on this recent dryness, abnormal dryness (D0) was increased in coverage across the Carolinas and southern Georgia. The Saint Simons Island Airport has observed only 3.98" of precipitation during the past 90 days. This is the 6th driest such period in 80 years of data. Short-term SPIs and soil moisture indicators supported an expansion of moderate drought (D1) across the Pee Dee region of the eastern Carolinas, Low Country of South Carolina, and coastal Georgia. Recent dryness along with declining streamflows resulted in an increase in D0 in southwest and central Virginia.
South
A sharp gradient in precipitation was observed from north to south across this region which is typical for La Nina during mid-February. 7-day precipitation amounts, from Feb 15 to 21, exceeded 2 inches across most of the northern half of Mississippi, northern two-thirds of Arkansas, southeastern Oklahoma, and northwestern Texas. A 1-category improvement was made to these areas that received the heavier rainfall. Conversely, farther to the south, a 1-category degradation was made to parts of the lower Mississippi Valley, western Gulf Coast, and central to southern Texas where little to no rainfall occurred this past week. Extreme drought (D3) was added to parts of southwestern Louisiana based on 30 to 90-day SPIs and soil moisture indicators. As temperatures warm heading into March and water demand increases with vegetative growth, additional degradation may be warranted for the lower Mississippi Valley. Although no changes were made this week to the southern high Plains, soil moisture continues to rank in the lowest 5th percentile consistent with much of this region being designated with D3 levels of drought. The lack of adequate soil moisture remains a major concern for the winter wheat crop across the southern Great Plains, while many counties of Oklahoma and Texas remain under a burn ban.
Midwest
A swath of moderate to heavy snow with 7-day liquid equivalent amounts of more than 1 inch resulted in a slight reduction in the abnormal dryness (D0) and moderate drought (D1) across north-central Illinois and southeast Iowa. A decrease in the D0 coverage was also made to parts of Missouri where recent rainfall has led to improving conditions including a favorable response in 28-day average streamflows. However, most ongoing D0 and D1+ areas of the Midwest Region received less than 0.5 inch, liquid equivalent, which supported going with status quo this week. Farther to the north, a deepening snowpack with snow water equivalent of 2.5 to 4 inches supported a 1-category improvement to much of northern Minnesota.
High Plains
Following two weeks of worsening conditions across the central Great Plains, additional degradations were made to parts of Kansas and southern Nebraska. These degradations were supported by 30 to 120-day SPI and soil moisture indicators. Snowfall of more than 6 inches during mid-February and favorable snow water equivalent values supported a one category improvement over the Bitterroots of western Montana. A small reduction in exceptional drought (D4) and extreme drought (D3) was made to western and south-central Montana, due to this past week’s snowfall (more than 0.5 inch, liquid equivalent) along with consideration of SWE for the season and long-term SPIs.
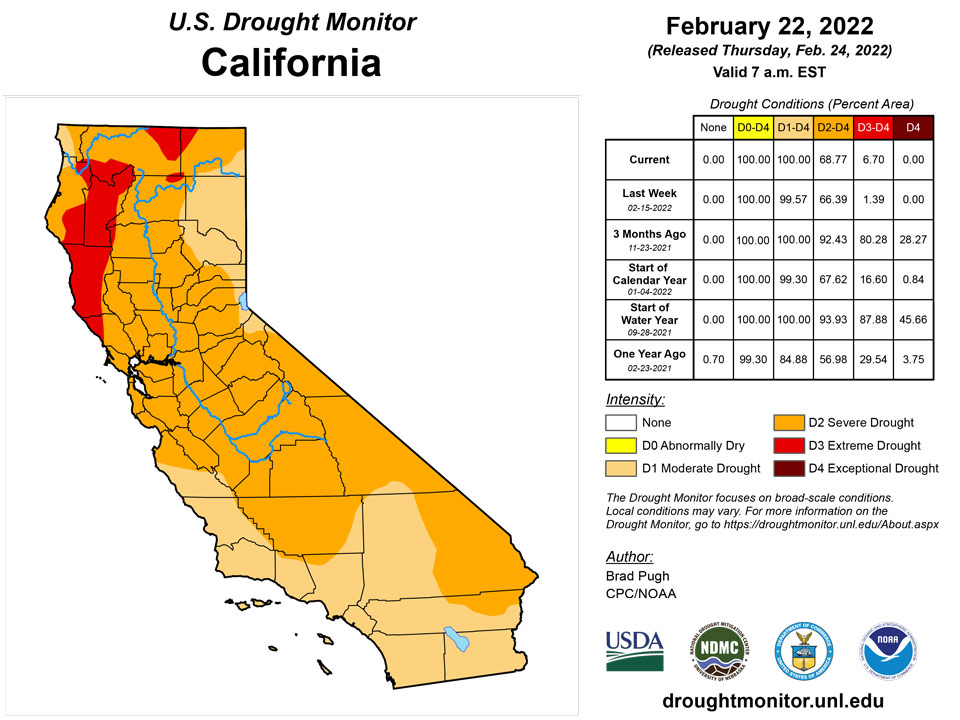
West
Following the wet December 2021 for much of the West, a dry pattern persisted since early January. 2022 year-to-date precipitation averages less than 25 percent of normal throughout much of California and the Great Basin. Snow water equivalent (SWE) continues to decline due to the dry pattern during January and February with SWE falling below 75 percent of normal for much of the southern Cascades, Sierra Nevada Mountains, and Great Basin. Due to the persistently dry pattern since early January, a 1-category degradation was made to parts of northern California and southwest Oregon which reflects the extreme (D3) levels of drought according to the 24-month and 2022 year-to-date SPI, soil moisture indicators, and 28-day average streamflows. Without a major pattern change during March, additional degradations may be needed for California and the Great Basin in the weeks ahead.
A slight expansion of D3 was made to northern Wyoming to be consistent with 12 to 24-month SPIs. Recent snowfall with SWE currently running near to above average prompted a 1-category improvement to the north of Denver, Colorado. Based on a favorable snowpack across the Clearwater and Salmon basins of central Idaho, severe (D2) was improved to moderate (D1) drought for that part of Idaho. Moderate drought (D1) was degraded to severe drought (D2) across the Upper Snake River basin of Idaho as SWE for the headwaters or this basin are nearing the 10th percentile. 7-day precipitation amounts of more than 1 inch, liquid equivalent, prompted a 1-category improvement from extreme (D3) to severe (D2) drought across parts of south-central Montana. Periods of above-normal temperatures coupled with enhanced surface winds support an expansion of severe (D2) to extreme (D3) drought across southern and eastern New Mexico. These worsening conditions are also consistent with SPEI at various time scales and the depiction for western Texas.
Caribbean
7-day rainfall totaled 1 to 3 inches across northeast and southwest parts of Puerto Rico. Since precipitation has averaged at or above normal dating back 90 days for much of Puerto Rico, the D0-D1 impact was changed from short- to long-term. The ongoing D0-D1 areas coincide with where 180-day rainfall deficits continue.
Long-term moderate to extreme drought persisted across the US Virgin Islands this week since rainfall totals haven't been significant and groundwater levels continue to decline across the three locations. Rainfall totals across the US Virgin Islands were less than 0.15 inch of rain, according to the satellite and radar based QPE maps. St. John had 0.17 inch to close to half an inch of rain across the different CoCoRaHs stations. The month-to-date rainfall total at the Rafe Boulon station was 216.2% of normal and the year-to-date total was 108.2% of normal. SPI values at the 1 month scale were indicative of drought free conditions, while the SPI values at the 3, 6, 9, and 12 months were indicative of abnormally dry conditions.
The Cyril E. King Airport, St. Thomas had only 0.28 inch of rain this week, resulting in a month-to-date that was 199.3% of normal and a year-to-date that was 104.6% of normal. CoCoRaHS stations across St. Thomas had rainfall that ranged between 0.20 to 0.61 inch. SPI values at the Charlotte Amalie at the 1 and 3 month period were indicative of drought free conditions, while the 6, 9, and 12 month periods were indicative of moderate to severe drought. Groundwater at the USGS Grade School 3 Well shows a continued decline from 9.1 feet below land surface at the beginning of the month to 11.9 feet below land surface as of Feb 23.
Similarly, the Henry E. Rohlsen airport at St. Croix had 0.33 inch of rain this week. The month-to-date rainfall was 413.2% of normal and 220.0% of normal for the year so far. SPI values at the airport were indicative of drought free conditions for the 1 and 3 month periods, while the 6, 9, and 12 periods were indicative of moderate drought. Meanwhile, the East End had SPI values that were indicative of severe drought at the 9 and 12 month periods.
Pacific
Continued rainfall for windward areas of Hawaii and improving streamflows resulted in a 1-category improvement to eastern parts of the Big Island, Maui, and Molokai.
Drought free conditions continued in Palau since they had over 2 inches of rain this week and over 7 inches so far for the month.
The Marianas had a dry week, with all three locations receiving less than half an inch of rain. Abnormally dry conditions persisted across all three locations this week.
Several locations across the Federated States of Micronesia had an extremely wet week. Pohnpei and Ulithi each had at least 4 inches of rain this week, securing another week of drought free conditions. Meanwhile, Kapingamarangi, Yap, and Lukunor had over 2 inches of rain. Yap and Lukunor continued to be drought free, while Kapingamarangi drought classification was changed from abnormally dry to drought free conditions. Kapingamarangi's month-to-date rainfall total is 7.46 inches, which is close to the 8 inches threshold to meet most water needs. Pingelap and Kosrae had 1.16 inches and 1.61 inches of rain, respectively; however, drought free conditions persisted. Nukuoro continued to be abnormally dry this week since it only had 1.26 inches of rain, resulting in a month-to-date rainfall total at 3.24 inches. Fananu continued to be in severe drought since no rain fell this week and, according to the latest drought information statement (Feb 17, 2022), the water tanks were empty and the main water catchment was extremely low. Chuuk Lagoon and Woleai continued to be in moderate drought since they had less than 2 inches of rain for the week and month-to-date totals were less than 3 inches for both locations.
The Marshall Islands had a dry week, with most stations having less than 1 inch of rain. Wotje continued in extreme drought since this week marked Wotje's 11th consecutive week with no rain. Kwajalein and Ailinglaplap continued in moderate drought since they only had 0.03 and 0.17 inch of rain this week, respectively. Majuro also had only 0.17 inch of rain. According to Majuro's Water and Sewer Co, Majuro's reservoir levels were at 68.4% of the maximum of 36 million gallons, which is less than the critical 80% threshold. For this reason, Majuro's drought classification was changed to abnormally dry conditions.
Rainfall totals for the week across American Samoa were over 5 inches, which is over the monthly threshold to meet most water needs. Drought is not a concern in American Samoa.
Looking Ahead
On February 24, a major winter storm will be ongoing across the south-central U.S. with snow and freezing rain. This winter storm is forecast to shift to the Midwest and Northeast where there is the potential for more than 6 inches of snowfall. The heaviest precipitation (more than 1 inch), associated with the low pressure system, is likely to affect the increasingly wet areas of the Ohio and Tennessee Valleys. In the wake of this winter storm, bitterly cold temperatures are forecast to overspread the Great Plains and also expand east across the Corn Belt. Onshore flow is expected to bring rain and high-elevation snow to the Pacific Northwest on February 27 and 28. Little to no precipitation is forecast along the Gulf Coast, Florida, and California through the end of February.
The Climate Prediction Center’s 6-10 day outlook (valid Mar 1-5, 2022) favors near to above normal temperatures across much of the contiguous U.S. However, it should be noted that below normal temperatures are likely to return to the northern Rockies, northern Great Plains, and upper Mississippi Valley by the second week of March. Below normal precipitation is favored for much of the Southeast, southern Great Plains, Southwest, and California, while above normal precipitation is most likely from the northern Rockies east to the northern Great Plains and upper Mississippi Valley.
Author(s):
Brad Pugh, NOAA/CPC
Ahira Sanchez-Lugo, NOAA/NCEI
Dryness Categories
D0 Abnormally Dry—used for areas showing dryness but not yet in drought, or for areas recovering from drought.
Drought Intensity Categories
D1 Moderate Drought
D2 Severe Drought
D3 Extreme Drought
D4 Exceptional Drought
Drought or Dryness Types
S Short-term, typically less than 6 months (agriculture, grasslands)
L Long-term, typically more than 6 months (hydrology, ecology)
SL Area contains both short- and long-term impacts
Source: National Drought Mitigation Center
