


In hindsight, we can now see that on many demographic fronts the U.S. population in 1950 looked more like the country in 1940 than the rapidly growing, youthful nation to come in 1960 or 1970.
April 2, 2022 - By Marc Perry, Brian Mendez-Smith And Lynda Laughlin - The National Archives and Records Administration (NARA) on Friday released individual records of everyone counted in the 1950 Census April 1, following a mandatory 72-year waiting period.
The 1950 Census opens a window into one of the most transformative periods in modern American history, revealing a country of roughly 151 million people who had just recently emerged from the hardships and uncertainties of World War II and the Great Depression.
With little housing construction during the prior two decades, the nation's population mostly lived in cities and rural areas, often in crowded conditions. Suburbanization had only recently begun and would increase substantially in the coming decades thanks to the GI Bill, sustained postwar economic expansion and construction of a comprehensive interstate highway system.
In short, the country had not yet been impacted by most of the major postwar demographic and economic trends that would greatly change the size, shape and composition of the U.S. population.
In hindsight, we can now see that on many demographic fronts the U.S. population in 1950 looked more like the country in 1940 than the rapidly growing, youthful nation to come in 1960 or 1970.
Peak Populations in Some Cities in Industrial Northeast and Midwest
A number of large industrial cities in the Northeast and Midwest hit their peak decennial populations in 1950 and would experience population declines in subsequent decades in both relative and absolute terms.
Of the nation’s 10 largest cities in 1950, only New York and Los Angeles would have bigger populations in 2020. The other eight (Chicago, Philadelphia, Detroit, Baltimore, Cleveland, St Louis, Washington, D.C., and Boston) all saw their decennial populations peak in 1950 and fall in the coming decades.
In some cases, the population losses were sizeable, amounting to one half or more of the cities’ 1950 populations. In some of these cities, the population began climbing again in recent decades.
Most of the Baby Boom Yet to Come
In 1950, the nation was just four years into the postwar baby boom (the jump in births between 1946 and 1964) and it was unclear how long the period of higher fertility would last. The population under age 18 was 31.0% of the total population in 1950 and would grow to 34.3% in 1970.
The baby boom triggered a dip in the nation’s median age, which had been steadily increasing in previous decades. It would subsequently drop from 30.2 in 1950 to 29.5 in 1960, and 28.1 in 1970, before rising again and reaching 38.4 in 2019 as the oldest boomers turned 73.
Households and Families
A preliminary report based on the 1950 Census summarized changes in families as follows: “An unprecedented proportion of married persons, a record number of young children, and a smaller average size of household are among the many developments in the population of the United States during the last 10 years that are reflected in the 1950 Census of Population.”
The decline in household size continued. There was an average of 3.51 people per household in 1950, substantially higher than the average of 2.61 in 2019.
One factor: Fewer people lived alone. In 1950 just 9% of households had someone living alone compared with 28% in 2019.
Back then, adults were more likely to be married — 68% of men and 66% of women, compared with 49% of men and 46% of women in 2019. That translated into a lot more family households with married couples.
In 1950, 87% of family households were married couples, while 9% had a female householder and the remaining 4% had a male householder.
Today, 73% of families have a married householder, while 19% have a female householder and 8% have a male householder. These families were more likely to have children under 18 present in 1950 (52%) than in 2019 (41%).
Women in the Workplace
In 1950, most working age women were not in the workforce. Out of the approximately 57 million working-age women in the United States, only 29% participated in the labor force — 46.4% of single women and 21.6% of married women. By 2019, 59% of the nation’s working age women were in the labor force.
The five occupations employing the largest number of women in 1950 were stenographers, typists, secretaries; saleswomen in retail trade; school teachers; bookkeepers; and workers in apparel factories. Together, these five occupations employed more than a fourth of all women workers in 1950.
By 2019, the most common jobs for women mirrored 1950 in many aspects with secretarial and teaching jobs remaining prominent. But women had also made inroads into growing sectors like health care.
The five occupations employing the largest number of women in 2019 were registered nurses; elementary and middle school teachers; secretaries and administrative assistants; miscellaneous managers; and customer services representatives.
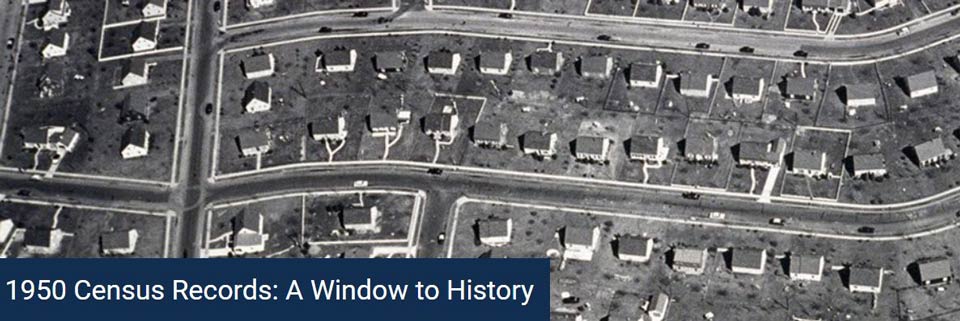
Nascent Suburbanization
Suburbanization had only recently begun by 1950 and would expand greatly in the coming decades. The U.S. population in 1950 still lived mostly either in cities or in rural areas, often on farms.
The share of the population in metro areas was 56.1% in 1950, with 32.8% in central cities and 23.3% living in suburbs. But in the coming decades, nearly all increases in the metropolitan share of the population would stem from growth in the suburbs.
By 2000, 80.3% of the nation's population lived in metro areas, with fully 50% in suburbs and 30.3% in central cities.
Cook County, Illinois, home to Chicago, is a good example. In 1950, 80% of the county’s population lived in Chicago. By 1970, as suburbanization boomed, that share had slipped to 61% and Chicago's population had declined somewhat. By 2020, the share of the county's population in Chicago had fallen to 52%.
Of the nation’s 10 largest cities in 1950, only New York and Los Angeles would have bigger populations in 2020. The other eight (Chicago, Philadelphia, Detroit, Baltimore, Cleveland, St Louis, Washington, D.C., and Boston) all saw their decennial populations peak in 1950 and fall in the coming decades.
Large Cities Still Largely in Northeast and Midwest
The growth of cities in the Sunbelt was still a relatively new phenomenon in 1950.
Only three of the country's 10 largest cities in 1950 (Los Angeles, Baltimore, and Washington, D.C.) were in the South or West. By 2020, that figure had risen to 7 of the 10, with three top cities — Houston, San Antonio, Dallas — in Texas.
Some Sunbelt Cities Yet to Show Explosive Growth
Air conditioning was not yet in widespread use in 1950. Consequently, many parts of the Sunbelt, especially the more arid regions with high summer temperatures, were still relatively lightly populated compared to what they would look like in later decades.
Phoenix had just over 100,000 people in 1950 and ranked 99th in population among cities. Its population would more than quadruple to 439,000 in the next 10 years. By 2020 Phoenix’s population would reach 1.6 million, making it the country’s fifth largest city.
The story was much the same in Las Vegas, whose population ballooned from just over 24,000 people in 1950 to 642,000 in 2020.
Changes in Relative Rankings of Cities
The rankings of cities by population were considerably different in 1950 prior to the trends in regional migration and suburbanization.
For instance, Cleveland in 1950 had about 915,000 people and was the nation's seventh-largest city. Aurora, Colo., meanwhile, was a small suburb of Denver with just 11,000 people. By 2020, Aurora's population had skyrocketed to around 386,000, making it the 51st largest city in the country surpassing Cleveland (population around 373,000), then ranked 54th.
A Genealogy Goldmine
With the upcoming release of the 1950 Census individual records, researchers, genealogists and others will be able to see demographic snapshots of households and individuals and get a clearer picture of the larger societal trends going on at that time.
The 1950 Census might have been the last census your grandparents filled out before moving from the city to the suburbs. Or it might be the first census showing an African American family from the rural South living in an urban neighborhood in the Northeast or Midwest, or a family from the rural Midwest living in California.
A decennial census is, after all, a collection of data on every individual in the United States. After 72 years, the individual stories of each person enumerated in the 1950 Census reverberate through newer generations.
Source: U.S. Census Bureau
