


California and National Drought Summary for April 5, 2022
Summary
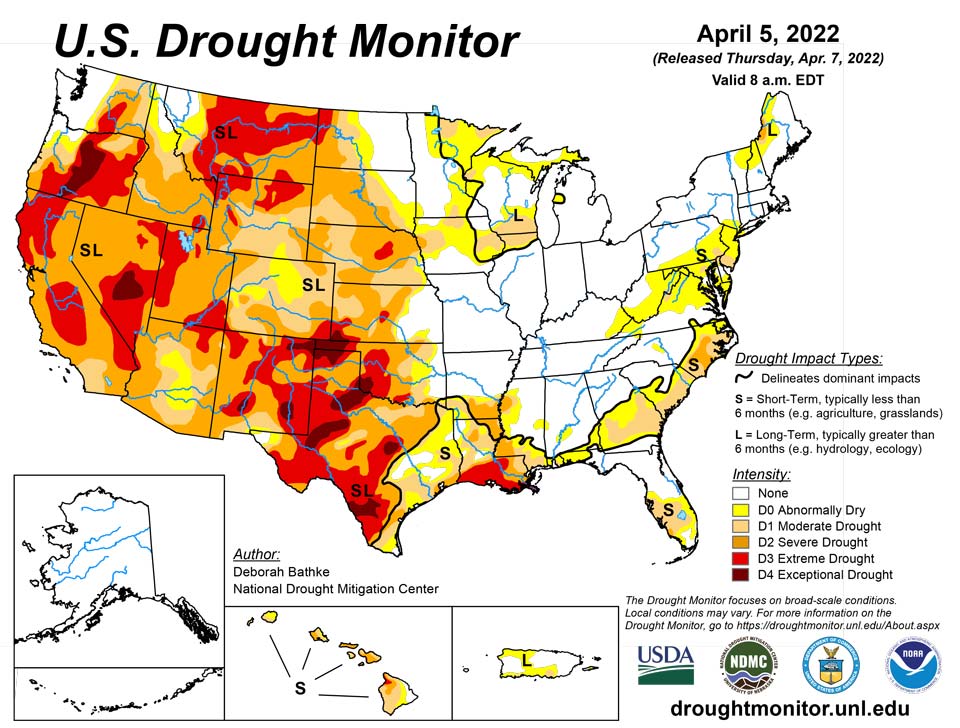
April 7, 2022 - April brought heavy rain to parts of the Midwest, South, and Southeast leading to broad areas of drought improvement in these regions. Meanwhile, drought expanded and intensified in the West with many locations setting records for the driest 3-month period (January to March). The High Plains remained largely unchanged this week with small pockets of improvements and degradations.
Northeast
Near-normal precipitation this week had little effect on the long-term drought in New England. Drought remains in areas where precipitation deficits are firmly in place and where recovery lags in deeper soil layers, shallow groundwater, and well data. Abnormal dryness expanded over the Mid-Atlantic short-term where precipitation deficits, stream flow measurements and soil moisture conditions have fallen below normal.
Southeast
Once again, the southeast saw a mix of improvements and worsening short-term drought conditions. Rainfall totals of 2 inches or more helped ease abnormally dry and/or moderate drought in Alabama, Florida, Georgia, and South Carolina. Precipitation indicators and stream flow measurements show improvements and support the analysis. Increases in drought extent and severity include the expansion of abnormally dry conditions across northern Virginia and the introduction of moderate drought in North Carolina. Indicators supporting drought expansion in the southeast primarily include short-term precipitation deficits, declining soil moisture and below-normal stream flow.
South
Like last week, the South saw drought worsen across west and south Texas and the Oklahoma Panhandle. Above-normal temperatures combined with below-normal precipitation and high winds exacerbated conditions. Drought indicators supporting the degradations include increasing precipitation deficits, dry surface and root zone soil moisture and low stream flow. One-category improvements were made to drought conditions across east Texas, southern Arkansas, north and central Louisiana and Mississippi as the effects of the recent wet pattern propagated through indicators such as streamflow, soil moisture, and vegetation. Note that the heavy, solid black line separating the part of the region experience short-term drought was modified to reflect the effects of the recent rain.
Midwest
Another week of above-normal precipitation combined with below temperatures led to more improvements across the Midwest this week. Large areas of 1-category improvements took place across the Upper Midwest where rain and snow totals of 150% to more than 300% of normal fell over the last 30 days. Short-term deficits have been erased with long-term drought remaining in areas where precipitation deficits of 6 months or longer exist and where deeper soil moisture and groundwater indicators are slower to recover.
High Plains
South-central Colorado saw a reduction in severe (D2) and extreme (D3) drought. Last week’s precipitation continued a trend of wetter-than-normal conditions that’s been in place since the start of the year. Short- and long-term indicators including precipitation, snowpack, soil moisture, and stream flow are responding to the excess moisture. Severe drought also decreased in southwest Wyoming for similar reasons. Kansas saw drought worsen in the west and improve in the east. D3 expanded in southwest Kansas, where precipitation deficits are less than 10 percent of normal over the last 60 to 90 days. Other indicators supporting this assessment include increased evaporative demand and soil moisture. In eastern Kansas, the map depicts a continuation of improvements made last week. In south-central Nebraska, moderate drought expanded in response to increasing precipitation deficits, dry soil moisture indicators, and reports of low stock ponds. The rest of the region remained unchanged this week. State drought monitoring teams have all noted the increasing dryness across the region.
West
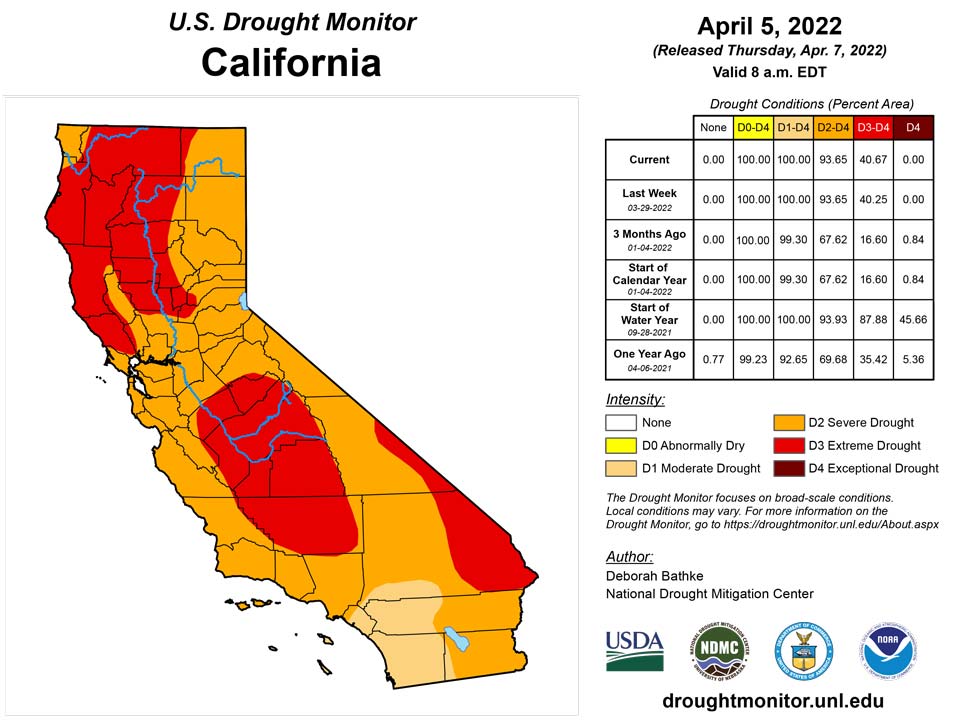
Parts of the Northwest saw a healthy dose of precipitation and mountain snow during the past week. In most cases, this precipitation fell over areas free from drought or simply wasn’t enough to bring relief to drought impacted areas. Only southwest Oregon saw improvement with a small decline in moderate drought (D1). Oregon also saw an expansion of drought of severe (D2) and extreme (D3) drought. Water-year-to-date (October 1 to April 5) precipitation fell short and warmer-than-normal temperatures caused rapid and early melt out to the state’s snowpack. Soil moisture and shallow groundwater indicators are reflecting the worsening conditions. In the southeast part of the state, the drought monitoring team noted impacts including extremely dry soil conditions, a lack of surface water, and poor pasture forage conditions. Central Washington, Idaho, and northwest Montana also saw increases in drought extent or severity as short-term dryness continues to build upon long-term moisture deficits extending back to last year. Many parts of southern Idaho, and the rest of the West, have set records for the driest 3-month period (January to March) going back 100 years or more. Meanwhile near record warmth increased evaporative demand from plants and soils. Farther south, extreme drought (D3) expanded in parts of California, Nevada, and New Mexico while moderate (D1) and severe (D2) drought expanded across Arizona. In California, Cooperative Extension reports impacts to agriculture including reduced forage, livestock stress, decreased water allocation, and the selling livestock earlier than normal. Data such as reduced stream flows and declines in satellite-based vegetation health and soil moisture indicators confirm these reports.
Caribbean
In Puerto Rico, the map remained unchanged this week. Streamflow and well data continue to remain low in the drought depicted areas.
A wetter-than-normal winter across the U.S. Virgin Islands brought some limited drought relief. Typically, only 12 to 15% of the territory’s annual rainfall typically occurs from January to March. This year, January 1 – March 31 rainfall totaled 7.39 inches (115% of normal) at King Airport on St. Thomas and 7.89 inches (161%) at Rohlsen Airport on St. Croix. The heaviest winter rainfall generally occurred in early February; prior to that rain, drought intensity peaked at D3 (extreme) on St. Thomas and St. Croix, and D2 (severe) on St. John.
Currently, D2-L (severe long-term drought) is in place across St. Croix, while D1-L (moderate long-term drought) exists on St. Thomas and St. John. Groundwater shortages – indicative of long-term drought – remain a problem, especially on St. Croix, which is a key reason for the persistence of D2. According to the U.S. Geological Survey’s Adventure 28 Well on St. Croix, depth to water reached 31.25 feet on April 4, greatest at any time since at least 2016. The Susannaberg DPW 3 Well on St. John is on the cusp of a 20-foot depth to water (currently near 19.5 feet) for the first time since mid-2017.
During the March 29 – April 4 drought-monitoring period, occasional, generally light showers occurred across the U.S. Virgin Islands. Seven-day totals included 0.44 inch at King Airport and 0.29 inch at Rohlsen Airport. More than a dozen volunteer (CoCoRaHS) observers reported 7-day rainfall ranging from 0.06 to 0.90 inch.
Pacific
Alaska remained free of drought or abnormal dryness this week.
In Hawaii, breezy trade winds and showers helped reduce rainfall deficits and improve stream flows. Unfortunately, most leeward areas did not fare as well, and drought persists. Changes to this week’s map include: a reduction in moderate drought (D1) on Kauai and the Big Island and a reduction in severe drought (D2) on Molokai and Maui.
American Samoa is coming off a very hot March, with Pago Pago International Airport setting an all-time record with 26 consecutive days – February 26 to March 23 – with a high of 90°F or greater. However, rain continued to fall during the hot spell, with the airport reporting a monthly total of 5.50 inches. In the last week, somewhat drier weather developed, although around an inch of rain fell during the drought-monitoring period at the National Park Service observation sites of Siufaga Ridge and Toa Ridge. For now, American Samoa remains free of dryness and drought.
Meanwhile, the Republic of Palau continues to receive ample rain, with more than 10 inches reported during March at multiple observation sites, and additional showers noted in early April.
In the Mariana Islands, there was a brief increase in shower activity in late March and early April. During the drought-monitoring period, several 1- to 2-inch rainfall totals were noted across Guam and other islands, with Dededo reporting at least 2.43 inches. Fire concerns were temporarily alleviated by the rain, which briefly lowered Guam’s Keetch-Byram Drought Index below 600, down from well over 700 the previous week. In recent days, however, mostly dry, breezy conditions have returned across the Marianas, leading to the National Weather Service’s issuance of a Red Flag Warning for Guam. As a result, there are no changes to the depiction, which includes moderate drought (D1-S) for Guam and abnormal dryness (D0-S) for Rota and Saipan.
Across the Federated States of Micronesia (FSM), forecasters have been monitoring the Joint Typhoon Warning Center’s Invest 95W for several days. The disturbance, which has the potential to become an organized tropical system, has been delivering periodic heavy showers across various parts of the FSM. Rainfall during the drought-monitoring period totaled 7 to 10 inches in locations such as Pingelap, Pohnpei, and Kosrae. Abnormal dryness (D0-S) was removed from Yap, where March rainfall totaled 7.23 inches and the total during the 7-day period was 2.87 inches. D0-S was also eradicated from Ulithi, which received 5.19 inches over the last 7 days. However, D0-S was retained for Kapingamarangi, where the 3.00-inch weekly total followed a drier-than-normal March. No analysis was made for Fananu due to erratic reporting of rainfall data in recent weeks.
Finally, generally wet weather prevailed across the Marshall Islands, with more than 9 inches of rain reported during the drought-monitoring period at Ailinglapalap. Wotje received beneficial rain, with 2.44 inches reported in the last 7 days. Although extreme drought (D3-SL) was retained for Wotje, improvement may soon occur if showery conditions continue. Data from Utirik remains missing.
Looking Ahead
The National Weather Service Weather Prediction Center (valid April 7 – April 9) calls for another storm system to move across the eastern half of the Lower 48. Multi-day snow is expected over the long-term drought areas in the Upper Midwest. Drought areas in the Southeast and Mid-Atlantic are expected to see rain. Meanwhile, dry weather is expected across much of the drought-stricken Plains and West. An approaching front moving into the Pacific Northwest and Northern Rockies will bring rain and snow. Moving into the weekend, the forecast (valid April 9 – 13) calls for rain and high elevation snow and well below normal temperatures across the West. The colder temperatures, rain, and snow will reach into the northern and central Plains by early next week. At 8 – 14 days, the Climate Prediction Center Outlook (valid April 14 – 20) calls for below normal temperatures over much of the western and central U.S. and Alaska. Above normal temperatures are predicted over the east and west coasts. Near to above normal precipitation is favored for the Central Rockies eastward. Below normal precipitation is favored over California, Nevada, southeastern New Mexico, and southwestern Texas.
Author(s):
Deborah Bathke, National Drought Mitigation Center
Brad Rippey, U.S. Department of Agriculture
Dryness Categories
D0 Abnormally Dry—used for areas showing dryness but not yet in drought, or for areas recovering from drought.
Drought Intensity Categories
D1 Moderate Drought
D2 Severe Drought
D3 Extreme Drought
D4 Exceptional Drought
Drought or Dryness Types
S Short-term, typically less than 6 months (agriculture, grasslands)
L Long-term, typically more than 6 months (hydrology, ecology)
SL Area contains both short- and long-term impacts
Source: National Drought Mitigation Center
