


Mariposa, California
Sierra Sun Times file photo
Mariposa County: Total Population on 1/1/2021: 17,066 - Total Population on 1/1/2022: 17,045 -0.1%
In 2008 the county had 18,354 residents.
Madera County: Total Population on 1/1/2021: 156,385 - Total Population on 1/1/2022: 157,396 +0.6%
Tuolumne County: Total Population on 1/1/2021: 54,791 - Total Population on 1/1/2022: 55,291 +0.9%
May 2, 2022 - SACRAMENTO - California’s population dipped slightly by 117,552 residents last year, bringing the state’s total to 39,185,605 people as of January 1, 2022, according to new population estimates and housing data released today by the California Department of Finance.
The 0.3-percent decline represents a slowing compared to the 0.59-percent decline over the ninemonth period between the April 2020 Census date and the year’s end.
As Baby Boomers age, and fertility declines among younger cohorts, the continuing slowdown in natural increase -- births minus deaths -- underlies the plateauing of the state’s population growth. The addition of COVID-19-related deaths, federal policies restricting immigration, and an increase in domestic out-migration further affected population totals. Overall growth was also affected by continuing federal delays in processing foreign migration: while last year saw positive immigration (43,300), the level was below the average annual rate of 140,000 before the pandemic.
The report contains preliminary year-over-year January 2022 and revised January 2021 population data for California cities, counties, and the state. These estimates are based on information through January 1, 2022. Significant changes over the year include:
While population growth remained strong in the interior counties of the Central Valley and the Inland Empire, the majority of counties saw declines, including every coastal county except San Luis Obispo, Santa Barbara, and Santa Cruz (due in part to college students returning to campus).
Only two counties had growth above one percent: Yolo (1.8 percent), due to increases in college group quarters (dorms), and San Benito (1.1 percent), due to housing gains. Following in percentage growth were Modoc (1.0 percent), Tuolumne (0.9 percent), and Merced (0.9 percent) counties.
Thirty-four of the state’s fifty-eight counties lost population. The ten largest percentage decreases occurred in Plumas (-3.2 percent), Lassen (-2.8 percent), Butte (-2.4 percent), Del Norte (-1.4 percent), Napa (-1.0 percent), San Mateo (-0.9 percent), Marin (-0.9 percent), Shasta (-0.8 percent), San Francisco (-0.8 percent), and Ventura (-0.8 percent).
The state’s three most populous counties all experienced population loss: Los Angeles declined by 70,114 persons (-0.7 percent), San Diego by 1,197 persons (-0.04 percent), and Orange by 7,297 persons (-0.2 percent).
Also of note in the report:
361 cities lost population, while 118 gained population and 3 had no change.
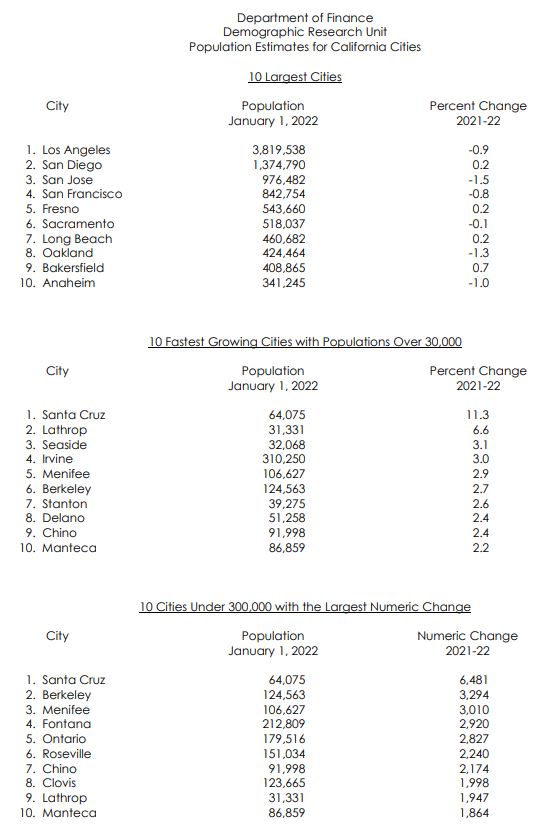
Of the ten largest cities in California, Bakersfield had the largest percentage gain in population (0.7 percent, or 2,736), followed by San Diego (0.2 percent, or 2,958).
Group quarters represent 2.3 percent (907,000) of the total state population. This population includes those living in college dormitories 240,000) and in correctional facilities (172,000). Between April 1, 2020 and January 1, 2021, California’s group quarters population decreased by 165,000 people or 17 percent, due principally to policies associated with COVID-19. The dormitory population dropped by 109,000 (45.0 percent). In 2021, however, college group quarters populations have returned to 98.9 percent of their 2020 Census levels with 240,000 students in dormitories, which restored populations in many college towns. Areas most affected by the pandemic-driven shift in college dormitory population between 2020 and 2021 based on total population growth include: Unincorporated Yolo County (26.5 percent), Santa Cruz (11.3 percent), Albany (5.4 percent), Unincorporated Santa Barbara County (4.5 percent), Seaside (3.1 percent), and Irvine (3.0 percent).
State prisons are generally located in remote areas; as a result, increases or decreases can account for significant changes in their respective area populations. For example, prison declines led to population decreases in Taft (-4.7 percent) in Kern County, Susanville (-9 percent) in Lassen County, and Crescent City (-4.1 percent) in Del Norte County.
Background Information:
These population estimates are produced annually by the Department of Finance for use by local areas to calculate their annual appropriations limit. The State Controller’s Office uses Finance's estimates to update their population figures for distribution of state subventions to cities and counties, and to comply with various state codes. Additionally, estimates are used for research and planning purposes by federal, state, and local agencies, the academic community, and the private sector.
These estimates reflect a state and county level revision of the preliminary January 1, 2021 estimates that were released in May 2021 and reflected a state population at 39,466,855 versus this year’s revised estimate of 39,303,157; a downward revision of 163,698. The primary causes are the change to a new Census 2020 benchmark, and higher migration estimates during the COVID-19 pandemic.
Changes to the housing stock are used in the preparation of the annual city population estimates. Estimated occupancy of housing units and the number of persons per household further determine population levels. Changes in city housing stock result from new construction, demolitions, housing unit conversions, and annexations. The sub-county population estimates are then adjusted to be consistent with independently produced county estimates.
Comparing Census Bureau’s recently released July 1, 2021 estimates with Finance’s January 1, 2022 estimates should generally be avoided since they refer to different points in time. In addition, there are numerous differences between the two series including the effects of the wildfires, changes in migration patterns, accelerating slowdown in births, and excess deaths due to the COVID-19 pandemic that make comparisons difficult.
All Finance population and housing estimates are benchmarked to a decennial census. The estimates in this report are benchmarked to the 2020 decennial census.
Related population reports are available on the Department’s website
Click here for full release
Source: CA. Dept. of Finance:
