


IMPORTANT NOTE: The employment data for the month of April 2022 is taken from the survey week including April 12. Data for the month of May is scheduled for release on June 17, 2022.
Employers added 41,400 nonfarm payroll jobs
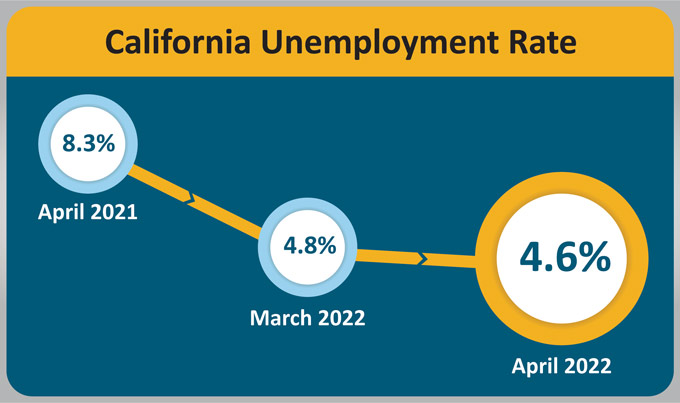
May 20, 2022 - SACRAMENTO – California’s unemployment rate went down for the month of April 2022 to 4.6 percent1 as the state’s employers added 41,400 nonfarm payroll jobs2 to the economy, according to data released today by the California Employment Development Department (EDD) from two surveys. March’s unemployment rate was revised down 0.1 percentage points to 4.8 percent largely due to a 6,000-person decrease in unemployment.
California’s Labor Market, by the Numbers...
- California has now regained more than 91 percent (2,519,000) of the 2,758,900 nonfarm jobs lost during March and April of 2020 due to the COVID-19 pandemic.
- Of the 428,000 nonfarm jobs gained nationally in April, California accounted for 9.7 percent of those gains.
- At 925,200 jobs, California had the largest absolute year-over seasonally-adjusted job increase in the nation in April 2022.
- California has enjoyed month-over gains in nonfarm jobs in 14 of the past 15 months totaling a 1,435,700 job gain over that time period.
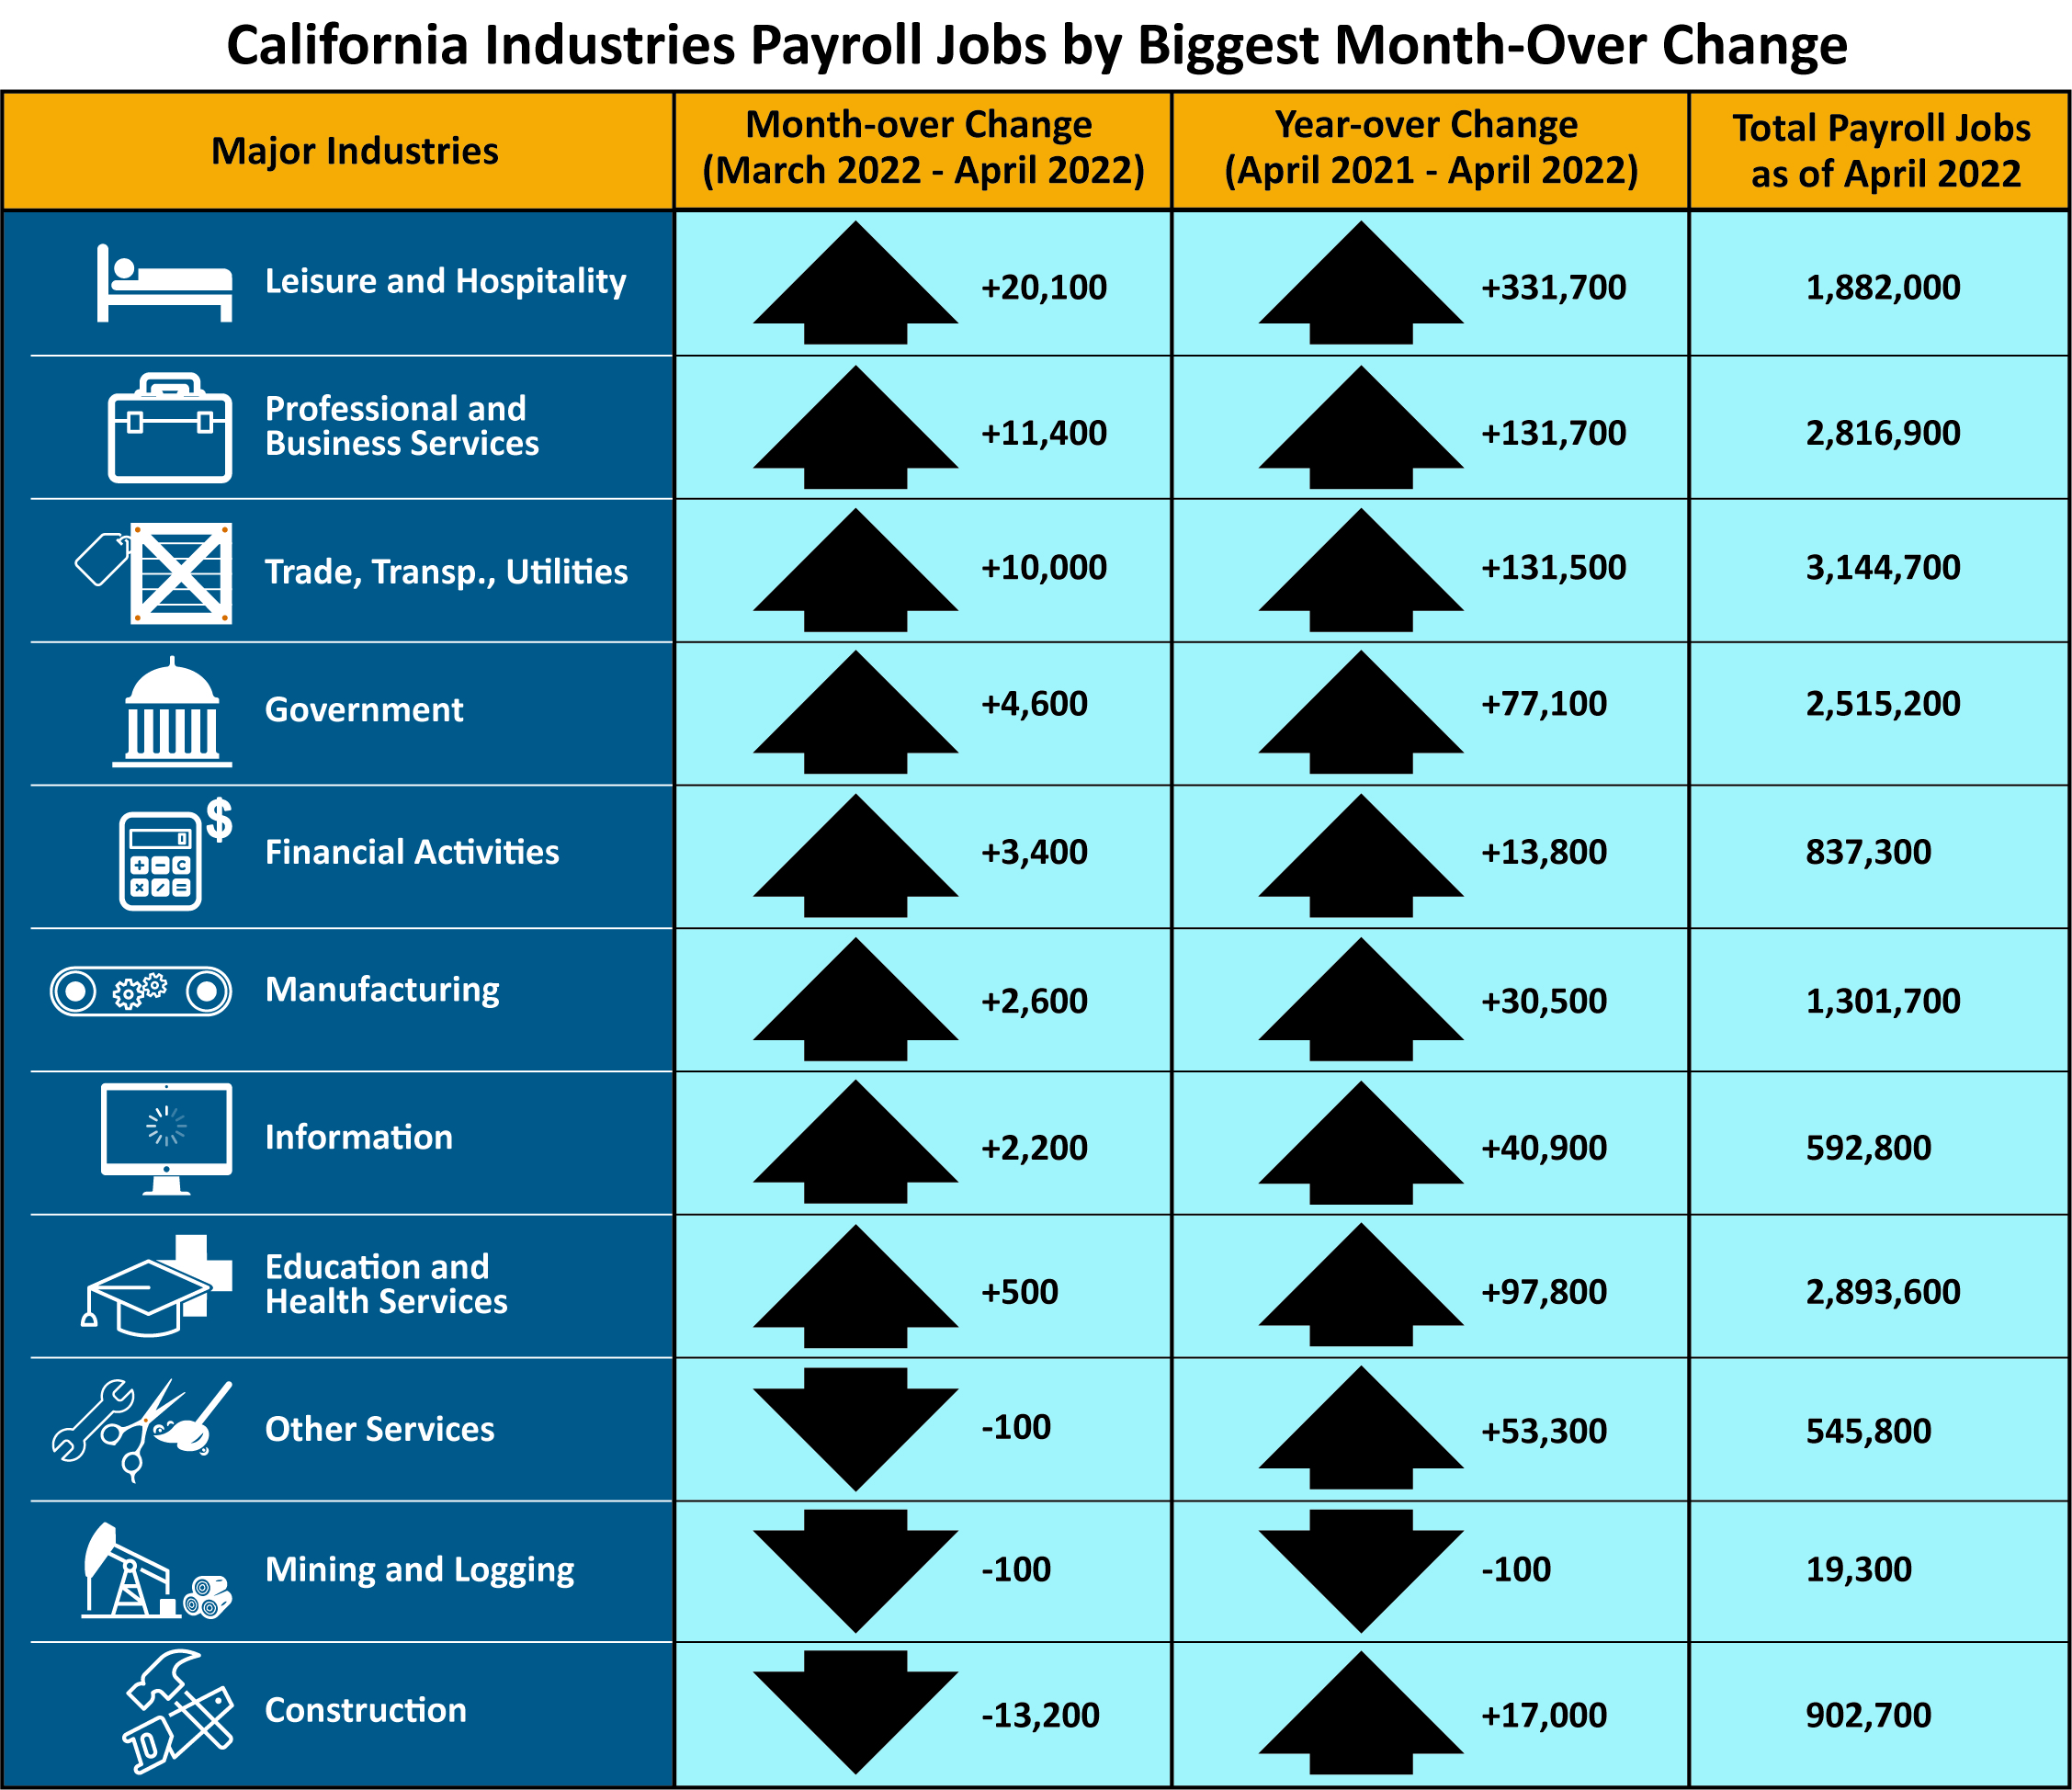
- Eight of California’s 11 industry sectors gained jobs with Leisure & Hospitality (+20,100) posting the largest increase for the third month in a row. Growth in full-service restaurants was the largest contributor towards the gain.
- Information (+2,200) has now regained all of the job losses the sector had sustained due to the COVID-19 pandemic.
- The large reduction in Construction (-13,200) reflects losses in Building Foundation & Exterior Contractors and Building Finishing Contractors, which were impacted by rain in April.
1. The unemployment rate comes from a separate federal survey of 5,100 California households.
2. The nonfarm payroll job numbers come from a federal survey of 80,000 California businesses.
Data Trends about Jobs in the Economy
Total Nonfarm Payroll Jobs
This comes from a monthly survey of approximately 80,000 California businesses that estimates jobs in the economy – seasonally adjusted.
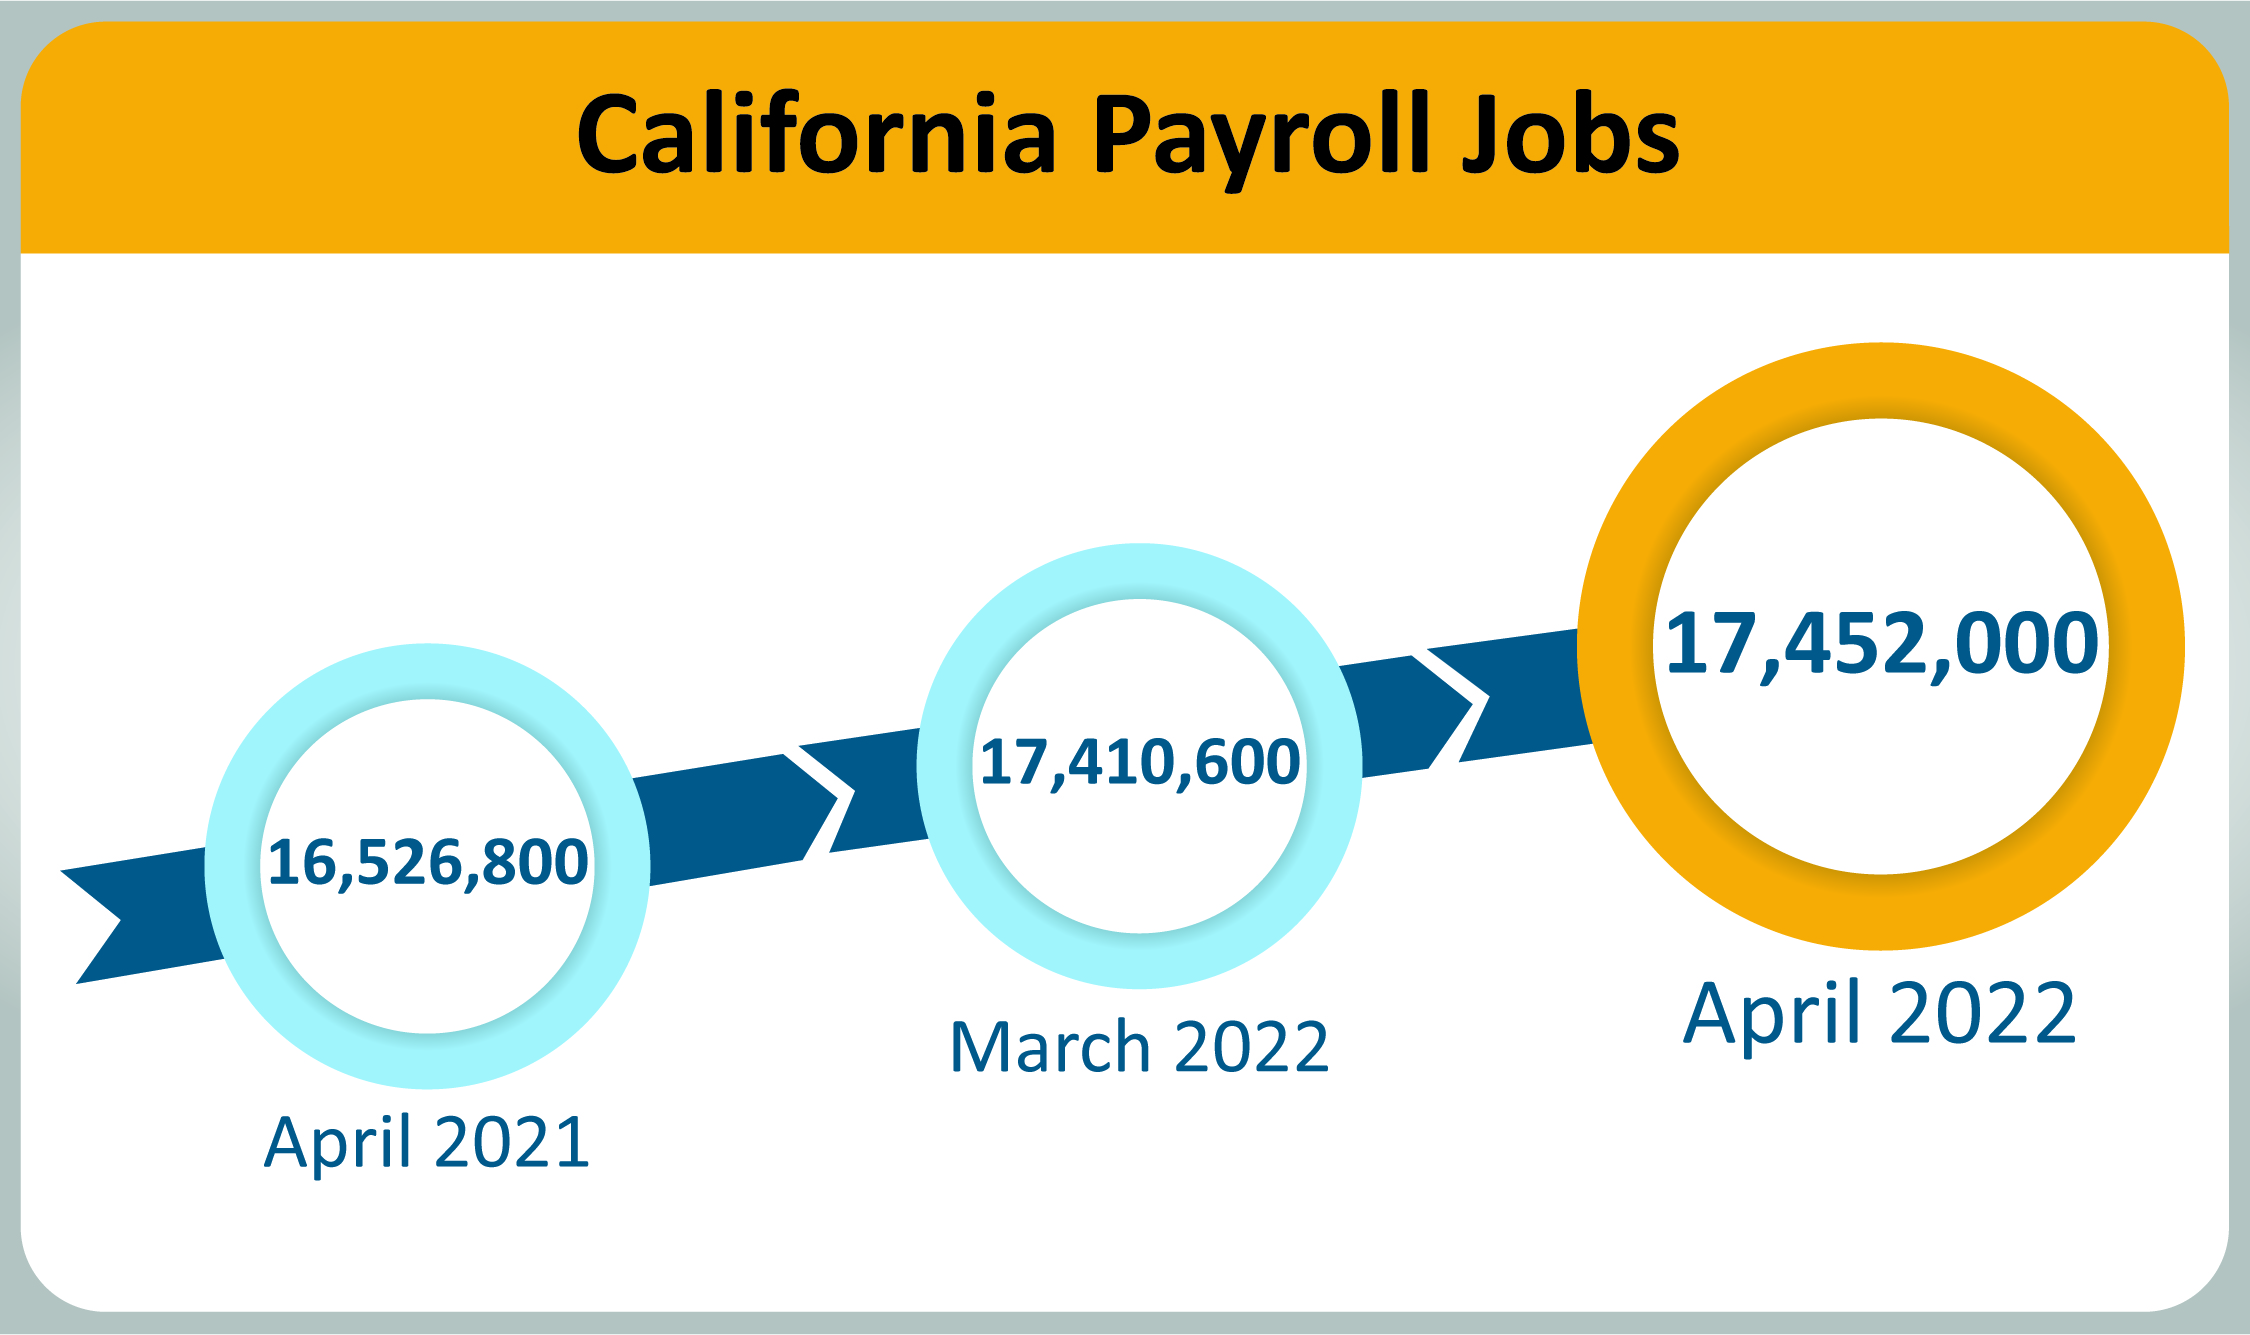
- Month-over – Total nonfarm jobs in California’s 11 major industries totaled 17,452,000 in April – a net gain of 41,400 jobs from March. This followed an upwards revised (+14,200) month-over gain of 74,400 jobs in March.
- Year-over – Total nonfarm jobs increased by 925,200 (a 5.6 percent increase) from April 2021 to April 2022 compared to the U.S. annual gain of 6,620,000 jobs (a 4.6 percent increase).
Total Farm jobs – The number of jobs in the agriculture industry showed no change from March to stay at 413,900 jobs in April. The agricultural industry has 3,300 more farm jobs in April 2022 than it did in April a year ago.
Data Trends about Workers in the Economy
Employment and Unemployment in California
This information is based on a monthly federal survey of 5,100 California households which focuses on workers in the economy.
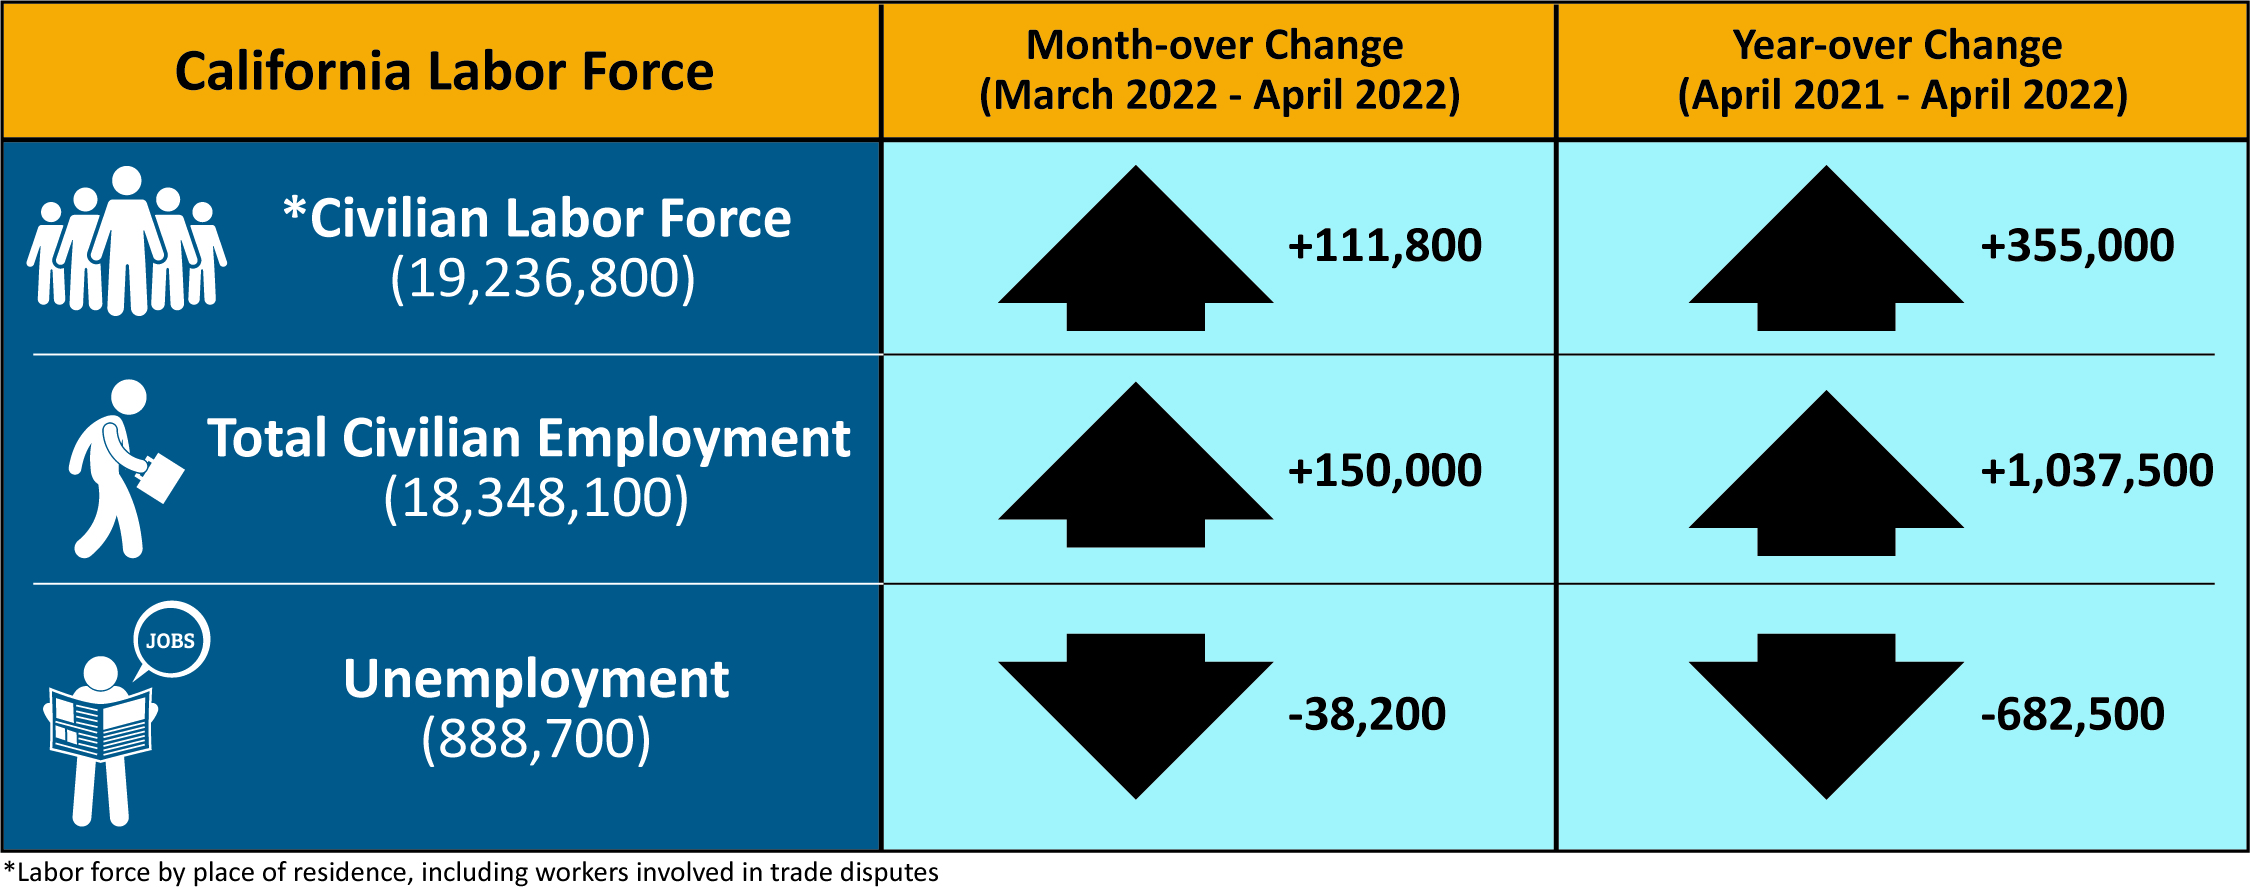
- Employed – The number of Californians employed in April was 18,348,100, an increase of 150,000 persons from March’s total of 18,198,100, and up 1,037,500 from the employment total in April 2021.
- Unemployed – The number of unemployed Californians was 888,700 in April, a decrease of 38,200 over the month and down 682,500 in comparison to April 2021.
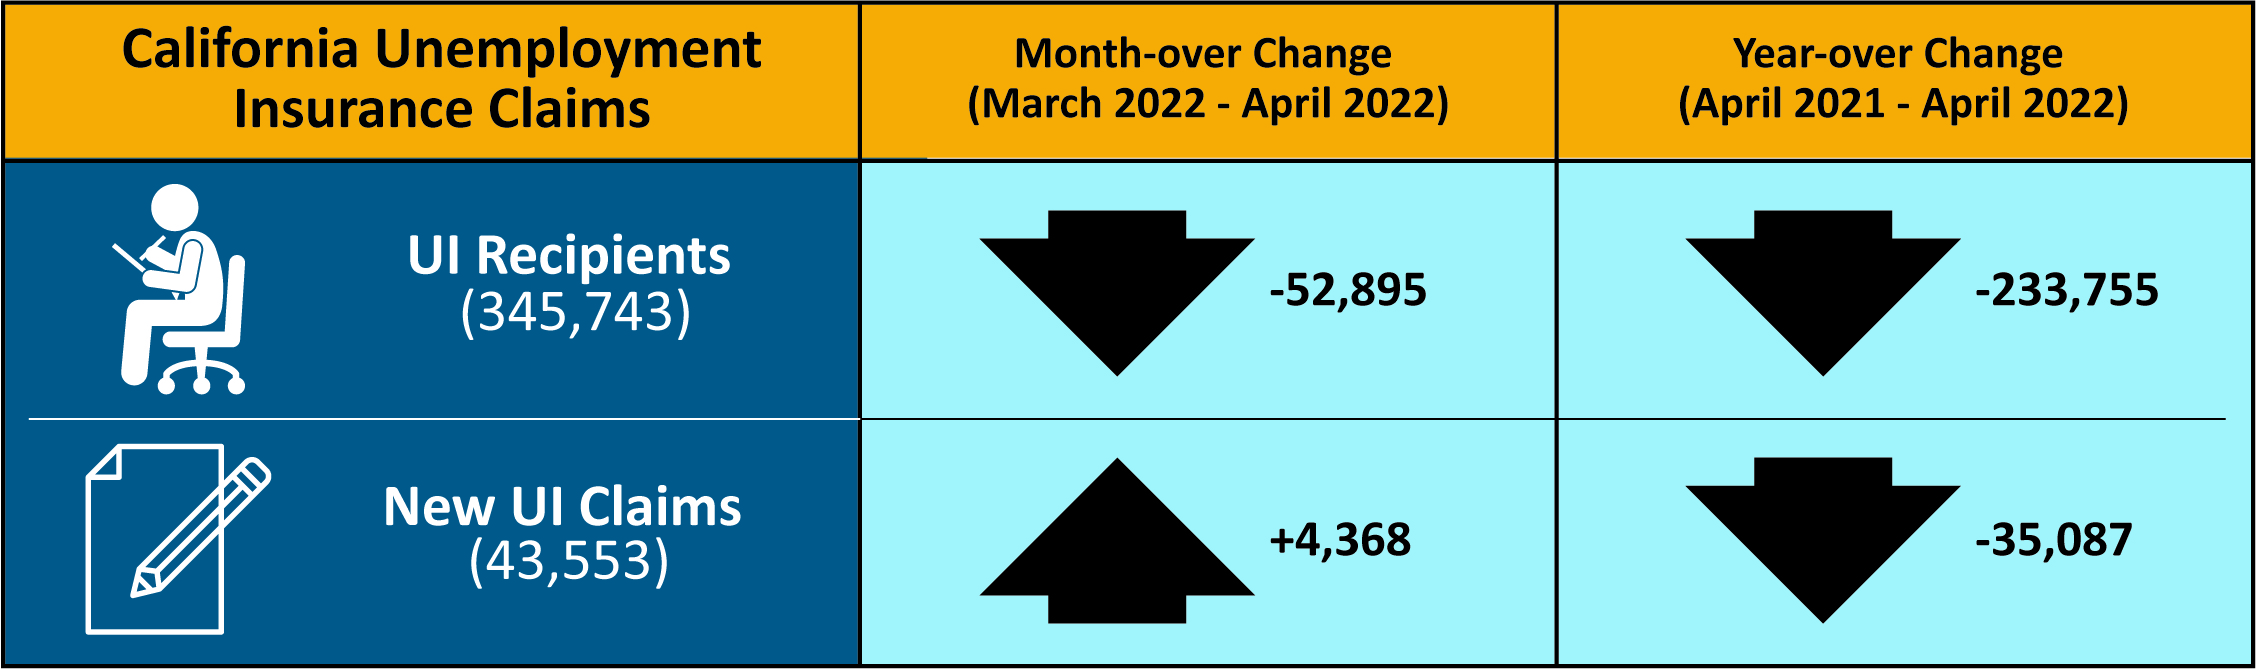
Unemployment Insurance Claims (Not Seasonally Adjusted)
The following data is from a sample week that includes the 19th of each month: In related data that figures into the state’s unemployment rate, there were 345,743 people certifying for Unemployment Insurance benefits during the April 2022 sample week. That compares to 398,638 people in March and 579,498 people in April 2021. Concurrently, 43,553 initial claims were processed in the April 2022 sample week, which was a month-over increase of 4,368 claims from March, but a year-over decrease of 35,078 claims from March 2021.
| COUNTY | LABOR FORCE | EMPLOYMENT | UNEMPLOYMENT | RATE |
|---|---|---|---|---|
| STATE TOTAL | 19,190,200 | 18,453,600 | 736,600 | 3.8% |
| ALAMEDA | 820,900 | 797,700 | 23,200 | 2.8% |
| ALPINE | 510 | 490 | 20 | 4.7% |
| AMADOR | 14,310 | 13,750 | 560 | 3.9% |
| BUTTE | 92,600 | 89,000 | 3,600 | 3.8% |
| CALAVERAS | 21,590 | 20,940 | 650 | 3.0% |
| COLUSA | 11,000 | 9,880 | 1,110 | 10.1% |
| CONTRA COSTA | 548,300 | 531,500 | 16,900 | 3.1% |
| DEL NORTE | 9,300 | 8,880 | 420 | 4.5% |
| EL DORADO | 92,600 | 90,000 | 2,600 | 2.8% |
| FRESNO | 453,300 | 425,900 | 27,400 | 6.0% |
| GLENN | 12,580 | 12,010 | 570 | 4.5% |
| HUMBOLDT | 59,400 | 57,500 | 1,900 | 3.3% |
| IMPERIAL | 67,600 | 59,700 | 7,900 | 11.7% |
| INYO | 8,160 | 7,900 | 260 | 3.1% |
| KERN | 382,900 | 356,900 | 26,000 | 6.8% |
| KINGS | 56,100 | 52,400 | 3,700 | 6.6% |
| LAKE | 28,410 | 27,150 | 1,270 | 4.5% |
| LASSEN | 8,890 | 8,580 | 310 | 3.5% |
| LOS ANGELES | 5,029,100 | 4,791,000 | 238,000 | 4.7% |
| MADERA | 62,200 | 58,600 | 3,600 | 5.7% |
| MARIN | 128,700 | 126,100 | 2,700 | 2.1% |
| MARIPOSA | 6,570 | 6,270 | 300 | 4.6% |
| MENDOCINO | 37,070 | 35,780 | 1,290 | 3.5% |
| MERCED | 115,500 | 107,100 | 8,500 | 7.3% |
| MODOC | 3,210 | 3,070 | 150 | 4.5% |
| MONO | 9,280 | 9,010 | 270 | 2.9% |
| MONTEREY | 215,100 | 202,600 | 12,400 | 5.8% |
| NAPA | 69,600 | 67,700 | 1,900 | 2.7% |
| NEVADA | 47,220 | 45,870 | 1,350 | 2.9% |
| ORANGE | 1,580,000 | 1,536,800 | 43,300 | 2.7% |
| PLACER | 192,300 | 187,600 | 4,600 | 2.4% |
| PLUMAS | 7,080 | 6,630 | 450 | 6.4% |
| RIVERSIDE | 1,151,300 | 1,108,000 | 43,300 | 3.8% |
| SACRAMENTO | 723,800 | 698,300 | 25,500 | 3.5% |
| SAN BENITO | 32,700 | 31,200 | 1,500 | 4.6% |
| SAN BERNARDINO | 1,008,200 | 969,900 | 38,300 | 3.8% |
| SAN DIEGO | 1,575,100 | 1,527,500 | 47,600 | 3.0% |
| SAN FRANCISCO | 567,400 | 555,100 | 12,300 | 2.2% |
| SAN JOAQUIN | 333,500 | 316,700 | 16,800 | 5.0% |
| SAN LUIS OBISPO | 136,600 | 133,300 | 3,300 | 2.4% |
| SAN MATEO | 448,600 | 439,900 | 8,700 | 1.9% |
| SANTA BARBARA | 222,600 | 216,300 | 6,300 | 2.8% |
| SANTA CLARA | 1,040,100 | 1,018,300 | 21,800 | 2.1% |
| SANTA CRUZ | 133,600 | 127,600 | 6,100 | 4.5% |
| SHASTA | 73,400 | 70,500 | 2,900 | 3.9% |
| SIERRA | 1,300 | 1,250 | 50 | 3.9% |
| SISKIYOU | 16,080 | 15,240 | 840 | 5.2% |
| SOLANO | 199,400 | 191,400 | 8,000 | 4.0% |
| SONOMA | 245,800 | 239,400 | 6,400 | 2.6% |
| STANISLAUS | 239,800 | 227,500 | 12,200 | 5.1% |
| SUTTER | 45,700 | 42,800 | 2,800 | 6.2% |
| TEHAMA | 25,120 | 24,060 | 1,060 | 4.2% |
| TRINITY | 4,300 | 4,130 | 170 | 3.9% |
| TULARE | 205,200 | 190,100 | 15,100 | 7.4% |
| TUOLUMNE | 19,840 | 19,050 | 790 | 4.0% |
| VENTURA | 409,600 | 397,100 | 12,500 | 3.0% |
| YOLO | 108,800 | 105,300 | 3,500 | 3.2% |
| YUBA | 31,100 | 29,500 | 1,600 | 5.0% |
Source: EDD
