


California and National Drought Summary for June 7, 2022
Summary
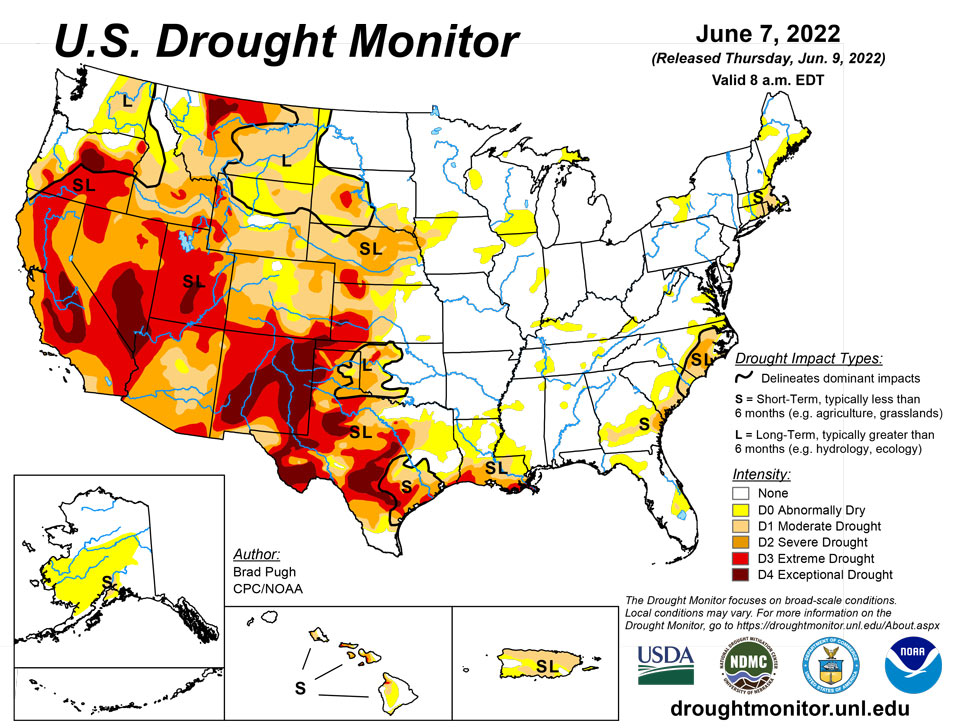
June 9, 2022 - A slow-moving cold front resulted in thunderstorms with heavy rainfall (locally more than 3 inches) across the central to southern Great Plains, lower Mississippi Valley, and the Ozarks Region from May 31 to June 2. As this front progressed eastward, locally heavy rain also fell across the Ohio Valley and Northeast. Mid-level low pressure, which has persisted over the northeastern Pacific through much of the spring, continued to enhance onshore flow and precipitation from the Pacific Northwest eastward to the northern Rockies. 7-day precipitation amounts from May 31 to June 6 exceeded 0.5 inches (locally 2 inches or more) over a broad spatial area of Oregon, Washington, Idaho, Montana, and northern Wyoming. After Hurricane Agatha made landfall on the southern coast of Mexico, its remnant low pressure system tracked northeast to the Yucatan Peninsula and reemerged over the southern Gulf of Mexico. This low pressure system, which became Tropical Storm Alex, brought more than 5 inches of rainfall to southern Florida and triggered flooding in Miami. Seasonal dryness prevailed across southern California and the Desert Southwest. 7-day temperatures, from May 31 to June 6, averaged above-normal across much of the eastern and southern tier of the U.S., while cooler-than-normal temperatures prevailed throughout the northern to central Great Plains and upper Mississippi Valley. Mostly dry weather was accompanied by above-normal temperatures across Alaska during late May into the beginning of June. Trade wind showers brought beneficial wetness to the Big Island of Hawaii. Short-term precipitation deficits continue to increase across Puerto Rico, following another drier-than-normal week.
Northeast
The long-term moderate drought (D1) across western Maine was eliminated this week, due to recent precipitation, and consistent with SPI at multiple time scales dating back to 9 months. The D0 along coastal Maine was expanded westward based on 30 to 60-day SPI, soil moisture, and USGS 28-day average streamflows. Likewise, D0 was increased westward to include more of Connecticut and western Massachusetts where 30 to 60-day precipitation deficits continue to increase after another mostly dry week. Excluding northern Maine and northwestern New York, precipitation has averaged below-normal during the past 30 days.
Southeast
Although the heaviest rainfall, associated with Tropical Storm Alex, occurred south of the moderate short-term moderate drought (D1) area, enough rainfall (more than 1.5 inches) justified a removal of most of the D1. However, a small D1 area was maintained to the northwest of Lake Okeechobee that received less than 2 inches of rainfall this past week and lingering impacts from this past spring’s dryness. Recent dryness and higher evapotranspiration rates prompted an expansion of abnormal dryness (D0) across the Big Bend of Florida. Long-term indicators support a continuation of the ongoing drought depiction along coastal South Carolina. Based on 30 to 60-day SPIs and soil moisture, abnormal dryness was expanded to cover more of the Coastal Plain of South Carolina. Another dry week for the Coastal Plain of North Carolina prompted a slight westward expansion of Dx categories. A slight increase in D0 and D1 was warranted for southwest Georgia, following a mostly dry week and 7-day temperatures averaging slightly above normal. Although D0 was not introduced this week to northern or central Georgia, these areas will be closely monitored in subsequent weeks as short-term drought could rapidly develop.
South
Heavy rainfall (1.5 to 3 inches, locally more) resulted in a 1-category improvement to west-central OK and northwestern TX, setting up a tight west to east gradient in Dx categories. In areas such as Custer County in western Oklahoma, that locally received as much as 8 inches of rainfall during the past week, a 2-category improvement was justified. This heavy rainfall extended southward into southeastern New Mexico and western Texas where parts of the Permian Basin, Davis Mountains, and Big Bend received more than 2 inches at the beginning of June. Farther to the east across parts of central and eastern Texas, along with northwestern Louisiana, increasing short-term precipitation deficits (2 to 4 inches), above-normal temperatures, and higher evapotranspiration rates resulted in a 1-category degradation. This expansion of abnormal dryness (D0) was supported by 30 to 60-day SPEI and these areas stand out on the EDDI product for flash drought. Eastern Texas and northern Louisiana will have to be closely monitored in subsequent weeks as short-term drought could rapidly develop. Locally heavy rain (more than 1 inch) this past week resulted in a slight decrease in D0 for northeastern Louisiana. On June 6, heavy rainfall extended south of the Ohio River which led to a general decrease in the small areas of D0 in Tennessee.
Midwest
Recent heavy rainfall on June 6 resulted in a decrease in abnormal dryness (D0) across Indiana, Kentucky, and southeastern Illinois. However, east-central Illinois missed out on this rainfall and 30 to 60-day SPIs along with soil moisture from NASA SPoRT support the introduction of D0 to that part of Illinois. 30-day deficits of more than 2 inches exist across parts of central to southern Illinois and southeastern Iowa. The lack of anomalous warmth through the beginning of June has limited evapotranspiration rates and significant drying of topsoil.
High Plains
Heavy rainfall (1.5 to 3 inches, locally more) this past week resulted in a 1-category improvement to southeastern and central Kansas. More than 1.5 inches of rainfall this past week, along with soil moisture and long-term SPIs, supported a change from exceptional (D4) to extreme (D3) drought in parts of southwestern Kansas and adjacent southeastern Colorado. Widespread beneficial rainfall, exceeding 1 inch, this past week prompted a 1-class improvement to much of eastern Colorado. Swaths of heavy rainfall (more than 1 inch) also led to improvements of various Dx categories across parts of Nebraska and South Dakota. Much above-normal precipitation during the past 30 to 90 days and soil moisture percentiles supported the elimination of moderate drought (D1) across much of west-central Wyoming.
West
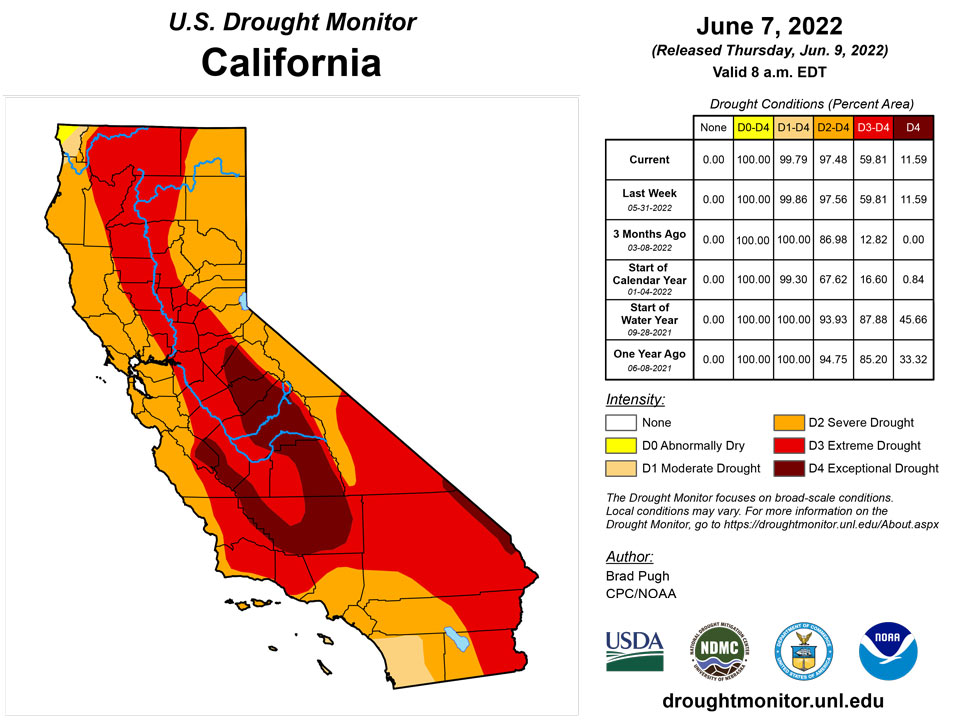
The wet late spring continues to support improving conditions from the Pacific Northwest eastward to the Northern Rockies. Based on multiple indicators including springtime precipitation, soil moisture, and streamflow, a broad 1-class improvement was made to eastern Washington with improving conditions also supported for parts of Oregon. The recent precipitation was enough to shift the long-term SPEIs out of exceptional (D4) drought in much of Klamath and Lake Counties of Oregon. In western Idaho, severe drought (D2) was improved to moderate drought (D1) based in part on the hydrologic response in the Weiser Basin. Southwestern Montana had a 1-class improvement, following recent wetness, soil moisture recharge, and 60-day SPI. Precipitation amounts of 1 to 3 inches along with below-average temperatures resulted in a 1-category improvement to parts of north-central Montana. Despite the recent cool pattern, 90 to 180-day SPIs supported 1-category degradation to parts of northern Montana. Impacts in this worsening drought area include required supplemental feeding, very dry soils, and dry stock ponds. Based on 90-day SPI and hydrology considerations in the Sevier River basin, extreme (D3) to exceptional (D4) drought was expanded across parts of Utah. Widespread severe to exceptional drought persists throughout much of the Southwest, Great Basin, and California. Hydropower production concerns at reservoirs in California and Nevada continue due to low water levels.
Caribbean
Increasing 30 to 60-day precipitation deficits, along with support from 28-day streamflows, resulted in a widespread 1-category degradation throughout much of Puerto Rico.
St. John, St. Croix, and St. Thomas all reported no measurable rainfall for the first week of June as drought continued to intensify. The classification for St. Croix is unchanged from last week (D3, extreme drought) while St. John and St. Thomas both deteriorated to D2 (severe dryness). Dryness has been particularly acute since the start of May. St. John’s received only 0.45 inch for May and the first week of June while St. Thomas reported 0.88 inch (2.63 inches below normal, 25 percent) and St. Croix 0.35 inch (3.7 inches below normal, 9 percent). St. John and St. Thomas have a less severe drought designation primarily due to March-April rainfall. During the 2-month period, St. Thomas recorded 5.19 inches of rain (1.09 inches above normal) wile St. Croix received only 1.38 inches (2.46 inches below normal). This followed near- to above-normal January-February rainfall. From March through the first week of June, St. Croix received a total of only 1.73 inches of rain where 7.89 inches would typically fall (22 percent)
Pacific
Due to low precipitation amounts since the winter snowpack meltout and periods of above-normal temperatures since late May, a large increase in abnormal dryness (D0) necessary for Mainland Alaska and a substantial D1 expansion may be needed next week. Fire weather indices were also considered in the large D0 expansion. From May 27 to June 5, maximum temperatures were 70F or higher at Anchorage.
Trade wind showers continued throughout much of the Hawaiian Islands with the heaviest rainfall this past week occurring along the Big Island’s westward slopes. Therefore, a general 1-category improvement was made to most of the Big Island. Slight improvements were also made for parts of Maui due to recent rainfall. Persistent dryness across eastern Oahu prompted degradation from abnormal dryness (D0) to moderate drought (D1).
Significant dryness is affecting the northern, eastern, and southern periphery of the U.S. Affiliated Islands in the Northern Hemisphere. Drought is intensifying again at Kapingamarangi in southern Micronesia, deteriorating to D2 (severe drought) after another dry week. Drought has frequently impacted Kapingamarangi since late 2019. In contrast, heavy rain fell on the eastern Marshall Islands, prompting continued improvement to lingering dryness there. Wotje improved to D0 this week (abnormal dryness), so they are no longer considered to be in drought. Farther north, dryness continues to impact the Marianas Islands, dryness intensity (D0) is unchanged from last week.
In general, rainfall was heaviest in parts of eastern Micronesia and the Marshall Islands last week. Pohnpei, Wotje, and Mili were particularly wet, reporting 4.0 to 6.2 inches of rain. Light to moderate rains fell farther west from Palau eastward through central Micronesia. Most sites in Micronesia reported suboptimal rainfall amounts this week, but enough rain fell in prior weeks to hold off any abnormal dryness (D0) at this time. during the past several weeks have been sufficient to hold off abnormal dryness (D0) for now. Little, if any, rain was reported across the Marianas (where D0 conditions prevail) and Kapingamarangi (where drought intensified to D2 this week). Rainfall was also unusually light in Pago Pago, but recent rains have been sufficient to stave off abnormal dryness (D0) for the time being.
Palau (Koror) has not been impacted by dryness recently, and that trend looks to continue. Although Koror reported only 1.79 inches last week, 15 of the prior 17 weeks were wetter than normal and well over the amount needed for water supply to keep pace with demand. From late April through May, Koror averaged 5.73 inches per week, recording nearly 34.4 inches of rain compared to a normal of 16.05 inches. Longer-term statistics are no less impressive, with Koror averaging over 3.9 inches per week from early February to the end of May.
In western Micronesia, Yap was on the cusp of abnormal dryness (D0) before substantial rains fell last week. It was extremely dry for much of May, with a 3-week total of only 0.66 inch when over 5.75 inches was typical. But rain increased the past two weeks, near the suboptimal weekly threshold of 2 inches in late May, and 2.75 inches the first week of June.
Meanwhile, Ulithi and Woleai have been similar to each other for the past several months. Both reported unusually light rain this week, but enough rain has fallen during the past several weeks to preclude abnormal dryness (D0). Between 0.3 and 0.4 inch fell last week, or less than 15 percent of normal. But during prior weeks, rainfall has generally been unremarkable for several months, with alternating short periods of suboptimum rainfall interspersed with short periods of heavy rain. Prior to this dry week, Woleai recorded over 47 inches of rain from early March through the end of May, or an average of over 3.6 inches per week, which is more than sufficient to meet demand. Ulithi was abnormally wet from early April through early May, averaging more than 4.6 inches of rain per week while the normal was below 1.1 inches per week. Alternating wet and dry weeks have been reported there since early May.
At Chuuk, rainfall increased substantially following a dry February. The lagoon experienced the 8th wettest May in 71 years on record, the 5th wettest 2-month April-May period. Only 1.57 inches fell the first week of June, but with the prior 2 months averaging over 4.2 inches per week, abnormal dryness is not an immediate concern.
Precipitation has been unfavorably light since mid-May at Lukinoch. Only 3.91 inches fell during the last 4 weeks, when 11.5 inches would be typical. Three of those weeks, amounts were less than half of the threshold where water is sufficient to keep up with demand. But given a lack of impacts and a few months of sufficient to surplus rainfall, abnormal dryness (D0) has not been introduced at this time, but may be needed if the next few weeks don’t bring heavy precipitation.
This was the third successive week with below-normal rainfall at Nukuoro. This week was the driest since mid-February, but each of the prior 15 weeks exceeded the amount needed for water supply to keep up with demand, even though a few of those weeks were drier than normal.
Of all the U.S. Affiliated Pacific Islands, Kapingamarangi is enduring the most intense drought conditions, which has been the case several times in the past 3 years. February through mid-March brought sufficient rains of about 3.3 inches per week, but rainfall dropped markedly in mid-March, and with 2 exceptions, each week since has been considerably drier than normal and well below the threshold where water supply keeps up with demand.
Kapingamarangi weekly rainfall totals have averaged less than an inch for the last 13 weeks, and no rain fell during 4 of the past 5 weeks, including last week. Since early May, a total of only 0.8 inch has fallen when over 13.5 inches would be normal. Three inches of rain fell the first week of April, and 4.21 inches pelted Kapingamarangi near the cusp of April and May. The other 11 weeks since mid-March would normally bring almost 30 inches of rain, but less than 5.7 inches have fallen this year (or a normal weekly average of 2.7 inches, and an observed weekly average of 0.5 inch).
This year, rainfall for the 3-month March-May period, the 2-month April-May period, and the month of May were each the driest on record (28 years). Looking at longer-term rainfall, the statistics are only marginally better. January-May was the 2nd driest such period on record, as was the August 2021 – May 2022 10-month period. Of the 1-month to 12-month periods ending with May, the wettest statistically was December 2021 – May 2022, which ranked 4th driest in 25 years of record.
Drought has waxed and waned In Kapingamarangi since December 2019, with moisture deficits never quite recovering fully between dry spells. For the entire December 2019 through May 2022 period (30 months), Kapingamarangi is almost 100 inches of rain short of normal. Monthly totals have average 7.46 inches while 10.71 inches per month would normally fall.
In eastern Micronesia, Pingelap has been drier than normal for the past 5 weeks. Since early May, weekly rainfall totals averaged 1.44 inches (7.22 total) while the normal weekly average is almost 3 inches. But D0 (abnormal dryness) is not introduced this week because of the past 5 subnormal weeks, only 3 were under the amount necessary for water supply to keep up with demand. In addition, the prior 7 weeks were very wet. From late March through early May, an average of 6 inches of rain fell each week, when normally the weekly average is 2.88 inches.
From mid-April through early June, rainfall totals have alternated between somewhat above normal and somewhat below normal, precluding the introduction of abnormal dryness (D0) despite the 2nd-driest week since late February. Also, the 6 weeks before mid-April were very wet. Rainfall averaged over 10 inches per week, when normally an average of 4.46 inches would fall each week. The wet climatology here means the threshold for water supply to keep up with demand (over 2 inches) is met when weekly amounts are above half of normal.
Pohnpei has been inundated with heavier than normal precipitation since at least early February. Only 1 of the past 18 weeks was drier than normal, and even then, rainfall totals exceeded the optimum threshold by 50 percent. Since early February, weekly rainfall totals have averaged almost 5.7 inches while the normal is about 3.5 inches. The 5 months from January-May were the 2nd wettest in 71 years of records.
The drought over the eastern Marshall Islands has eased with the onset of heavy rains about 3 weeks ago. The western sites (Kwajalein, Ailinglapalap, and Jaluit) had been on the brink of abnormal dryness (D0) until early to mid-May, when rainfall increased and has been above normal. To the east, Majuro is near abnormal dryness (D0) with subnormal rainfall reported 5 of the last 6 weeks. But the last week of May significantly topped the threshold for optimum hydrologic conditions (where supply keeps up with demand) by 50 percent (3.15 inches), and the first week of June barely missed that mark (1.97 inches), keeping abnormal dryness (D0) at bay by a small margin.
The last vestige of impactful dryness in the Marshalls is at Wotje, where conditions have been slowly improving for several weeks. Conditions improved to D0 this week following a third consecutive week of above-normal rainfall. February through early March had been exceptionally dry, with rainfall averaging a mere 0.01 inch per week, with a weekly normal of just under 0.5 inch.
Mili in the southeastern Marshalls are not concerned about dryness at this time, with 15 straight weeks of above-normal rainfall that was also more than the optimum threshold of 2 inches per week. For almost 4 months, weekly rainfall has averaged 4.88 inches, compared to a normal of 2.16 inches. The top weekly total was 12.32 inches April 6-12. Mili experienced the 4th wettest May in 38 years of record, and each of the 2-month to 12-month totals ending May 2022 were the wettest on record.
All locations in the Marianas are classified as abnormally dry (D0), unchanged from last week. Following a slight uptick in rainfall the last week of May, conditions dried out and only a few hundredths of an inch of rain fell on each location the first week of June. Over the past 6 weeks, Guam recorded less than half of normal rainfall (3.39 inches; normal 7.34), as did Rota (2.46 inches; normal 5.74). Saipan fared slightly better relative to the normal, but not much (2.46 inches; normal 5.74 inches). Deterioration may be introduced soon if rainfall totals don’t increase.
Weekly rainfall totals have been highly variable in Pago Pago since the start of February. Between 1 and 3 weeks of surplus rainfall would alternate with several-week periods of deficient totals. The past 2 weeks have dried out again following a generally wet 4-week period. The last week of May and the first week of June brought 0.96 inch and 0.42 inch, respectively (1.38 inches total). Normal rainfall for these 2 weeks is 3.77 inches. The potential for developing abnormal dryness (D0) will be monitored as American Samoa moves into a relatively dry time of year.
Looking Ahead
A couple of low pressure systems and trailing cold fronts are forecast to bring widespread, heavy rainfall to the Northeast and Mid-Atlantic through June 11. Along a nearly stationary front, a swath of heavy rainfall is forecast to spread southeastward from the Ozarks Region to the northern Gulf Coast on June 9 and 10. The wet pattern is likely to continue from the Pacific Northwest eastward to the northern Rockies and northern Great Plains through June 13, as another low pressure system emerges from the northeastern Pacific. Meanwhile, a heat wave is forecast to expand from California and the Desert Southwest eastward to the south-central U.S. during mid-June.
The Climate Prediction Center’s 6-10 day outlook (valid June 14-18, 2022) depicts large probabilities (more than 70 percent) for above-normal temperatures across the southern Great Plains, lower Mississippi Valley, and Southeast. Below-normal temperatures are favored to persist across the Pacific Northwest. Below-normal precipitation is favored for the central to southern Great Plains, middle to lower Mississippi Valley, and much of the Corn Belt. Probabilities for above-normal precipitation are elevated across the Pacific Northwest along with parts of the Southwest.
Author(s):
Brad Pugh, NOAA/CPC
Richard Tinker, NOAA/NWS/NCEP/CPC
Dryness Categories
D0 Abnormally Dry—used for areas showing dryness but not yet in drought, or for areas recovering from drought.
Drought Intensity Categories
D1 Moderate Drought
D2 Severe Drought
D3 Extreme Drought
D4 Exceptional Drought
Drought or Dryness Types
S Short-term, typically less than 6 months (agriculture, grasslands)
L Long-term, typically more than 6 months (hydrology, ecology)
SL Area contains both short- and long-term impacts
Source: National Drought Mitigation Center
