


IMPORTANT NOTE: The employment data for the month of May 2022 is taken from the survey week including May 12th. Data for the month of June is scheduled for release on July 22, 2022.
Employers added 42,900 nonfarm payroll jobs
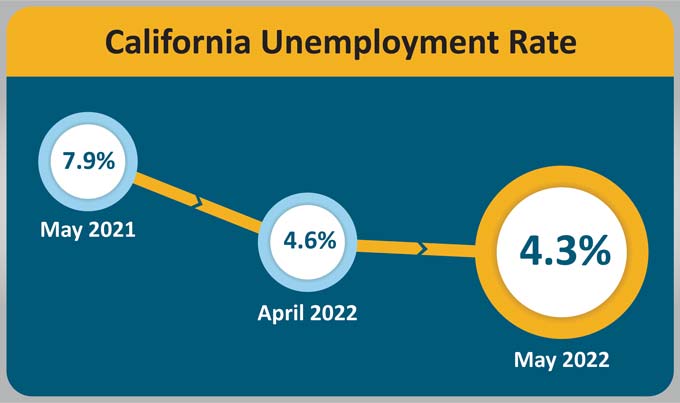
June 17, 2022 - SACRAMENTO – California’s unemployment rate went down for the month of May 2022 to 4.3 percent1 as the state’s employers added 42,900 nonfarm payroll jobs2 to the economy, according to data released today by the California Employment Development Department (EDD) from two surveys. The state’s rate is now just 0.2 percentage point higher than the pre-pandemic unemployment rate of 4.1 percent in February 2020.
California’s Labor Market, by the Numbers...
- California has now regained 93 percent (2,565,100) of the 2,758,900 nonfarm jobs lost during March and April of 2020 due to the COVID-19 pandemic.
- Of the 390,000 U.S. nonfarm jobs gained in May, California accounted for 11 percent of them.
- At 869,300 jobs, California had the largest absolute year-over seasonally-adjusted job increase in the nation in May 2022.
- California has enjoyed month-over gains in nonfarm jobs in 15 of the past 16 months totaling a 1,481,800 job gain over that time period.
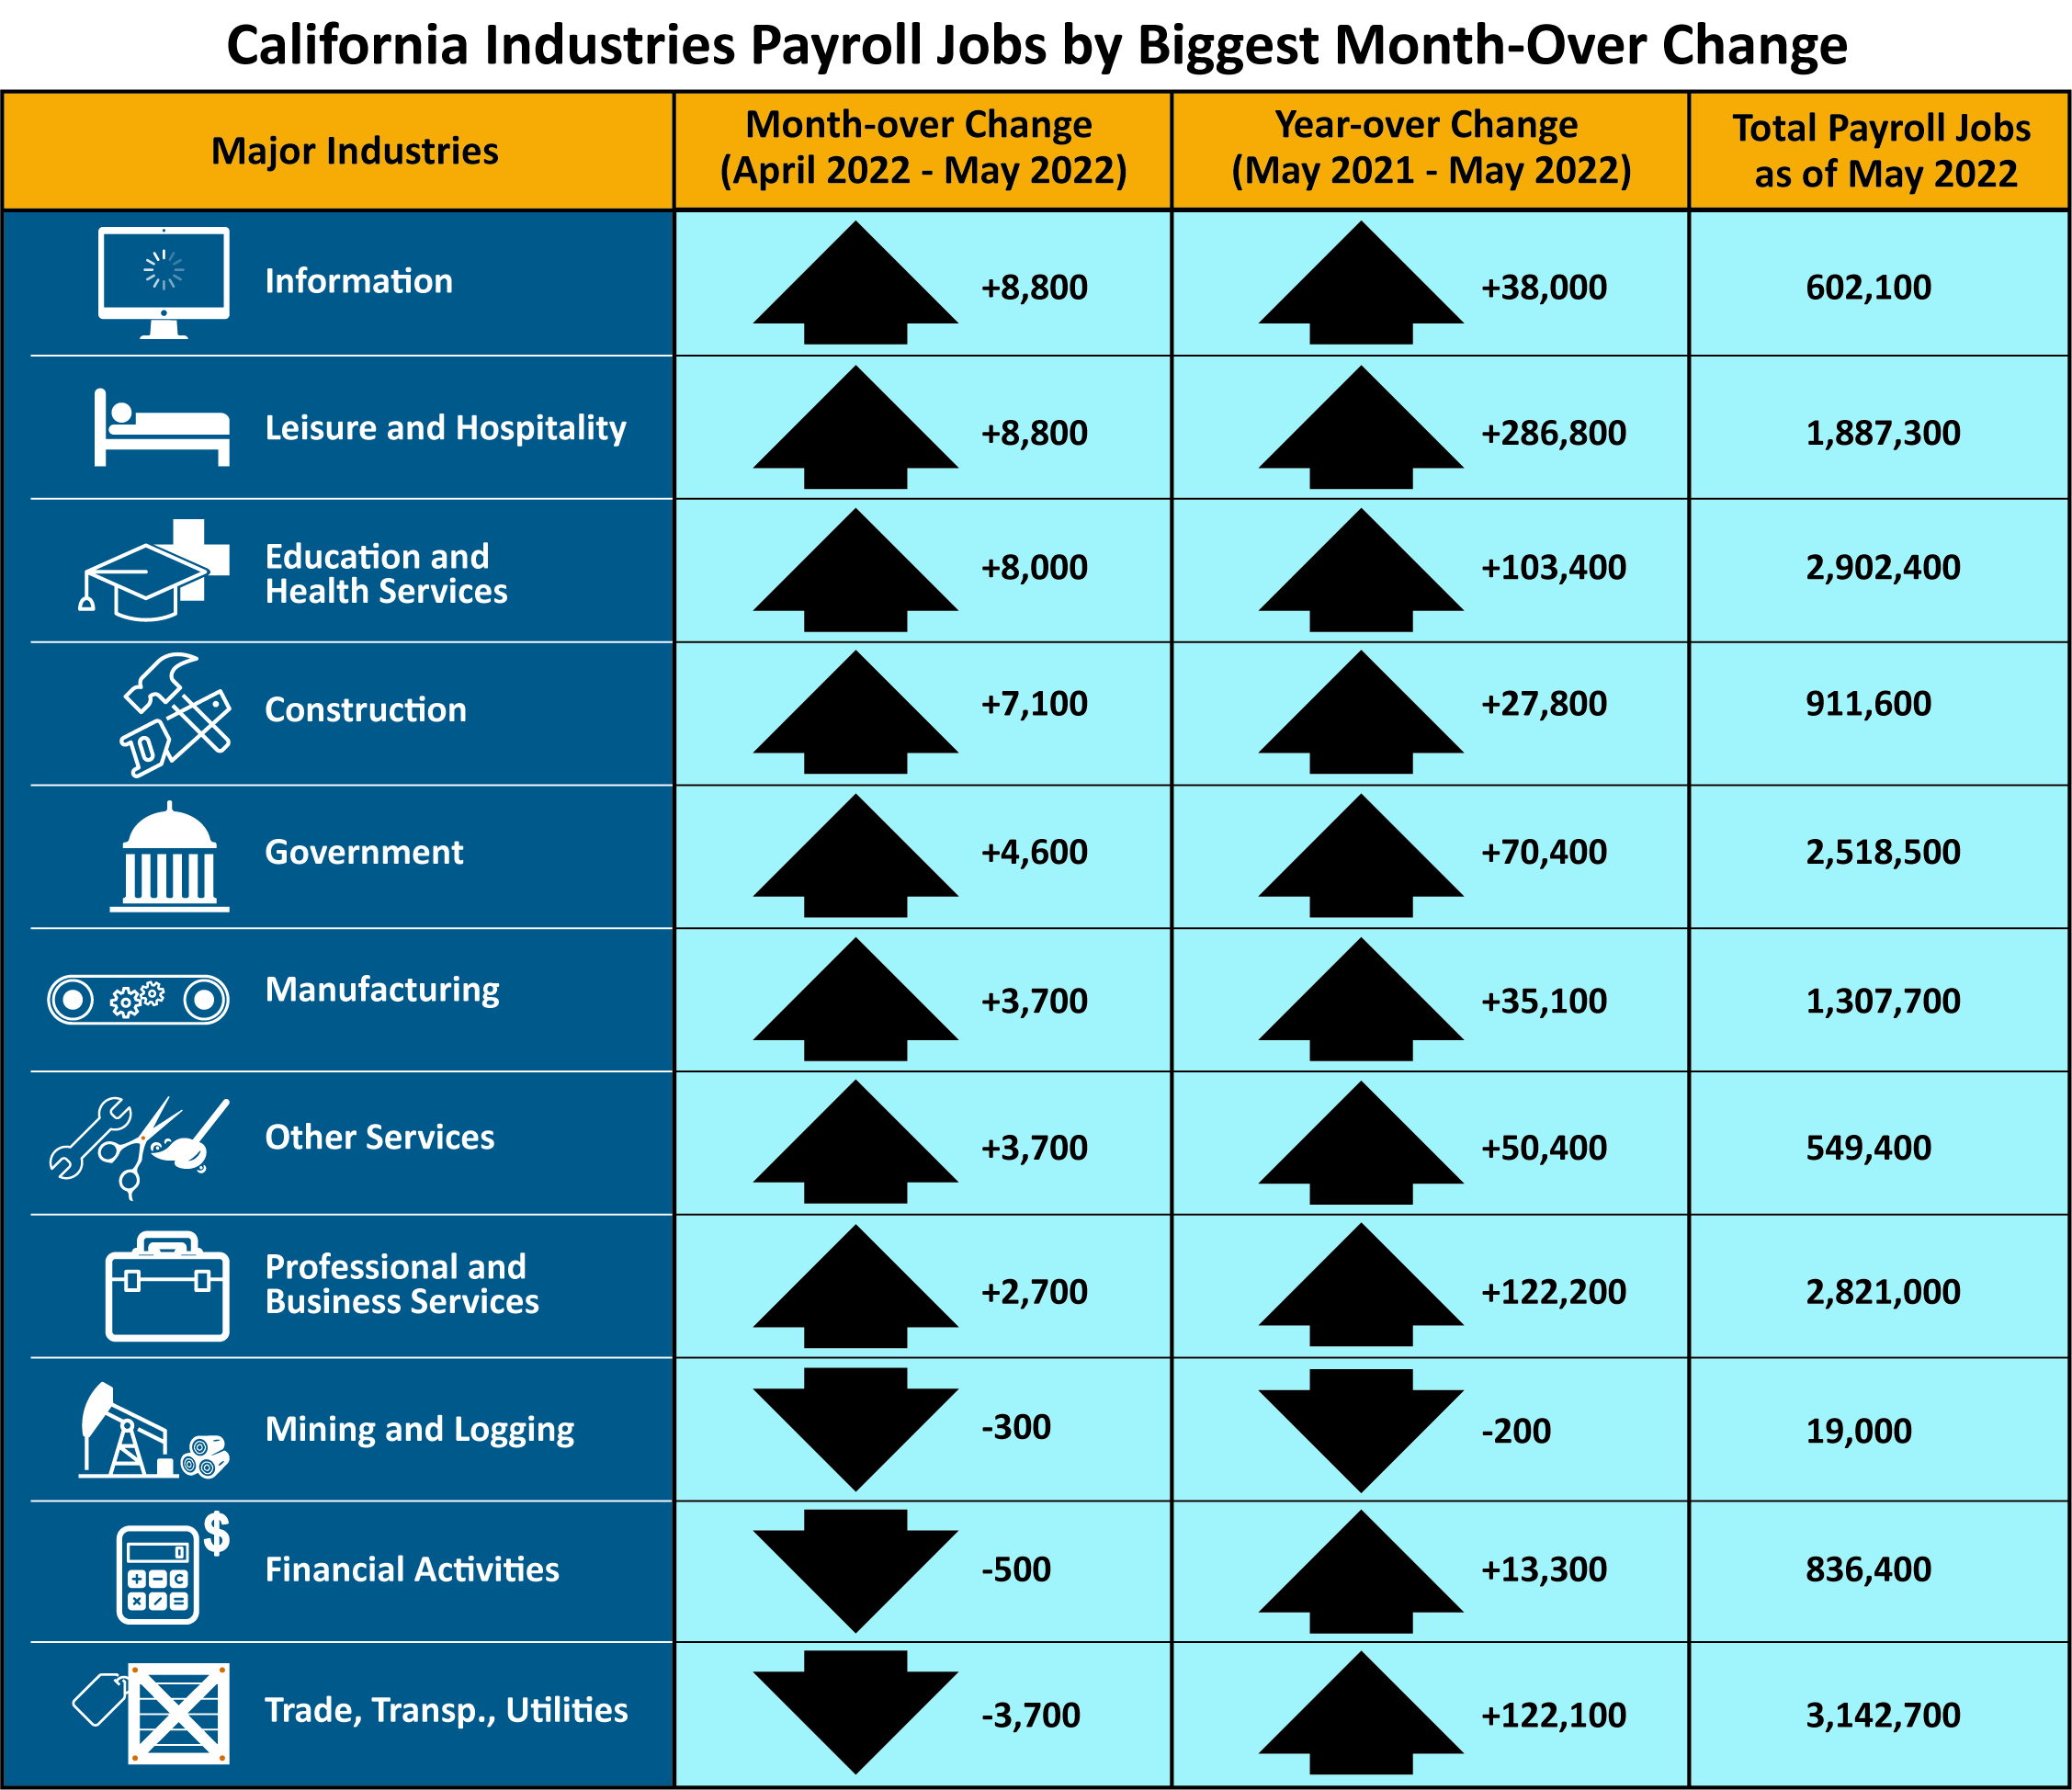
- Eight of California’s 11 industry sectors gained jobs in May with Information (+8,800) posting the largest increase. The sector’s growth was due in part to increases in the Motion Picture and Sound Recording industries.
- Leisure & Hospitality (+8,800), which suffered some of the largest losses in the pandemic, showed strong growth yet again and has now gained 816,900 jobs since April 2020 after losing nearly one million jobs due to the COVID-19 pandemic.
- Trade, Transportation, and Utilities suffered the largest month-over job loss (-3,700) due to reductions in Retail Trade (specifically General Merchandise Stores).
1. The unemployment rate comes from a separate federal survey of 5,100 California households.
2. The nonfarm payroll job numbers come from a federal survey of 80,000 California businesses.
Data Trends about Jobs in the Economy
Total Nonfarm Payroll Jobs
This comes from a monthly survey of approximately 80,000 California businesses that estimates jobs in the economy – seasonally adjusted.
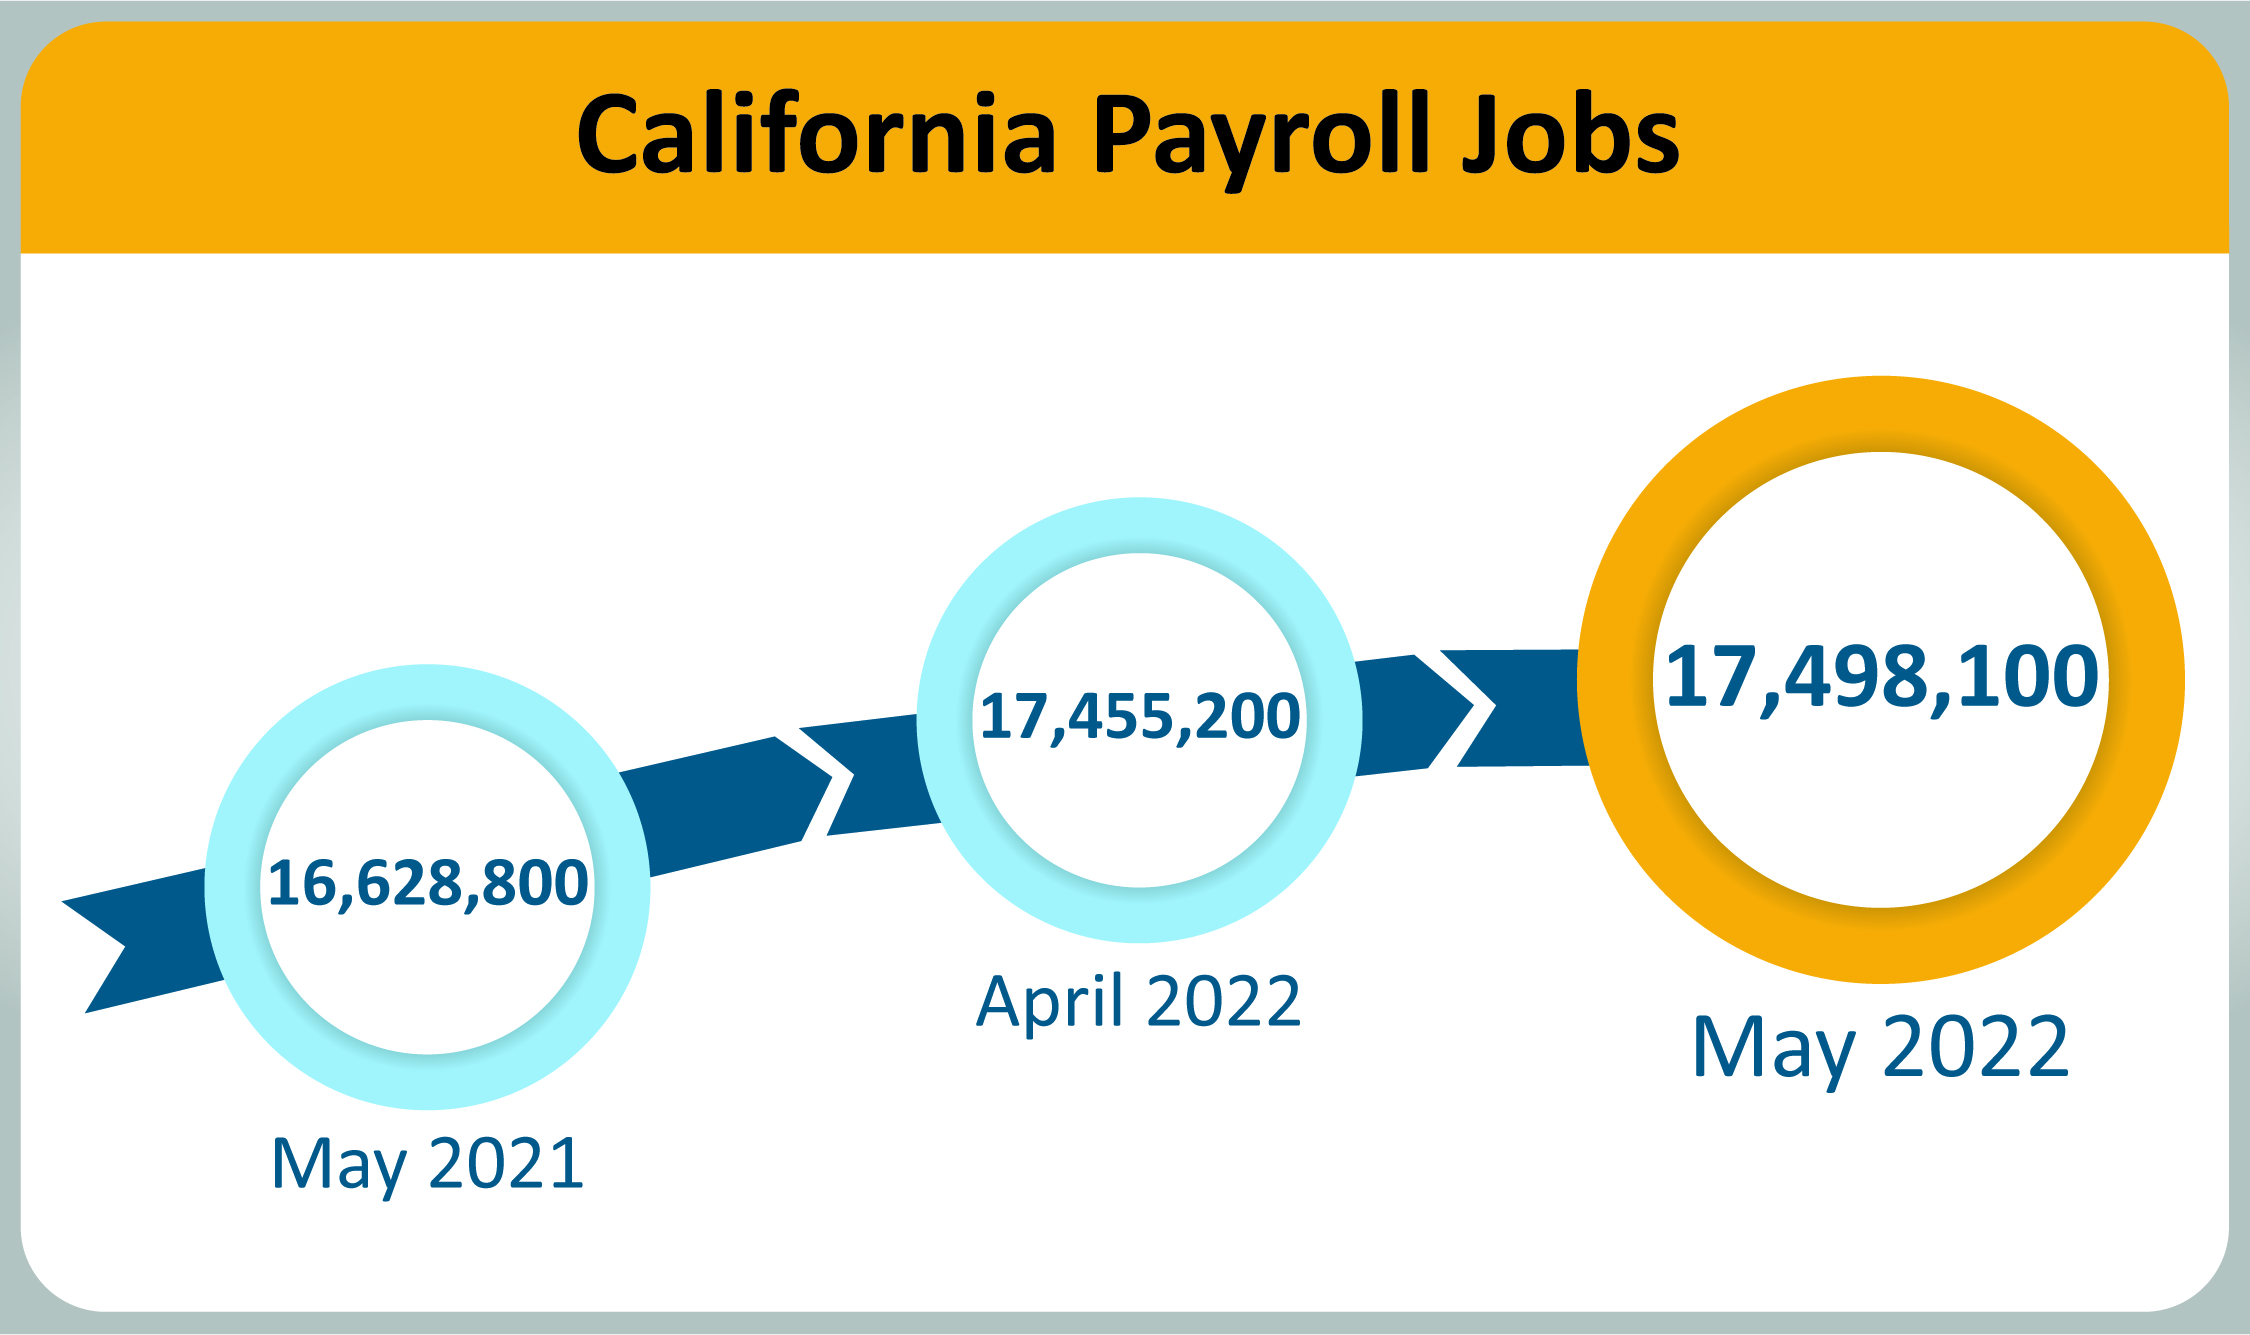
- Month-over – Total nonfarm jobs in California’s 11 major industries totaled 17,498,100 in May – a net gain of 42,900 jobs from April. This followed an upwards revised (+3,200) month-over gain of 44,600 jobs in April.
- Year-over – Total nonfarm jobs increased by 869,300 (a 5.2 percent increase) from May 2021 to May 2022 compared to the U.S. annual gain of 6,541,000 jobs (a 4.5 percent increase).
Total Farm jobs – The number of jobs in the agriculture industry increased from April by 6,300 to total 420,200 jobs in May. The agricultural industry had 17,300 more farm jobs in May 2022 than it did in May a year ago.
Data Trends about Workers in the Economy
Employment and Unemployment in California
This information is based on a monthly federal survey of 5,100 California households which focuses on workers in the economy.
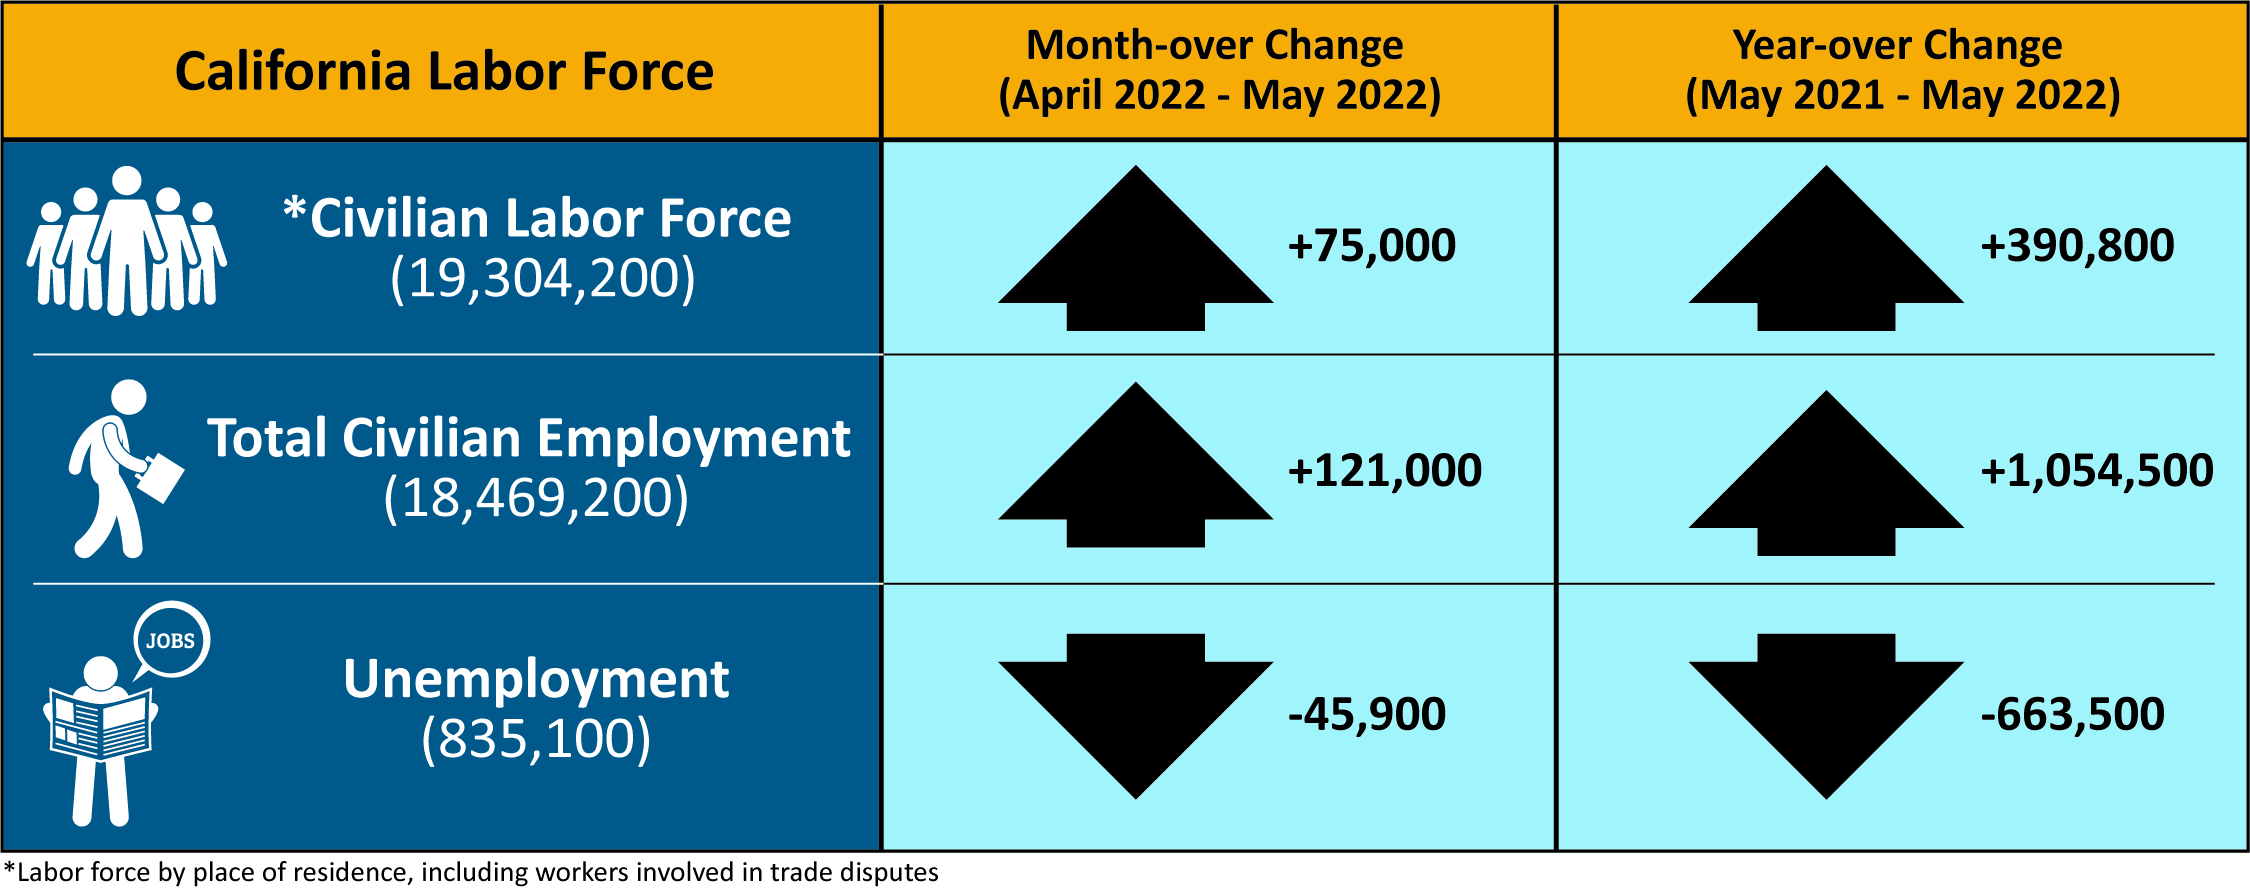
- Employed – The number of Californians employed in May was 18,469,200, an increase of 121,000 persons from April’s total of 18,348,200 and up 1,054,500 from the employment total in May 2021.
- Unemployed – The number of unemployed Californians was 835,100 in May, a decrease of 45,900 over the month and down 663,500 in comparison to May 2021.
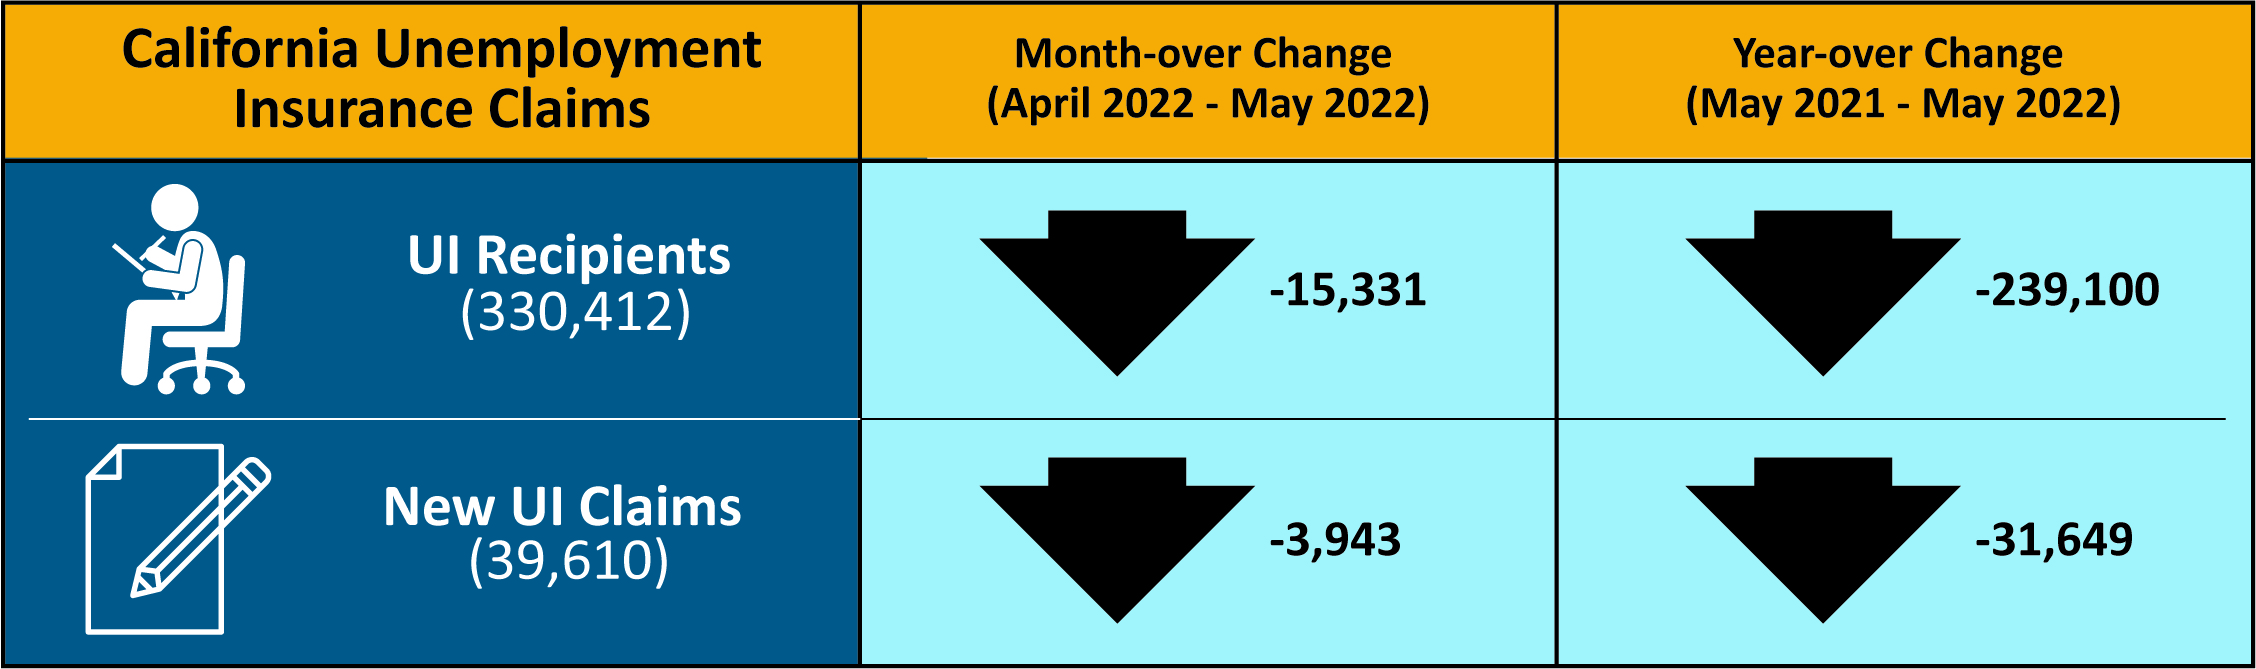
Unemployment Insurance Claims (Not Seasonally Adjusted)
The following data is from a sample week that includes the 19th of each month: In related data that figures into the state’s unemployment rate, there were 330,412 people certifying for Unemployment Insurance benefits during the May 2022 sample week. That compares to 345,743 people in April and 569,512 people in May 2021. Concurrently, 39,610 initial claims were processed in the May 2022 sample week, which was a month-over decrease of 3,943 claims from April and a year-over decrease of 31,649 claims from April 2021.
| COUNTY | LABOR FORCE | EMPLOYMENT | UNEMPLOYMENT | RATE |
|---|---|---|---|---|
| STATE TOTAL | 19,191,200 | 18,530,500 | 660,700 | 3.4% |
| ALAMEDA | 822,500 | 802,000 | 20,500 | 2.5% |
| ALPINE | 440 | 420 | 20 | 5.2% |
| AMADOR | 14,450 | 13,960 | 480 | 3.3% |
| BUTTE | 92,600 | 89,500 | 3,100 | 3.4% |
| CALAVERAS | 21,680 | 21,100 | 580 | 2.7% |
| COLUSA | 11,130 | 10,180 | 940 | 8.5% |
| CONTRA COSTA | 549,300 | 534,400 | 14,900 | 2.7% |
| DEL NORTE | 9,330 | 8,950 | 380 | 4.0% |
| EL DORADO | 92,500 | 90,200 | 2,200 | 2.4% |
| FRESNO | 454,700 | 431,000 | 23,700 | 5.2% |
| GLENN | 12,610 | 12,100 | 520 | 4.1% |
| HUMBOLDT | 59,800 | 58,000 | 1,700 | 2.9% |
| IMPERIAL | 68,500 | 60,700 | 7,800 | 11.4% |
| INYO | 8,270 | 8,040 | 230 | 2.7% |
| KERN | 384,400 | 361,300 | 23,200 | 6.0% |
| KINGS | 56,700 | 53,500 | 3,200 | 5.6% |
| LAKE | 28,490 | 27,400 | 1,090 | 3.8% |
| LASSEN | 9,080 | 8,820 | 260 | 2.8% |
| LOS ANGELES | 5,007,400 | 4,784,400 | 222,900 | 4.5% |
| MADERA | 63,600 | 60,500 | 3,100 | 4.9% |
| MARIN | 129,900 | 127,600 | 2,300 | 1.8% |
| MARIPOSA | 7,000 | 6,750 | 250 | 3.6% |
| MENDOCINO | 37,440 | 36,350 | 1,090 | 2.9% |
| MERCED | 116,800 | 109,500 | 7,300 | 6.2% |
| MODOC | 3,280 | 3,170 | 110 | 3.4% |
| MONO | 8,680 | 8,440 | 240 | 2.8% |
| MONTEREY | 218,100 | 208,500 | 9,600 | 4.4% |
| NAPA | 70,800 | 69,200 | 1,600 | 2.3% |
| NEVADA | 46,820 | 45,660 | 1,160 | 2.5% |
| ORANGE | 1,581,400 | 1,543,000 | 38,400 | 2.4% |
| PLACER | 192,000 | 188,000 | 4,000 | 2.1% |
| PLUMAS | 7,510 | 7,170 | 350 | 4.6% |
| RIVERSIDE | 1,148,600 | 1,110,100 | 38,500 | 3.4% |
| SACRAMENTO | 722,000 | 699,500 | 22,500 | 3.1% |
| SAN BENITO | 32,500 | 31,300 | 1,300 | 4.0% |
| SAN BERNARDINO | 1,005,100 | 971,100 | 34,000 | 3.4% |
| SAN DIEGO | 1,576,700 | 1,534,600 | 42,100 | 2.7% |
| SAN FRANCISCO | 566,800 | 556,100 | 10,700 | 1.9% |
| SAN JOAQUIN | 338,200 | 323,500 | 14,600 | 4.3% |
| SAN LUIS OBISPO | 137,700 | 134,800 | 2,900 | 2.1% |
| SAN MATEO | 448,400 | 440,700 | 7,600 | 1.7% |
| SANTA BARBARA | 224,300 | 218,900 | 5,400 | 2.4% |
| SANTA CLARA | 1,037,600 | 1,018,600 | 19,100 | 1.8% |
| SANTA CRUZ | 134,800 | 129,900 | 4,900 | 3.6% |
| SHASTA | 73,400 | 70,900 | 2,500 | 3.4% |
| SIERRA | 1,340 | 1,300 | 40 | 3.0% |
| SISKIYOU | 16,250 | 15,550 | 700 | 4.3% |
| SOLANO | 199,200 | 192,200 | 7,000 | 3.5% |
| SONOMA | 247,300 | 241,800 | 5,600 | 2.3% |
| STANISLAUS | 239,500 | 228,800 | 10,800 | 4.5% |
| SUTTER | 46,100 | 43,600 | 2,500 | 5.4% |
| TEHAMA | 25,240 | 24,300 | 940 | 3.7% |
| TRINITY | 4,410 | 4,270 | 140 | 3.2% |
| TULARE | 208,200 | 194,700 | 13,500 | 6.5% |
| TUOLUMNE | 19,930 | 19,240 | 690 | 3.5% |
| VENTURA | 410,700 | 399,700 | 11,000 | 2.7% |
| YOLO | 108,700 | 105,600 | 3,100 | 2.8% |
| YUBA | 31,100 | 29,800 | 1,400 | 4.4% |
Source: EDD
