


California and National Drought Summary for July 5, 2022
Summary
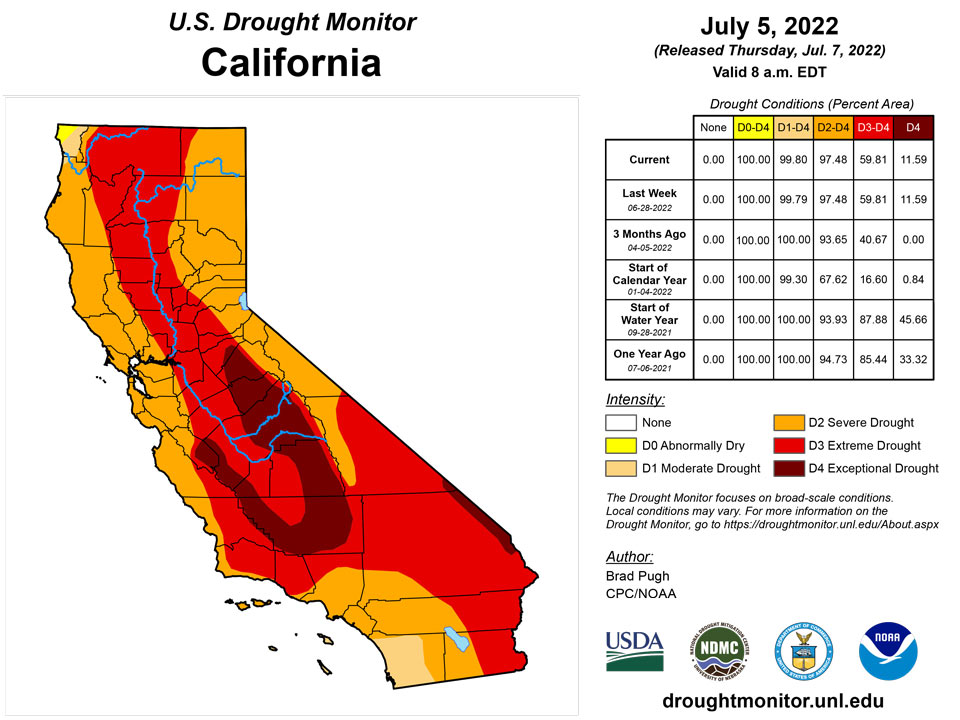
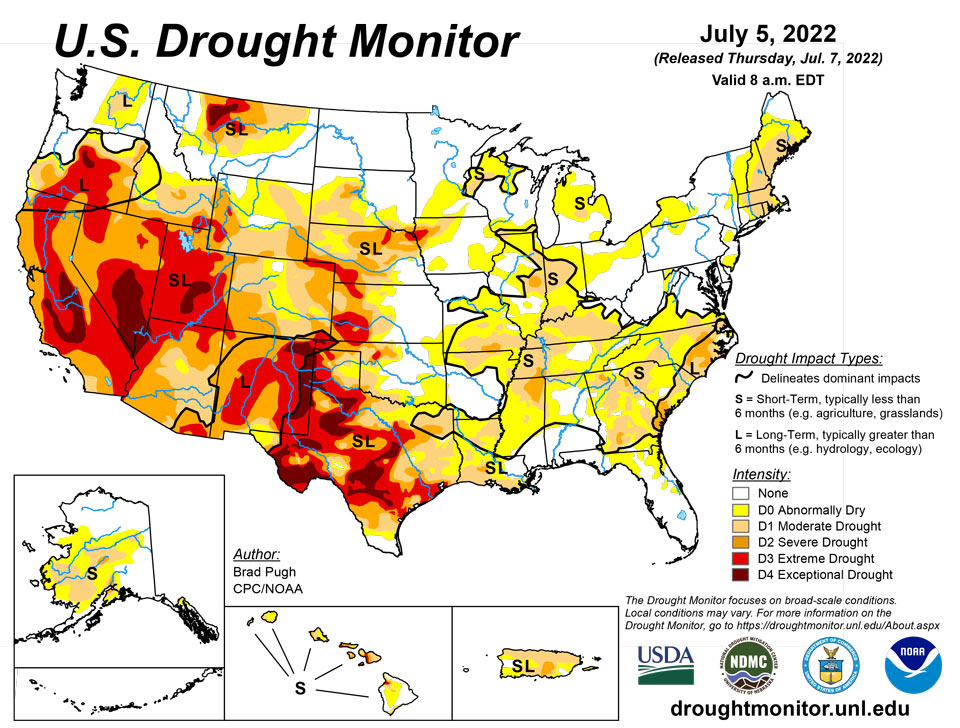
July 7, 2022 - Short-term drought continued to rapidly expand across the Ohio, Tennessee, and Middle Mississippi Valleys along with parts of the Corn Belt. Thunderstorms brought locally heavy rainfall and drought relief to parts of the central to northern Great Plains. However, 7-day temperatures averaged above-normal throughout the Great Plains. A tropical disturbance in the western Gulf of Mexico and a trough of low pressure resulted in heavy rainfall and improving drought conditions to southeast Texas and southwest Louisiana. Convective rainfall was highly variable this past week across the Southeast with isolated amounts exceeding 3 inches while other areas remained mostly dry with worsening drought conditions. New England experienced a week of mostly dry weather and expanding drought coverage. Following the unusually heavy Monsoon rainfall during late June, heavy amounts were more localized this past week across New Mexico. Seasonal dryness prevailed throughout California, while much of the Pacific Northwest became drier after a wet spring. Drier-than-normal conditions persisted for much of Alaska into the beginning of July. A tropical wave of low pressure tracked northwest from the central Atlantic and brought heavy rainfall to eastern Puerto Rico.
Northeast
An expansion of moderate drought (D1) across New England was supported by 60-day SPEI, NASA SPoRT soil moisture, and streamflows. These same indicators also led to a greater coverage of abnormal dryness (D0) for western New York. Based on 30-day deficits of more than 2 inches, 30-day SPEI, and NASA SPoRT soil moisture, D0 was added to northern New Jersey.
Southeast
A few areas of severe drought (D2) were added to Georgia this week that missed out on rainfall and this degradation was supported by SPEI, soil moisture indicators, and crop reports. Insufficient rainfall and periods of above-normal temperatures prompted a slight expansion of abnormal dryness (D0) and moderate drought (D1) across parts of southern Georgia and northern Florida. Jacksonville, Florida had its driest June on record with a monthly deficit of 6.43 inches. Precipitation records date back to 1871. Increasing 30 to 60-day precipitation deficits supported the addition of D0 to east-central Florida. In areas that received heavy rainfall amounts (2-4 inches) in Georgia, Alabama, and the Carolinas, a 1-category improvement was made. D2 was eliminated from the Midlands of South Carolina due to recent rainfall and lack of support among soil moisture indicators. Closer to Savannah, the D2 was maintained despite recent rainfall. The 6-month SPI still supports D2 intensity and the impact line was adjust to long-term drought. Increasing 30-day precipitation deficits, worsening soil moisture indicators, and high water demand at this time of year prompted an increase in D0 and D1 across parts of northern Alabama.
South
The rapid onset of drought continues to affect parts of the Tennessee and Lower Mississippi Valley with a continued increase in coverage of short-term moderate drought (D1). Western Tennessee and northern Mississippi were especially dry the past two weeks with many areas receiving less than 0.25 inches of rainfall. This dryness was combined with above-normal temperatures. Therefore, severe drought (D2) was added to parts of northern Mississippi and western Tennessee. 30-day SPEI, EDDI, and soil moisture indicators were used as guidelines in these degradations. Likewise, D0-D1 was also expanded across northeast Texas, southeast Oklahoma, and Arkansas. The number of Arkansas counties, designated with burn bans, continues to increase. In the 6 week period since May 25, Jonesboro, Arkansas has recorded 1.17" of precipitation, or about 25% of normal. This is the driest such period since 1952. SPI values, starting at 120 days through the past 24 months, along with CPC’s leaky bucket soil moisture (lowest percentile) supported an expansion of D4 across the Texas Panhandle.
Closer to the Gulf Coast, heavy rainfall (more than 1.5 inches) resulted in widespread 1-category improvements to southern Louisiana and southeastern Texas. In areas that received more than 5 inches of rainfall such as southwest Louisiana, a 2-category improvement was justified. A small 2-category improvement was also made to northeastern Texas that received 3 to 6 inches of rainfall. Recent, heavy rainfall also led to a trimming of the extension of moderate drought (D1) across central Mississippi.
Midwest
Through the valid period (ending 8am EDT on July 5), the rapid onset of drought continues to affect parts of the Corn Belt along with the Ohio and Middle Mississippi Valleys. 30-day SPEI, EDDI, soil moisture indicators, and impacts were used in depicting the expanding short-term moderate drought (D1). D1 was degraded to severe drought (D2) in east-central Illinois based on: 30 to 60-day SPEI and soil moisture indicators. The Champaign mesonet station is below the 2nd percentile at the 4” and 8” depths. Impacts include visibly stressed corn and poor pasture conditions. Short-term D2 was also added to south-central Missouri where less than 0.5 inch of rainfall has occurred since the beginning of June. A CoCoRaHS observed in Ripley County, Missouri recorded only a trace of rainfall from May 28-July 5. Based on increasing short-term precipitation deficits, NASA SPoRT soil moisture, and QuickDRI, abnormal dryness (D0) was expanded to include more of Lower Michigan. Likewise, the D0 coverage was expanded to include more of Ohio due to SPEI, declining soil moisture and streamflows, and crop stress. D1 was added to parts of northwest Wisconsin with support from 28-day average streamlows, soil moisture, 30 to 60-day SPI, and EDDI.
High Plains
Locally heavy rainfall (more than 1 inch) this past week resulted in 1-category improvements to parts of Kansas, Nebraska, and South Dakota. Based on increasing short-term precipitation deficits and consistent with worsening soil moisture indicators, severe drought (D2) expanded across north-central Nebraska and extreme drought (D3) was added to more of northeastern Nebraska. Recent precipitation and reassessment of longer term SPI values supported a slight reduction of severe drought (D2) in southwestern Wyoming. Following a drier-than-normal June with above-normal temperatures (+3-4 degrees F), degradations were made to northeastern High Plains of Colorado. Recent monsoonal rainfall and the “convergence of evidence” of multiple indicators led to improvements for southern Colorado.
West
The North American Monsoon remained robust into the beginning of July, resulting in near to above normal precipitation across Arizona and New Mexico. Following the widespread 1-category improvement made the previous week throughout New Mexico, improvements were limited to areas of the heaviest rainfall. Additional improvements may be necessary in subsequent weeks depending on the Monsoon rainfall. Beneficial rainfall (more than 1 inch) continued to result in drought elimination across eastern Montana. Parts of north-central Montana have remained drier since the spring and extreme drought (D3) was expanded which was supported by soil moisture data. Drought coverage and intensity remained steady for the remainder of the West.
Caribbean
Heavy rainfall (3 to 7 inches), associated with a tropical wave, resulted in a 1-category improvement to the eastern third of Puerto Rico. On July 2, San Juan had a daily-record rainfall of 1.71 inches.
A tropical wave moving across the U.S. Virgin Islands in early July delivered much-needed rainfall, with many locations reporting totals ranging from 0.50 to 2.00 inches. Some of the highest amounts occurred on St. Croix, where the Sheep Research Facility (University of the Virgin Islands’ Agricultural Experiment Station) received 2.07 inches in a 24-hour period on July 1-2. Elsewhere on St. Croix, Rohlsen Airport received 0.81 inch on July 2, representing the highest daily total in that location since February 4, when 1.69 inches fell.
However, sustained rainfall will be needed to provide the U.S. Virgin Islands with substantial relief from the drought, which has been slowly intensifying for several months. Native vegetation and pastures remain stressed in many parts of the territory. In addition, groundwater levels have not yet responded to the recent rainfall, reflecting the seriousness of the drought. As a result, extreme drought (D3-SL) is maintained for St. Croix and St. John, while severe drought (D2-SL) is retained for St. Thomas.
Depth to water at the U.S. Geological Survey Adventure 28 Well on St. Croix topped 34.7 feet on July 5, an increase of more than 5.5 feet since the beginning of the year. Meanwhile, depth to water at the Grade School 3 Well on St. Thomas – nearly 16.2 feet – is the greatest since shortly before the devastating 2017 hurricanes. Depth to water at the Susannaberg DPW 3 Well on St. John recently topped 22 feet for the first time since late 2016.
Pacific
The persistent dryness and fire weather considerations resulted in the expansion of abnormal dryness (D0) and moderate drought (D1) for interior Alaska, the addition of severe drought (D2) in the upper Kuskokwim Valley, and the addition of D0 to the far northern Alaska Panhandle. Anchorage, Alaska had its 2nd warmest and 3rd driest June on record. Numerous stations throughout interior Mainland Alaska and the Kenai Peninsula received less than 50 (25) percent of their normal April-May-June (June) precipitation. According to the Alaska Interagency Coordination Center, wildfires have burned more than 2 million acres so far this year. Due to recent rainfall, abnormal dryness (D0) was eliminated from Kodiak Island. This recent wetness also supported a decrease in coverage in D0 and moderate drought (D1) across parts of southwestern Alaska, including the Seward Peninsula.
No changes were made this week to Hawaii with most rainfall limited to windward areas.
Showery weather prevailed across the U.S.-Affiliated Pacific Islands (USAPI) in late June and early July. The drought-monitoring period, ending July 5, featured at least 1 to 3 inches of rain at all observation sites in the Mariana Islands; generally 2 to 6 inches in the Republic of the Marshall Islands (RMI); more than 4 inches across portions of the Republic of Palau; and 4 to 10 inches at several locations in the Federated States of Micronesia (FSM). Rainfall has been somewhat lighter in American Samoa, with Pago Pago International Airport reporting a June total of 5.84 inches and a July 1-4 sum of 0.45 inch. However, American Samoa’s National Park Service observation sites – Toa Ridge and Siufaga Ridge – received totals of 0.82 and 1.02 inches, respectively, during the drought-monitoring period, keeping abnormal dryness at bay.
In fact, the only change on this week’s map occurred in the FSM, where the depiction for Kapingamarangi was improved from severe to moderate drought (D2-SL to D1-L). Kapingamarangi netted a weekly rainfall of 4.76 inches. In the RMI, abnormal dryness (D0-S) was retained for Majuro, despite a weekly total of 2.17 inches. Majuro’s designation reflected low reservoir storage, which stood at 20.267 million gallons at the end of June – a loss of almost exactly 3 million gallons during the second half of the month. Elsewhere, the Marianas have fully emerged from earlier dryness, while the Republic of Palau remains sufficiently wet. In fact, many locations in the Republic of Palau reported June rainfall totals of 10 to 16 inches or more. Aside from Kapingamarangi, there are few drought concerns in the FSM, although recent rainfall has been a bit erratic for Lukunor and Chuuk Lagoon. Set to missing again this week are Fananu (FSM) and Utirik (RMI).
Looking Ahead
A major heat wave is forecast to affect much of the south-central U.S. through at least July 7 or 8 with the anomalous heat becoming centered across the Southern Great Plains and West by mid-July. A swath of heavy rainfall (1 to 3 inches, locally more) is forecast from the Middle Mississippi and Ohio Valleys southeastward to the Mid-Atlantic States from July 7 to 11. Mostly dry weather is expected for the Northeast, Gulf Coast States, Lower Mississippi Valley, and Southern Great Plains. Monsoonal rainfall is forecast to be lighter compared to late June.
The Climate Prediction Center’s 6-10 day outlook (valid July 12-16, 2022) favors above-normal temperatures throughout the West, Great Plains, and Gulf Coast States. Below-normal temperatures are more likely for the Great Lakes and Midwest. Below-normal precipitation is favored for the northern Great Plains and Middle to Upper Mississippi Valley. Probabilities for above-normal precipitation are elevated across eastern Alaska, the Great Basin, Southwest, Southern Great Plains, and along the East Coast.
Author(s):
Brad Pugh, NOAA/CPC
Brad Rippey, U.S. Department of Agriculture
Dryness Categories
D0 Abnormally Dry—used for areas showing dryness but not yet in drought, or for areas recovering from drought.
Drought Intensity Categories
D1 Moderate Drought
D2 Severe Drought
D3 Extreme Drought
D4 Exceptional Drought
Drought or Dryness Types
S Short-term, typically less than 6 months (agriculture, grasslands)
L Long-term, typically more than 6 months (hydrology, ecology)
SL Area contains both short- and long-term impacts
Source: National Drought Mitigation Center

