February 26, 2023 - By Nat Johnson - Another meteorological winter is drawing to a close, though it feels like some of us in the East are still waiting for winter to arrive (not a single inch of snow here in central New Jersey so far!). I realize that this winter has been more eventful in other parts of the country, notably in the western U.S., where torrential rains and heavy mountain snows occurred in December and January. Such heavy precipitation was unexpected prior to the season in a region afflicted with a multi-year severe drought, especially given that we are in the third consecutive winter of La Niña. How unusual were these Southwestern wet conditions in the first two-thirds of a La Niña winter? And did tropical sea surface temperatures contribute? In this blog post, I hope to get this conversation rolling!
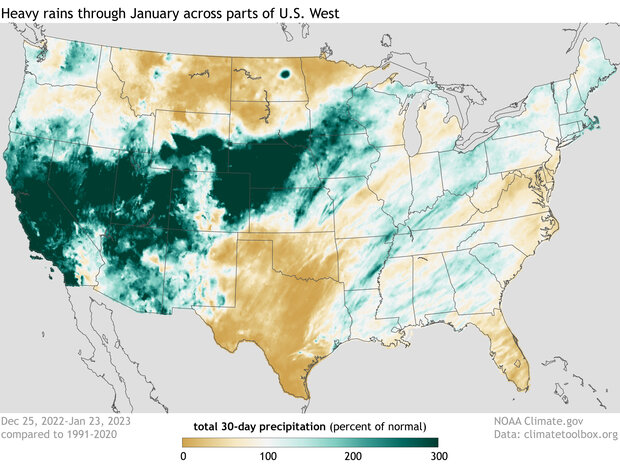
Percent of normal U.S. precipitation over the past 30 days (December 25, 2022, through January 23, 2023) after a series of weather events known as atmospheric rivers, fueled by tropical moisture, flooded the U.S. West with rain and snow. Places where precipitation was less than 100 percent of the 1991-2020 average are brown; places where precipitation was 300 percent or more than average are blue-green. NOAA Climate.gov image, based on analysis and data provided by the Climate Mapper website.
Western drenching
As the figure above shows, much of the western U.S. was pummeled from late December through mid-January, as a series of nine atmospheric rivers dumped more than a season’s worth of rain and snow in a few short weeks. The relief from an unrelenting drought was welcome, but too much of a good thing also meant flooding, mudslides, and dangerous debris flows.
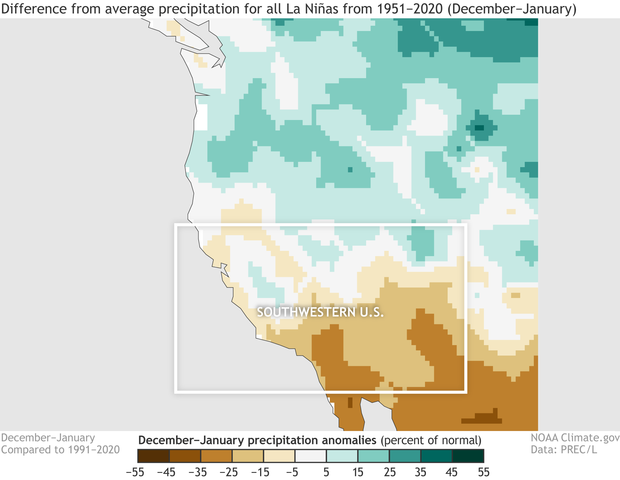
Average December–January precipitation anomalies (percent of the 1991-2020 climatology) for all La Niña events from 1951-2020, defined as La Niña occurring in December–February. Places where precipitation was less than the 1991-2020 average are brown; places where precipitation was above average are blue-green The white box defines the Southwest U.S. region (32° - 40° N, 109°-125° W) that is the focus of further investigation. NOAA Climate.gov image, based on precipitation data from NOAA’s Precipitation Reconstruction over Land (PREC/L).
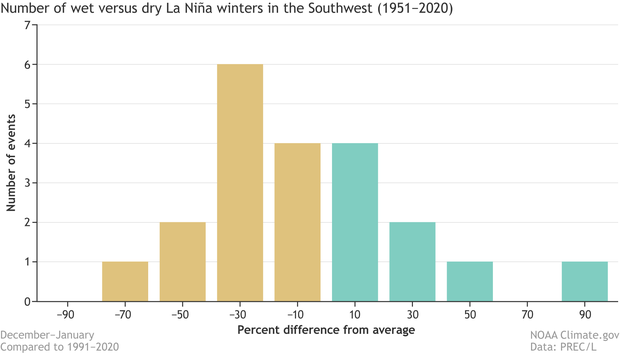
This atmospheric river onslaught surprised many who were expecting a dry season, especially in the Southwest, not only because of the prolonged drought, but also because La Niña tends to bring drier-than-average winter conditions to the region. Here, I am focusing on the Southwest region south of 40 °N that covers most of California, Nevada, Utah, and Arizona, in early winter (December–January). The figure below shows that most (13 of 21) of the La Niñas from 1951-2020 had below-average December-January precipitation in this region (1), although wet early winters during La Niña clearly are not that unusual. This early winter, the Southwest had 65% more precipitation than normal according to this precipitation dataset, which is the second highest La Niña total since 1951. The bottom line is that La Niña may tilt the odds toward dry early winter conditions in the Southwest, but La Niña clearly does not eliminate the chance of wet conditions either.
Distribution of December–January precipitation anomalies (percent of the 1991-2020 climatology) in the Southwest U.S. (region defined in the figure above) for all 21 La Niñas from 1951-2020. The precipitation anomalies are divided into 10 evenly spaced bins, and the number of La Niña events is totaled for each bin. The brown bars indicate events with below-average precipitation, and the green bars indicate events with above-average precipitation. This figure indicates that the Southwest December-January precipitation was below the 1991-2020 average in 13 of 21 La Niñas during the period. NOAA Climate.gov image, based on precipitation data from NOAA’s Precipitation Reconstruction over Land (PREC/L).
Was it predictable?
The million-dollar question for seasonal forecasters and climate scientists alike is whether this unusually wet Southwestern U.S. could have been anticipated more than a few weeks in advance. This question often boils down to whether there were subtle variations in the sea surface temperature pattern that preconditioned the atmosphere for wetter-than-usual conditions in the region (2). These variations include the magnitude and location of the strongest tropical Pacific sea surface temperature anomalies—a particular “flavor” of La Niña.
One way we could try to address this question is to group both the wettest and driest La Niñas over the Southwest in December-January and then see if there are notable differences in the sea surface temperature patterns that occurred during wetter La Niñas versus drier La Niñas. The problem with this approach, however, is that our record of reliable observations is just too short to slice and dice the data in this way. We don’t end up with enough events in each group, and the noise of chaotic weather variability hides the signal we are trying to identify.
A common approach to overcome this limitation of not enough real cases is to use global climate models to create hypothetical ones. We can run multiple simulations in which the ocean is always the same—forced to match observed sea surface temperatures, including all La Niñas from 1951-2020—but the starting atmospheric conditions are very slightly different each time. Since the ocean is the same in all the simulations, the models will produce a range of outcomes that account for the role of atmospheric chaos for each individual La Niña. When we average across all outcomes, we filter out the effects of chaotic climate variability (3).
30 alternate realities
For this analysis, I am using simulations of monthly climate from the Geophysical Fluid Dynamics Laboratory (GFDL) climate model called SPEAR, the same model that contributes seasonal forecasts to the North American Multi-Model Ensemble (NMME), but here the experiment is designed to analyze the climate effects of the observed sea surface temperature evolution from 1951-2020 (4). This set consists of 30 simulations, and since there are 21 winter La Niña events between 1951-2020, I have 30 x 21 = 630 simulations of December-January La Niña conditions—a much larger sample size than if I just relied on the 21 observed La Niña winters.
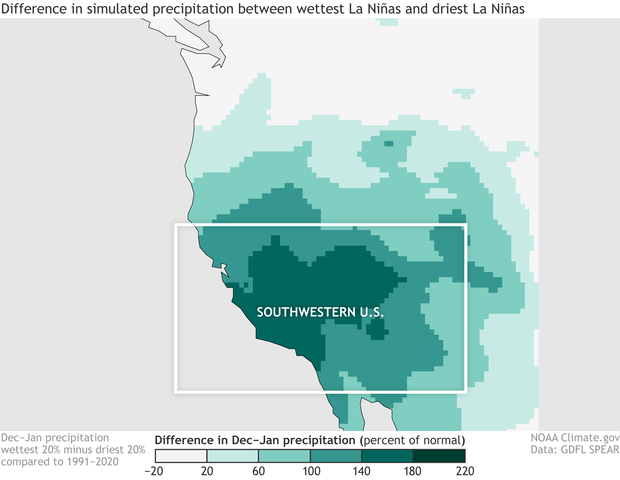
Difference in December–January precipitation anomalies (percent of the 1991-2020 climatology) between the wettest 20% and driest 20% of Southwestern U.S. La Niña outcomes simulated by the GFDL SPEAR climate model. The climate model produces a total of 630 possible climate outcomes covering all La Niñas from 1951-2020. This figure indicates that SPEAR produces very wet early winter conditions in the Southwest for some of the La Niña simulations, with the largest differences between the wet and dry groups exceeding twice the 1991-2020 climatology (more than 200%). NOAA Climate.gov image, based on precipitation data from the NOAA GFDL SPEAR climate model.
To analyze the effect of different sea surface temperature patterns on early-winter precipitation in the Southwest during La Niña, I first defined two groups: the wettest 20% and driest 20% of simulations. The figure above shows the high-minus-low precipitation average differences between these two groups. This figure confirms that SPEAR simulates very high Southwest U.S. precipitation totals in December-January in at least some of the simulated winter La Niñas. The question is, what’s different about those years?
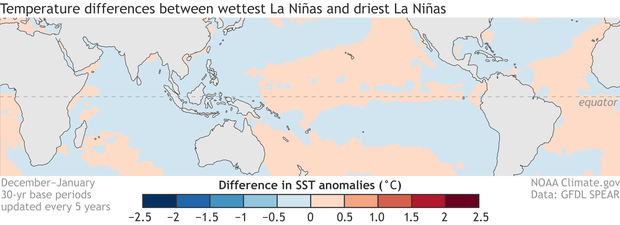
Difference in December–January sea surface temperature anomalies (° C) between the wettest 20% and driest 20% of Southwestern U.S. La Niña outcomes simulated by the GFDL SPEAR climate model. The notably small sea surface temperature differences between the wet and dry groups indicate that the sea surface temperature pattern plays a very minor role in the Southwest precipitation differences during La Niña, according to the climate model. NOAA Climate.gov image, based on precipitation data from the NOAA GFDL SPEAR climate model.
We know that all La Niñas feature below-average surface temperatures in the central and eastern equatorial Pacific, by definition, but the details vary from event to event. So, next, we want to know if there are any consistent differences in the sea surface temperature pattern between La Niñas that lead to wet versus dry early winters in the Southwest. The figure above shows the sea surface temperature differences between the high- and low-precipitation groups in the SPEAR simulations. If you’re struggling to identify any meaningful sea surface temperature differences in the map above, then you and I are in the same boat (5).
The pattern in the map is very weak, with very small departures between the two groups. The logical conclusion is that, according to the climate model, unusually heavy Southwest U.S. precipitation during December-January of La Niña has very little to do with the sea surface temperatures and instead is more closely tied to short-term and seasonally unpredictable weather conditions, as captured by the variations among the 30 simulations for a given La Niña.
To solidify this conclusion, I continued my investigation by calculating how much the variations in the La Niña sea surface temperature pattern contribute to the variations in Southwest U.S. December–January precipitation in the SPEAR simulations. I first averaged the 30 simulations for each of the 21 La Niña winters, giving me 21 precipitation outcomes. These represent the range of variation when the only thing we’re taking into account is “it’s a La Niña winter.” Then, for each of those 21 years, I looked at the range of outcomes across the 30 simulations, thus including the chaotic, unpredictable weather variability. My conclusion: the chaotic weather variations are about 14 times more important than the variations in La Niña amplitude or flavor for Southwest U.S. precipitation, which is consistent with the figure above. (Head to footnote 6 for all the gory math details.)
That doesn’t mean that the different flavors of La Niña cannot be important for Southwest U.S. precipitation, and it’s worth trying to better understand the simulated La Niña precipitation variations. Even modest variations could tip the scale toward wetter or drier conditions in a particular winter. But if these big picture findings hold up to further scrutiny, then it means that the typical or averaged La Niña precipitation pattern still may be the most reliable guide for seasonal predictions of Southwest precipitation in early winter, but we may have to rely on subseasonal and weather forecasts rather than seasonal outlooks to anticipate the sort of soaking that occurred in December and January of this winter.
Familiar caveats
All good scientific studies note their limitations, and this analysis carries some caveats that are familiar to most climate scientists. Because the observed record is too short to tease out the relationships we seek with sufficient precision, we rely on climate models to sharpen the signal relative to the noise of random weather variability. Although such climate models are rather sophisticated and reliable, they are imperfect. We cannot rule out the possibility that the model is missing some sort of predictable connection between a particular “flavor” of La Niña sea surface temperatures and Southwest precipitation. I did just one set of analyses focused on one particular region with one climate model, and that’s why I stated up front that this is just the start of the conversation. That means that this post is definitely not the last word on this topic!
Footnotes
- It’s interesting to note that the La Niña dry signal over the Southwest U.S. appears to be a little more robust in February-March than December-January, as 15 of the 21 events classified as La Niña in December-February had drier-than-average conditions in February-March. Even the wettest December-January event before this year, 1955/56, was drier-than-average in February-March, demonstrating that a wet early winter doesn’t necessarily mean a wet late winter. I saw this same behavior in my analysis of the SPEAR climate model simulations, which increases confidence that this more robust dry signal in February-March is a real phenomenon.
- For completeness, I will mention that there are other potential sources of seasonal predictability, such as stratospheric, cryosphere, land surface or radiative forcing variations, but sea surface temperature variations generally are the most important.
- This procedure of ensemble averaging is the same procedure we perform with seasonal forecast models. The difference here is that we are not identifying a forecast signal, but instead we are trying to isolate the effects of the sea surface temperature pattern on the climate, i.e., the effects of La Niña on southwestern U.S. precipitation in this example.
- I don’t want to be guilty of self-promotion, but I recently published a paper that demonstrates that SPEAR does pretty well at simulating the historical impacts of El Niño and La Niña.
- If we were to zoom into the tropical region, where sea surface temperatures have the greatest global climate impact, we would see some sea surface temperature differences of up to 0.2° C in the tropical Pacific and Indian Oceans. It’s conceivable that such differences could influence precipitation in the Southwest U.S., but these differences are much smaller than the amplitude of the largest average La Niña tropical Pacific sea surface temperature anomalies, which approach 2° Therefore, it is difficult to see how such small sea surface temperature differences could have an influence that is comparable with the average La Niña influence. My calculation that follows confirms this suspicion.
-
If you’re wondering what sort of calculations led to this conclusion, then I will give you all the details here. I’m basically doing a signal versus noise calculation. The signal of interest is Southwest U.S. precipitation variations due to the sea surface temperature variations during all La Niñas. To determine this signal, I first calculated the average of the December-January Southwest U.S. precipitation across all 30 ensemble members for each La Niña. This results in 21 values covering all historical La Niñas during the period for which the noise of chaotic weather variability has been largely averaged out. Therefore, the variations among these 21 ensemble-averaged values, quantified as a standard deviation of 0.194 mm/day, largely reflect the effects of the different sea surface temperature patterns among the 21 La Niñas. Technically, this value also will reflect, in part, the increases in greenhouse gas increases in the simulation, but this effect on precipitation is relatively small.
Next, I tackled the noise part of the calculation, which represents the Southwest precipitation variations that are unrelated to the sea surface temperature patterns. This is calculated as the deviation of the 30 ensemble members from the average for each individual La Niña event, and so I wind up with a total of 630 deviations from the ensemble average that capture precipitation variations resulting from the uncertainty in the initial conditions, i.e., chaotic weather variability. The standard deviation of this set of values is 0.725 mm/day.
The signal-to-noise ratio is typically calculated as a ratio of variances, which are the squares of the standard deviations. I follow that convention here, though I’m really calculating the inverse, meaning the noise-to-signal ratio. When we plug those values in, we get (0.725)2/(0.194)2 = 14, which is why I conclude that chaotic weather variations are about 14 times more important than the variations caused by sea surface temperature variations for December-January Southwest U.S. precipitation during La Niña events. The exact value may change depending on what metric you use, but the overall conclusion shouldn’t change.
A blog about monitoring and forecasting El Niño, La Niña, and their impacts.
Disclaimer:
The ENSO blog is written, edited, and moderated by Michelle L’Heureux (NOAA Climate Prediction Center), Emily Becker (University of Miami/CIMAS), Nat Johnson (NOAA Geophysical Fluid Dynamics Laboratory), and Tom DiLiberto and Rebecca Lindsey (contractors to NOAA Climate Program Office), with periodic guest contributors.
Ideas and explanations found in these posts should be attributed to the ENSO blog team, and not to NOAA (the agency) itself. These are blog posts, not official agency communications; if you quote from these posts or from the comments section, you should attribute the quoted material to the blogger or commenter, not to NOAA, CPC, or Climate.gov.
Source: ENSO blog team


