


California and National Drought Summary for June 13, 2023
Summary
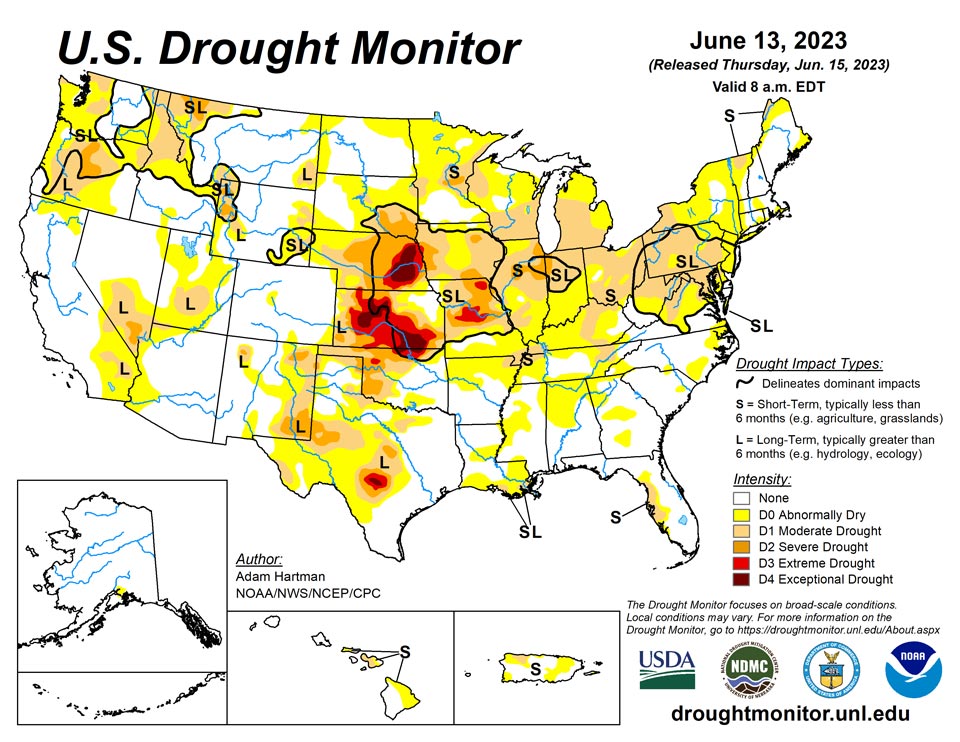
June 15, 2023 - Above normal precipitation and below normal temperatures resulted in another week of targeted improvements across portions of the Intermountain West, adding to recent precipitation totals that have continued to improve long-term drought conditions. The exception is the Pacific Northwest, where below normal precipitation and above normal temperatures resulted in worsening drought conditions along the northern Cascades. There is a mix of improving and worsening drought conditions across the Great Plains. Improvements are mainly confined to the western Great Plains, where widespread 7-day rainfall totals exceeded 200 percent of average for the week, further adding to short-term precipitation surpluses. From the eastern Great Plains to the Eastern Seaboard, 7-day rainfall surpluses are more scattered in nature, leading to only modest improvements in areas seeing the heaviest amounts. In areas that received below normal rainfall this week, drought worsened, as rainfall deficits continue to increase.
Northeast
A storm system developed over the Midwest during the weekend and moved across the Northeast Monday into Tuesday bringing heavy rainfall to parts of the interior Northeast, warranting targeted improvements to the drought depiction in portions of northeastern Pennsylvania and interior New England. Otherwise, the storm system did little to improve antecedent dryness, acting only to halt ongoing deterioration, with the help of below average maximum temperatures for this week. In areas that experienced below average 7-day rainfall, expansion of abnormally dryness (D0) and moderate drought (D1) conditions is warranted, particularly across southern portions of the Northeast. 7-day average stream flows have fallen below the 10th percentile of the historical distribution for this period and soil moisture continues to decline.
Southeast
A trailing frontal boundary, associated with a storm system moving across the Great Lakes and Northeast toward the end of the week, resulted in pockets of heavy rainfall in excess of 2 inches across the central Gulf Coast, parts of the Coastal Plain of the Carolinas, and the Southern Appalachians. Unfortunately, with the exception of a few locations in the Carolinas, the heaviest rain fell in areas lacking any dryness. In areas with antecedent dryness in place who received below normal rainfall this week, degradation to moderate drought (D1) in Virginia and degradation to abnormal dryness (D0) elsewhere across the Southeast is warranted. 7-day average stream flows across the Piedmont and Coastal Plain of Virginia and North Carolina have fallen below the 24th percentile of the historical distribution for this week and soil moisture has also continued to decline. In Florida, timely rainfall resulted in a status quo depiction for the most part. However, after a reassessment of drought indicators near the Big Bend, an improvement to severe drought (D2) conditions is warranted.
South
Several locations across Louisiana, Mississippi, and Tennessee experienced degradation this week, as the frontal boundary draped across the southern tier states did not result in enough precipitation to stave off degradation for those experiencing antecedent dryness. This is also the case in portions of central Texas and parts of the middle Red River basin, where targeted degradations are also warranted. However, farther westward across western portions of the Southern Plains, pockets of heavy rainfall continued to add to 60-day precipitation surpluses, particularly for parts of the Texas and Oklahoma Panhandles. Rainfall has been plentiful in these areas in recent weeks and months. For example, Amarillo Texas recently set a new record of 20 days with measurable precipitation during May; the previous record being 15 days. In addition, Lake Meredith, located north of Amarillo has reached 45.8 percent of its capacity, its highest since 2001, according to Texas Water Development Board data.
Midwest
A storm system over the Midwest and Great Lakes over the weekend did little to halt widespread degradation of conditions across the Midwest. Although some locations did experience modest improvements, mainly in areas seeing in excess of 2 inches of rainfall, degradation to moderate drought (D1) and expansion of abnormal dryness (D0) is widespread across the Corn Belt, the Lower Peninsula of Michigan, and the Upper Midwest. High rates of evaporation from soils and vegetation over the past 1 to 2 months have resulted in large losses to soil moisture, with stream flows also dropping significantly across many of these same areas (falling below the 10th percentile of the historical distribution, particularly across the southern Great Lakes and the Corn Belt). There are many reports of browning and stressed vegetation, with several producers already resorting to supplemental feeding for their livestock due to reduced forage. Loss of yield remains a large concern for many.
High Plains
Although much of the High Plains region received above-normal precipitation this week, the region as a whole is a tale of 2 halves. Improvement to the drought depiction is warranted across western portions of the Central and Northern Plains, where 7-day precipitation totals exceeded 200 percent of average across most areas, adding to precipitation surpluses in recent weeks and improving long-term drought indicators. Conversely, deteriorating conditions are warranted across eastern parts of the High Plains region where heavy, convective rainfall was not enough to overcome predominantly near and above normal temperatures and high rates of evaporation from the soils and vegetation (known as evapotranspiration). For example, parts of South Dakota reported evapotranspiration rates from crops averaging around 0.25 inches per day, which varied slightly depending on the type of crop, essentially eliminating the effects of beneficial rainfall for several locations.
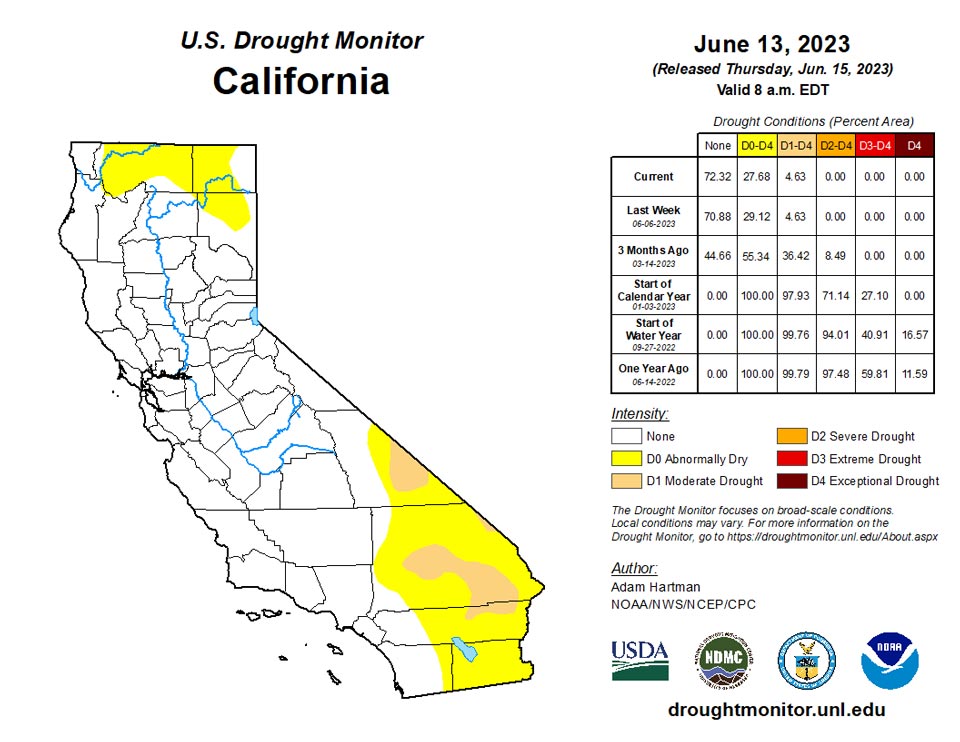
West
The Intermountain West is the beneficiary of another week of widespread above normal precipitation for many locations, with large portions of the Four Corners region, the Great Basin, and the southern and central Rockies also experiencing below normal temperatures. Improvements are warranted in locations where long-term drought indicators, such as groundwater, continue to improve. In addition, the above-normal snowpack from the active winter rainy season across much of the West continues to keep stream flows near and above average. Unfortunately, degradations are warranted across parts of the Cascades in the Pacific Northwest, which experienced a near- to below-average winter rainy season, which has been exacerbated by below average precipitation since that time. Soil moisture and groundwater continue to decline and 7 to 14 day average stream flows have fallen into the bottom 30 percent (and in many cases, the bottom 10 percent) of their historical distributions. In addition, above average temperatures this week (4 to 10°F above normal) have acted to accelerate this deterioration.
Caribbean
Moderate drought (D1) and abnormally dry (D0) conditions worsened for parts of Puerto Rico, where negative 30 to 60 day rainfall anomalies continue to increase, and where average stream flows and short-term drought indices continue to decline. However, after a reassessment of some of the drought indicators, some improvement is warranted near Santa Isabel along the south-central coast, as stream flows are running near normal and wet signals are evident over the past several months.
Drought severity remained unchanged or deteriorated this past week. Most notably, continued hot and dry weather in St. Croix prompted a deterioration to D4 this week – the most severe classification. Similar conditions for the past two weeks prompted deterioration to D2 in St. John, but slightly wetter early-Jun weather in St. Thomas kept conditions at D2, unchanged from last week.
Some other sites on St. Croix have not been as dry but are still well below normal since last autumn. East Hill reported about 9.4 inches of rain since Nov 15, 2022 (about 50 percent more than Rohlsen Airport), which is more than their record for the period (8.3 inches 2014-15), but still under 55 percent of normal.
Consistently above-normal temperatures have exacerbated drought conditions on St. Croix. At Rohlsen Airport, the average temperature of 85.8 deg. F for the first 13 days of Jun was the warmest such period on record (since 1951). The daily high temperature equaled or exceeded 90 deg. F on 12 of those days. But due in part to unusually high sea surface temperatures, nighttime minima have been more anomalously high. During Jun 1 - 13, there were 12 days where the low did not drop below 80 deg. F. In contrast, there were only 6 such days during Jun 1 -13 in the prior 4 years combined. The last day with below-normal temperatures at Rohlsen was Apr 25, 2023. Long-term, the average daily high temperature has consistently been above normal for the past few years. Average daily high temperatures were above normal for 58 of the 63 months since Apr 2018; only 5 were below normal for the month as a whole. For this period of over 5 years to date, daily highs averaged just under 1.1 deg. F above normal.
The past several months have been considerably wetter on St. John, but still markedly below normal. During Feb 1 - Jun 13, 2023, 7.92 inches of rain fell on Windswept Beach, about 64 percent of normal (12.78 inches). And unlike St. Croix, the period from mid-Nov 2022 through Jan 2023 was wetter than normal. But conditions have intensified over the last 6 weeks. Just over 2.5 inches of rain has fallen since May 1, less than 45 percent of normal (5.71 inches), and no measurable rain fell during the first 13 days of Jun when over 1.4 inches of rain typically falls. The acute short-term dryness and persistently above-normal temperatures prompted deterioration to D2 this week.
St. Thomas was slightly wetter than other parts of the U.S. Virgin Islands since the start of Jun, with 0.32 inch of rain reported. Since Apr 24, King Airport has received 1.66 inches of rain, or about 37 percent of normal. This is above the record low of 1.12 inches for the 51-day period, set in 1977. But although dryness has been somewhat less acute during the last 6 weeks compared to other parts of the U.S. Virgin Islands, the last 7 months (since mid-Nov 2022) have been significantly drier than normal, and drier than Windswept Beach, St. John. Only 8.83 inches of rain was reported from mid-Nov 2022 through mid-Jun 2023, less than half the normal 18.49 inches.
According to reports collected by the National Oceanic and Atmospheric Administration and the U.S. Department of Agriculture, the lack of rainfall has been exacerbated by unusually strong winds and high temperatures, resulting in depleted surface moisture and drying ponds. Farmers and ranchers have reported distress in vegetation and a decrease in egg production. Some animals have succumbed to the combination of heat, lack of water, and access to grazing. St. Croix has already qualified for a 2023 secretarial drought disaster declaration, and similarly, livestock producers on St. Croix have qualified for direct assistance through the Livestock Forage Program.
Pacific
During Apr 25 - Jun 13, 2023 (50 days), only 0.35 inch of rain fell on Rohlsen Airport near Christiansted, St. Croix, only 7 percent of normal (4.86). This is the driest such period since records began in 1951 (59 years, not counting 13 years with missing data). Longer-term, well-below-normal rainfall dates back to Nov 15, 2022. For the approximately 7-month period through Jun 13, 2023, only 6.25 inches of rain fell on Rohlsen Airport, less than 36 percent of normal (17.46 inches). This was also the driest such period on record.
In Alaska, 7-day precipitation totals were enough to improve abnormally dry (D0) conditions near the Prince William Sound. However, given precipitation in this region is heavily influenced by the wind direction and terrain, below average precipitation was observed near Anchorage, resulting in some expansion of abnormal dryness.
In Hawaii, mounting rainfall deficits, declining stream flows, and vegetation stress warrants degradation of the drought depiction across western Molokai, central and western Maui (where moderate drought was also introduced), and the northeastern half of the Big Island.
Across the U.S. Affiliated Pacific Islands, the Drought Monitor again kept all sites out of any dryness or drought designation.
In Palau, 1.51 inches of rain were reported last week, bringing the total for the first 13 days of Jun to just over 6 inches. With May bringing over 19 inches of rain and Jun on pace to top one foot of rainfall, amounts are more than sufficient to meet needs.
Guam recorded 1.91 inches of rain last week while other sites in the Marianas Islands received 0.73 to 1.1 inches – somewhat lower than the prior week. For the first 13 days of Jun, 6.61 inches of rain soaked Guam while Tinian and Rota Airport recorded about 2 inches and slightly over 3 inches, respectively. Saipan was drier the first week of Jun, so only reports 1.5 inches for the first 13 days of the month. All locations except Saipan are on pace to receive enough rain to keep up with demand for Jun, and Saipan received sufficient monthly amounts in Apr and May to meet needs, so no dryness-related impacts are expected in the near future.
Most locations in the Federated States of Micronesia received less rainfall than the previous week but totals for the first 13 days of Jun are on pace to meet or exceed monthly needs. Western locations were the driest this past week, with Ulithi and Woleai both recording 0.69 inch, and Yap reporting 2.47 inches. But for the past 2 weeks as a whole, most sites reported 4.5 to 7.0 inches, with scattered higher amounts (Woleai 8.13 inches, Yap 9.63 inches, and North Fanif 12.08 inches). All reporting locations have received enough rain to meet or exceed demand for the past 6 weeks, so no dryness-related impacts are expected in the near future.
Kapingamarangi – frequently plagued by drought over the past few years – was doused by over 49 inches of rain during the 3 months Mar - May 2023. This exceeds the amount observed during the 9 months Mar - Nov 2022 (45.2 inches), and is the first 3-month period with over 40 inches of rain since Apr - Jun 2021. The only location experiencing a multi-month period of subnormal rainfall is Lukunor. For the last 4.5 months (Feb 1 - Jun 13, 2023), just under 39 inches of rain was reported, compared to a normal over 50 inches (71.5 percent of normal). But despite these amounts being below normal, they were sufficient to meet water demand.
Moderate rain fell on most of the Marshall Islands last week. Jaluit reported 0.57 inch, but the other reporting locations received 1.6 to 2.9 inches. These amounts brought Jun-to-date totals to 2.06 inches at Wotje, and 3.4 to 5.1 inches elsewhere. After Feb - Mar 2023 brought only 2.1 inches of rainfall to Wotje, almost 15.7 inches fell Apr - May, easing dryness impacts.
In American Samoa, Pago Pago reported only 2.1 inches of rain fell Jun 1 - 13, about 82 percent of the normal for the period (2.54 inches). Climatologically, however, Jun is a relatively dry month, and is typically much drier than the previous few months. Normals drop from over 10.6 inches of rain for May to under 5.9 inches in Jun. The first 5 months of 2023 brought over 70 inches of rain to Pago Pago, about 10 inches more than normal. These totals are well over the amount needed to keep pace with demand, so no dryness-related impacts are expected in the near future.
Looking Ahead
According to the Weather Prediction Center, over the next 6 days (June 15 - 20) warm temperatures are forecast to build across central portions of the lower 48 states, with cooler temperatures forecast across much of the Intermountain West and the West Coast leading up to June 20. Generally seasonal temperatures are likely east of the Mississippi River. Rainfall is forecast across a large swath of the lower 48 states from the Pacific Northwest to the Southeast, and northward along the East Coast. In the Southeast, heavy precipitation (in excess of 5 inches) is forecast for parts of the Deep South and the central and eastern Gulf Coast region.
During the next 6 to 10 days (June 20 - 24), the Climate Prediction Center favors below normal temperatures across the western third of the lower 48 states, and across parts of the Mid-Atlantic coast and Appalachians. Above normal temperatures are favored for the Great Plains, Mississippi River Valley, Great Lakes, interior Northeast, and southern Florida. Above normal precipitation is indicated across northwestern and north-central portions of the lower 48 states, and across the Southeast and Mid-Atlantic states. Below normal precipitation is weakly favored across parts of southern Texas and extending into the Four Corners region, parts of the Midwest, and northern New England.
Author(s):
Adam Hartman, NOAA/NWS/NCEP/CPC
Richard Tinker, NOAA/NWS/NCEP/CPC
Dryness Categories
D0 Abnormally Dry—used for areas showing dryness but not yet in drought, or for areas recovering from drought.
Drought Intensity Categories
D1 Moderate Drought
D2 Severe Drought
D3 Extreme Drought
D4 Exceptional Drought
Drought or Dryness Types
S Short-term, typically less than 6 months (agriculture, grasslands)
L Long-term, typically more than 6 months (hydrology, ecology)
SL Area contains both short- and long-term impacts
Source: National Drought Mitigation Center
