


December 1, 2023 - To give you a better idea of the coldest time of year, on average, for your area, the climate experts at NOAA National Centers for Environmental Information (NCEI) have created “Coldest Day of the Year” maps for the contiguous United States, Alaska, Hawaii, and Puerto Rico. We've turned them into an interactive version where you can zoom in and see the exact value at stations across the country.
In the West, the coldest day of the year usually occurs in December. "Islands" of late-winter dates are often valleys where temperature inversions allow air to keep cooling even after the coldest day in the surrounding area has typically passed.
In the East, the coldest day of the year is typically later in the season thanks to cold air from snow-covered parts of Canada dipping down into the area.
To give you a better idea of the coldest time of year, on average, for your area, the climate experts at NOAA National Centers for Environmental Information (NCEI) have created “Coldest Day of the Year” maps for the contiguous United States, Alaska, Hawaii, and Puerto Rico. We've turned them into an interactive version where you can zoom in and see the exact value at stations across the country.
----------------------------------------------------------------------------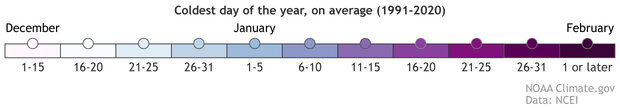
Click the plus sign (above) to zoom in. Click on a dot to see the data from that station. Launch in a full browser window. Based on the 1991-2020 U.S. Climate Normals, this map shows the typical coldest day of the year across the United States. Dots show observations from thousands of U.S. weather stations. The background map shows estimated (interpolated) values for areas between stations. NOAA Climate.gov map, based on data from NOAA NCEI. Static maps.
The maps are derived from the 1991–2020 U.S. Climate Normals—NCEI’s 30-year averages of climatological variables including the average low temperature for every day. From these values, scientists can identify which day of the year, on average, has the lowest minimum temperature, referred to here as the “coldest day.” (If a string of days has the same low temperature, the map shows the middle day of the range).
The contiguous United States map reveals several interesting regional differences across the country. Most prominently, the portion of the United States west of the continental divide (the West) typically reaches its climatological coldest day in December, whereas most of the East reaches its seasonal minimum in January. The West is profoundly influenced by the flow of moderating air masses with clouds and precipitation coming off the Pacific Ocean and aligns more closely to the seasonal solar cycle, while the East is responding to cold air flowing south from Canada that is modified by snow cover reflecting solar radiation away from the surface.
Pockets of later coldest dates near the Rockies and Cascades/Sierra Nevada often correspond to stations located in deep valleys where calm winds and snow cover cause temperatures to become colder than nearby higher ground, a condition called a temperature inversion. Alaska tends to have January coldest day normals, while the low latitude islands of Hawaii and Puerto Rico can have normal coldest days later in February and even in early March.
Temperature Normals are important indicators used by many U.S. economic sectors for planning and making decisions for periods of time beyond the range of weather forecasts. Knowing the probability of low temperatures can help energy companies prepare for peak heating demand. They are also useful planning tools for the healthcare, construction, and tourism industries. You may even want to check the Normals before planning your next event or vacation!
While the map shows the coldest days of the year on average throughout the United States, this year’s coldest day may vary from the normal based on actual weather and seasonal climate patterns. For prediction of your actual local daily temperature, and to see how it matches up with the Climate Normals, check out your local forecast office on Weather.gov.
Source: NOAA
