


Important Note: The employment data for the month of November 2023 is taken from the survey week including November 12. Data for December is scheduled for release on January 19, 2024.
Employers added 9,300 nonfarm payroll jobs
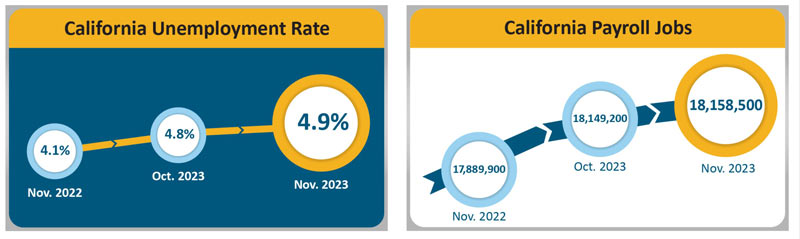
December 23, 2023 - SACRAMENTO – California’s unemployment rate rose by 0.1 percentage point to 4.9 percent1 in November 2023 despite the state’s employers adding 9,300 nonfarm payroll jobs2 to the economy, according to data released on Friday by the Employment Development Department (EDD) from two surveys.
California's Labor Market, by the Numbers...
- Since the current economic expansion began in April 2020, California has gained 3,240,500 jobs, which averages out to a gain of 75,360 jobs per month, and now sits at 485,900 jobs (or 2.7 percent) above the state’s pre-pandemic total.
- California’s 9,300 November nonfarm job gain contributes to 11 consecutive months of job gains in 2023 to date after last December’s losses.
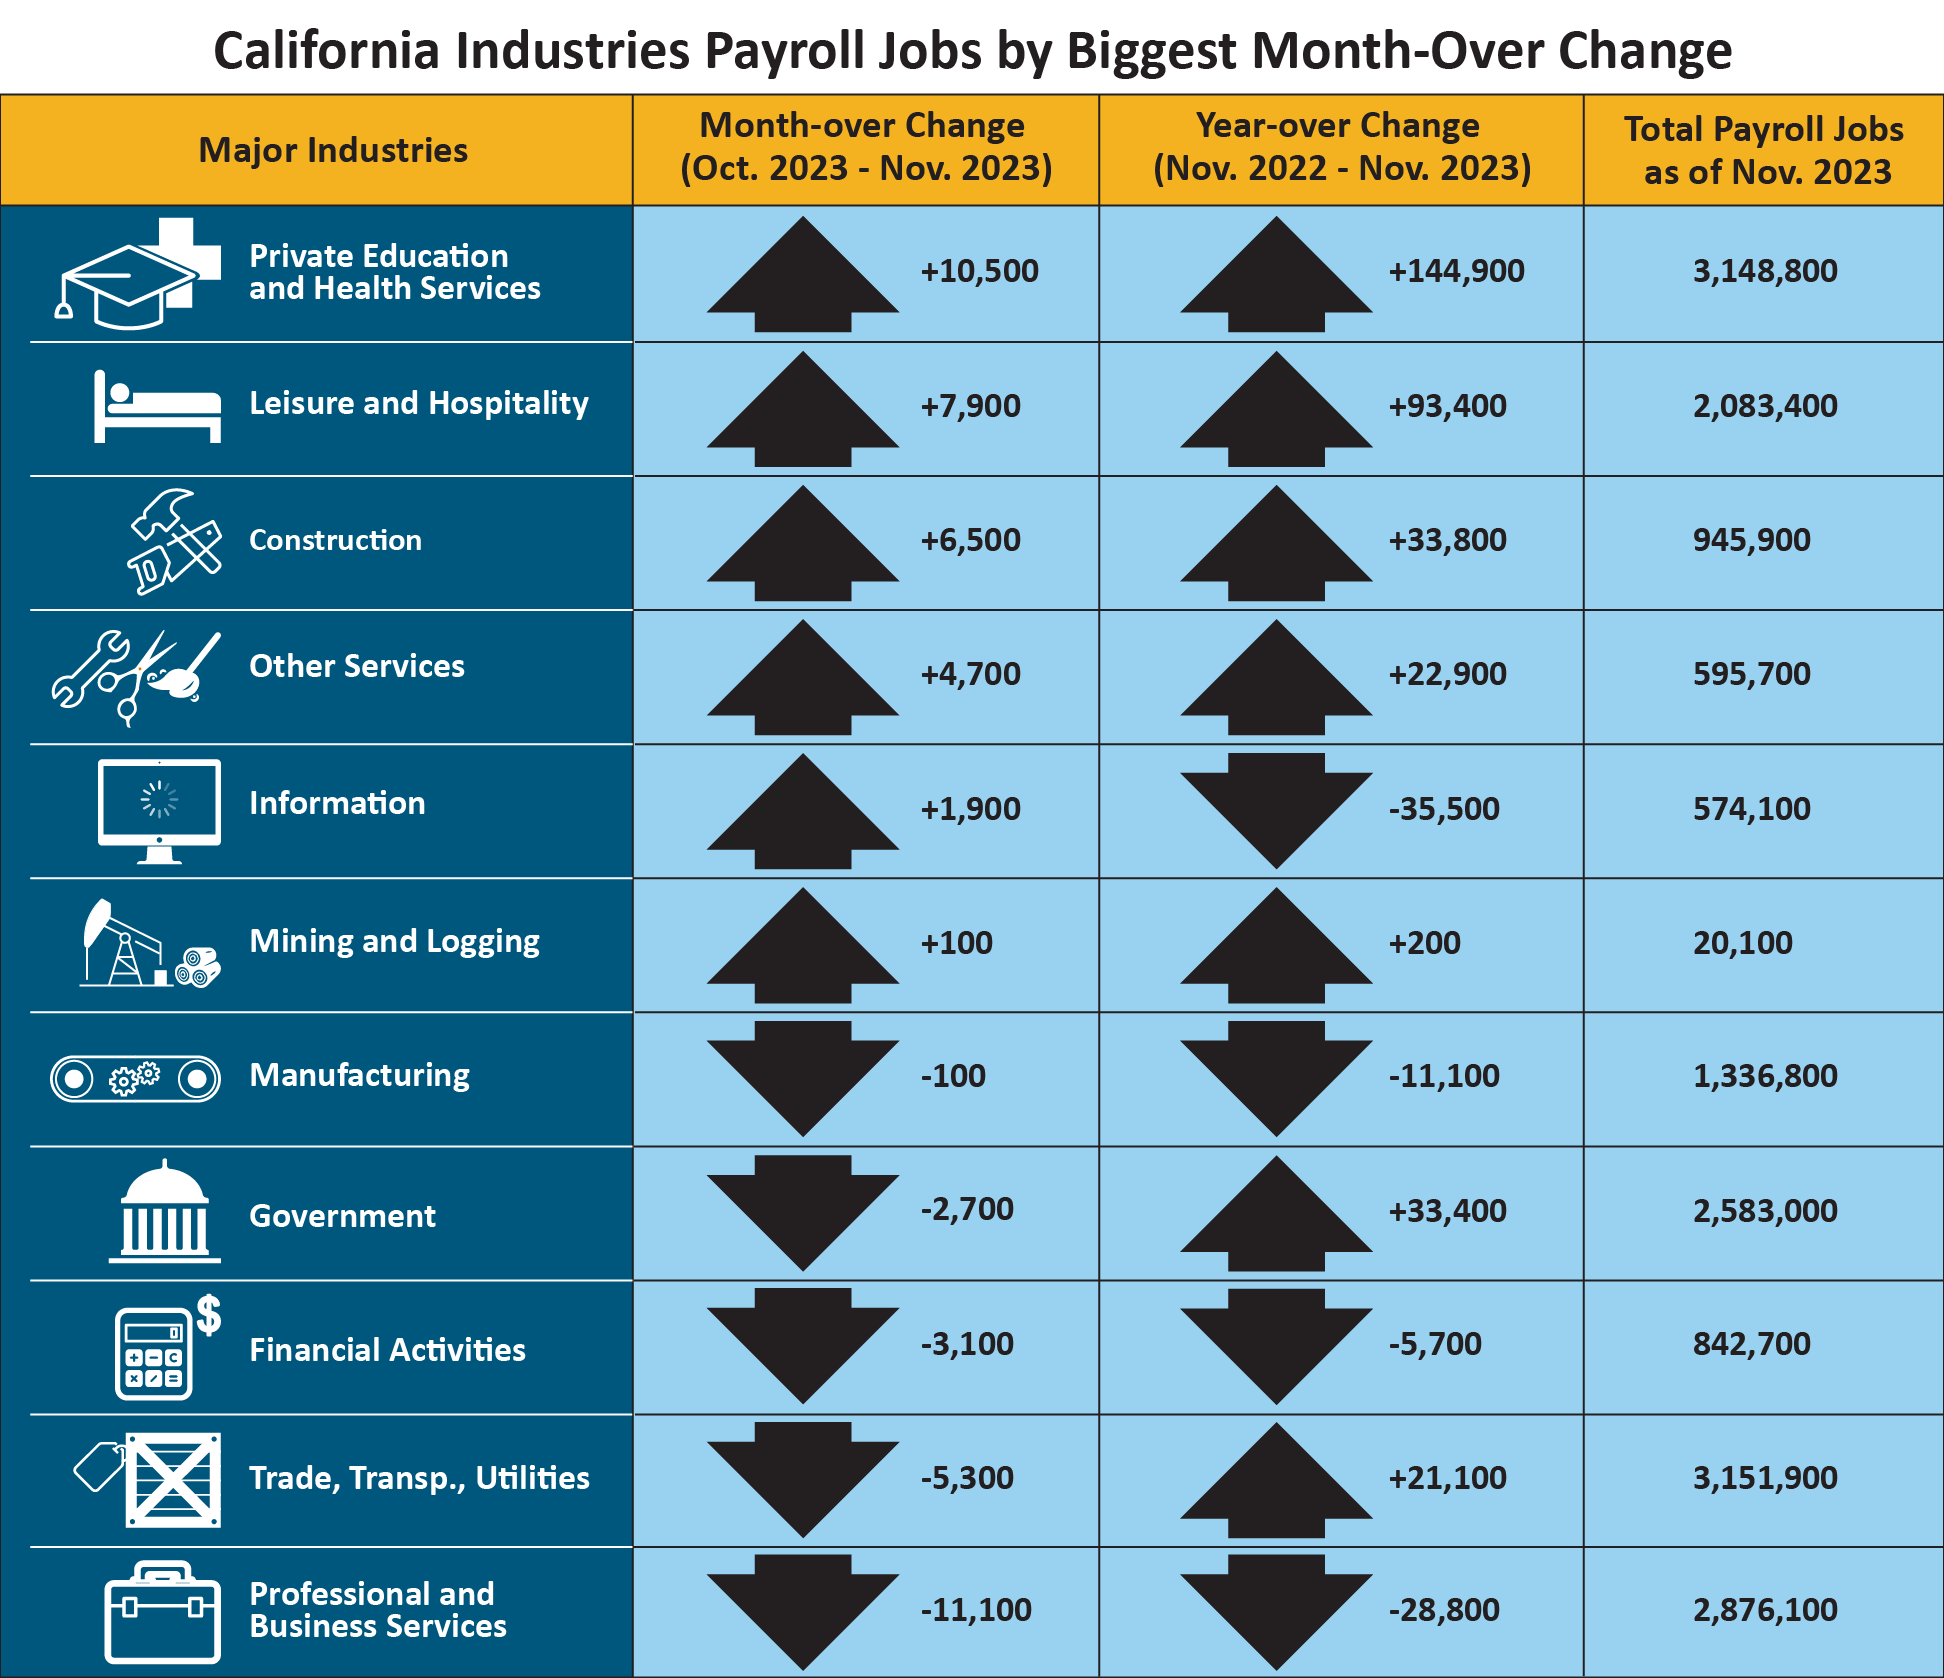
- Six of California's 11 industry sectors gained jobs in November with Private Education & Health Services (+10,500) showing the largest gains thanks to above average gains in the Nursing and Residential Care Facilities and Social Assistance industry groups.
- Leisure & Hospitality (+7,900) also showed good gains and now boasts 25,800 (or 1.3 percent) more jobs than it did pre-pandemic.
- Gains in Information (+1,900) were due, in part, to the end of the Screen Actors Guild-American Federation of Television and Radio Artists strike as striking workers returned to the workplace.
- Reductions in Professional & Business Services (-11,100) were largely due to above average losses in the Employment Services, Services to Dwellings and Buildings, and Waste Management and Remediation Services industry groups.
1. The unemployment rate comes from a separate federal survey of 5,100 California households.
2. The nonfarm payroll job numbers come from a federal survey of 80,000 California businesses.
Data Trends about Jobs in the Economy
Total Nonfarm Payroll Jobs
Total Nonfarm Payroll Jobs (Comes from a monthly survey of approximately 80,000 California businesses that estimates jobs in the economy – seasonally adjusted)
- Month-over – Total nonfarm jobs in California’s 11 major industries totaled 18,158,500 in November – a net gain of 9,300 from October. This followed a downward revised (-5,700) month-over gain of 34,500 jobs in October.
- Year-over – Total nonfarm jobs increased by 268,600 (a 1.5 percent increase) from November 2022 to November 2023 compared to the U.S. annual gain of 2,791,000 jobs (a 1.8 percent increase).
Total Farm jobs – The number of jobs in the agriculture industry increased from October by 14,200 to a total of 442,900 jobs in November. The agricultural industry had 12,300 more farm jobs in November 2023 than it did in November a year ago.
Data Trends about Workers in the Economy
Employment and Unemployment in California (Based on a monthly federal survey of 5,100 California households which focuses on workers in the economy)
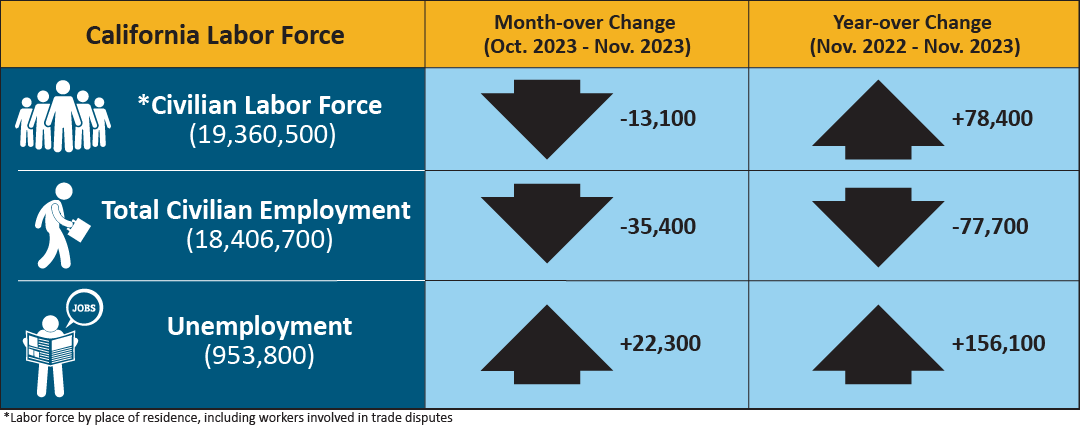
- Employed – The number of Californians employed in November was 18,406,700, a decrease of 35,400 persons from October’s total of 18,442,100 and down 77,700 from the employment total in November
- Unemployed – The number of unemployed Californians was 953,800 in November, an increase of 22,300 over the month and up 156,100 in comparison to November 2022.
Unemployment Insurance Claims (Not Seasonally Adjusted)
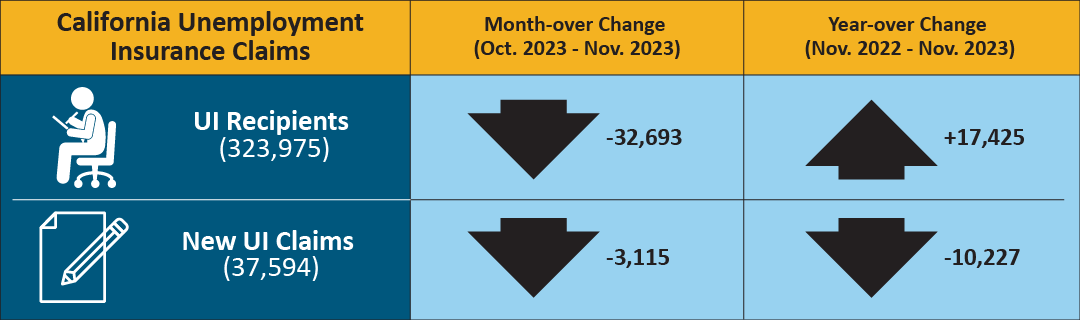
The following data is from a sample week that includes the 19th of each month: In related data that figures into the state’s unemployment rate, there were 323,975 people certifying for Unemployment Insurance benefits during the November 2023 sample week. That compares to 356,668 people in October and 306,550 people in November 2022. Concurrently, 37,594 initial claims were processed in the November 2023 sample week, which was a month-over decrease of 3,115 claims from October, and also a year-over decrease of 10,227 claims from November 2022.
| COUNTY | LABOR FORCE | EMPLOYMENT | UNEMPLOYMENT | RATE |
|---|---|---|---|---|
| STATE TOTAL | 19,382,900 | 18,436,600 | 946,300 | 4.9% |
| ALAMEDA | 832,300 | 795,200 | 37,100 | 4.5% |
| ALPINE | 510 | 470 | 40 | 7.5% |
| AMADOR | 14,470 | 13,750 | 720 | 5.0% |
| BUTTE | 91,900 | 87,200 | 4,700 | 5.1% |
| CALAVERAS | 22,350 | 21,400 | 940 | 4.2% |
| COLUSA | 10,080 | 8,930 | 1,150 | 11.4% |
| CONTRA COSTA | 554,200 | 529,500 | 24,700 | 4.5% |
| DEL NORTE | 9,290 | 8,730 | 560 | 6.0% |
| EL DORADO | 94,400 | 90,500 | 3,900 | 4.2% |
| FRESNO | 461,100 | 426,200 | 34,800 | 7.6% |
| GLENN | 12,450 | 11,740 | 720 | 5.8% |
| HUMBOLDT | 61,000 | 58,200 | 2,800 | 4.6% |
| IMPERIAL | 74,900 | 60,900 | 14,000 | 18.7% |
| INYO | 8,400 | 8,070 | 330 | 3.9% |
| KERN | 402,000 | 370,800 | 31,200 | 7.8% |
| KINGS | 57,900 | 53,300 | 4,600 | 8.0% |
| LAKE | 27,630 | 25,940 | 1,690 | 6.1% |
| LASSEN | 9,130 | 8,720 | 410 | 4.5% |
| LOS ANGELES | 4,961,500 | 4,715,200 | 246,300 | 5.0% |
| MADERA | 63,700 | 59,100 | 4,600 | 7.2% |
| MARIN | 131,600 | 126,800 | 4,800 | 3.7% |
| MARIPOSA | 7,740 | 7,360 | 380 | 4.9% |
| MENDOCINO | 36,420 | 34,690 | 1,730 | 4.8% |
| MERCED | 113,500 | 103,900 | 9,600 | 8.5% |
| MODOC | 3,180 | 3,000 | 180 | 5.8% |
| MONO | 8,730 | 8,360 | 370 | 4.2% |
| MONTEREY | 228,600 | 215,800 | 12,800 | 5.6% |
| NAPA | 70,000 | 67,400 | 2,600 | 3.7% |
| NEVADA | 47,620 | 45,650 | 1,970 | 4.1% |
| ORANGE | 1,607,700 | 1,547,000 | 60,700 | 3.8% |
| PLACER | 196,500 | 188,700 | 7,700 | 3.9% |
| PLUMAS | 7,000 | 6,550 | 450 | 6.4% |
| RIVERSIDE | 1,165,500 | 1,105,800 | 59,700 | 5.1% |
| SACRAMENTO | 737,300 | 703,200 | 34,100 | 4.6% |
| SAN BENITO | 32,800 | 30,900 | 1,900 | 5.8% |
| SAN BERNARDINO | 1,019,900 | 969,200 | 50,700 | 5.0% |
| SAN DIEGO | 1,605,800 | 1,537,900 | 68,000 | 4.2% |
| SAN FRANCISCO | 573,900 | 553,800 | 20,100 | 3.5% |
| SAN JOAQUIN | 348,500 | 326,300 | 22,200 | 6.4% |
| SAN LUIS OBISPO | 139,800 | 134,900 | 4,900 | 3.5% |
| SAN MATEO | 453,800 | 439,000 | 14,800 | 3.3% |
| SANTA BARBARA | 228,200 | 219,200 | 9,000 | 3.9% |
| SANTA CLARA | 1,055,400 | 1,014,900 | 40,500 | 3.8% |
| SANTA CRUZ | 134,300 | 126,900 | 7,400 | 5.5% |
| SHASTA | 71,700 | 67,900 | 3,800 | 5.2% |
| SIERRA | 1,290 | 1,240 | 50 | 4.1% |
| SISKIYOU | 16,810 | 15,780 | 1,030 | 6.1% |
| SOLANO | 202,900 | 193,000 | 9,800 | 4.8% |
| SONOMA | 251,300 | 242,000 | 9,300 | 3.7% |
| STANISLAUS | 247,300 | 231,600 | 15,700 | 6.4% |
| SUTTER | 46,400 | 43,100 | 3,300 | 7.1% |
| TEHAMA | 25,350 | 23,920 | 1,430 | 5.6% |
| TRINITY | 4,380 | 4,150 | 230 | 5.3% |
| TULARE | 211,000 | 189,400 | 21,600 | 10.2% |
| TUOLUMNE | 19,800 | 18,820 | 980 | 5.0% |
| VENTURA | 419,700 | 400,000 | 19,700 | 4.7% |
| YOLO | 110,100 | 104,900 | 5,300 | 4.8% |
| YUBA | 32,200 | 30,100 | 2,100 | 6.4% |
Source: CA. EDD
