


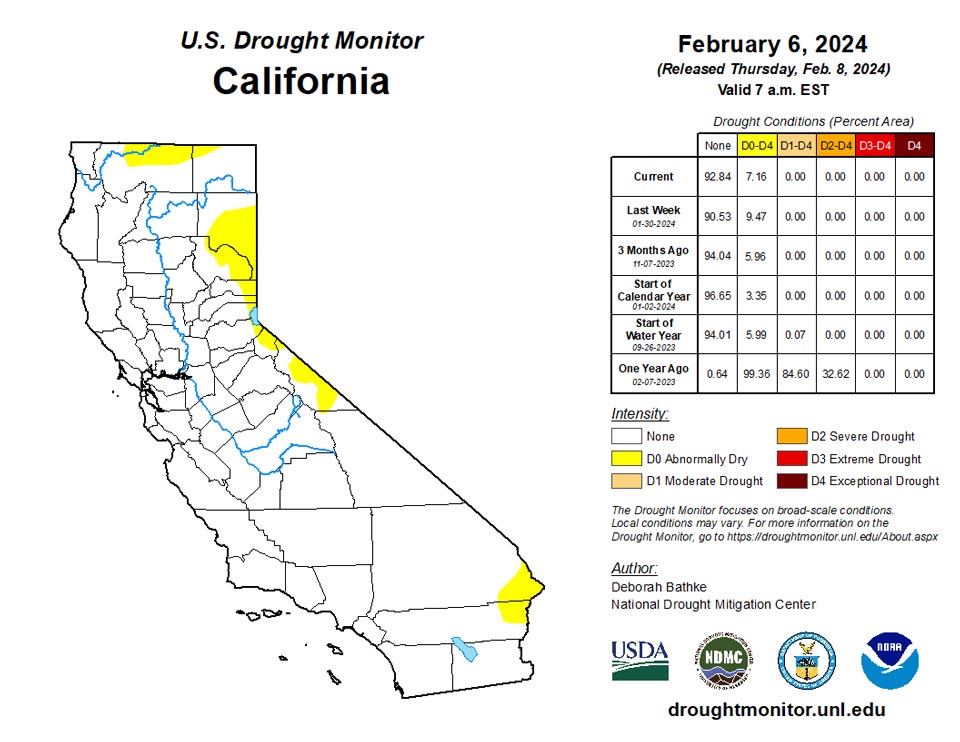
California and National Drought Summary for February 6, 2024
Summary
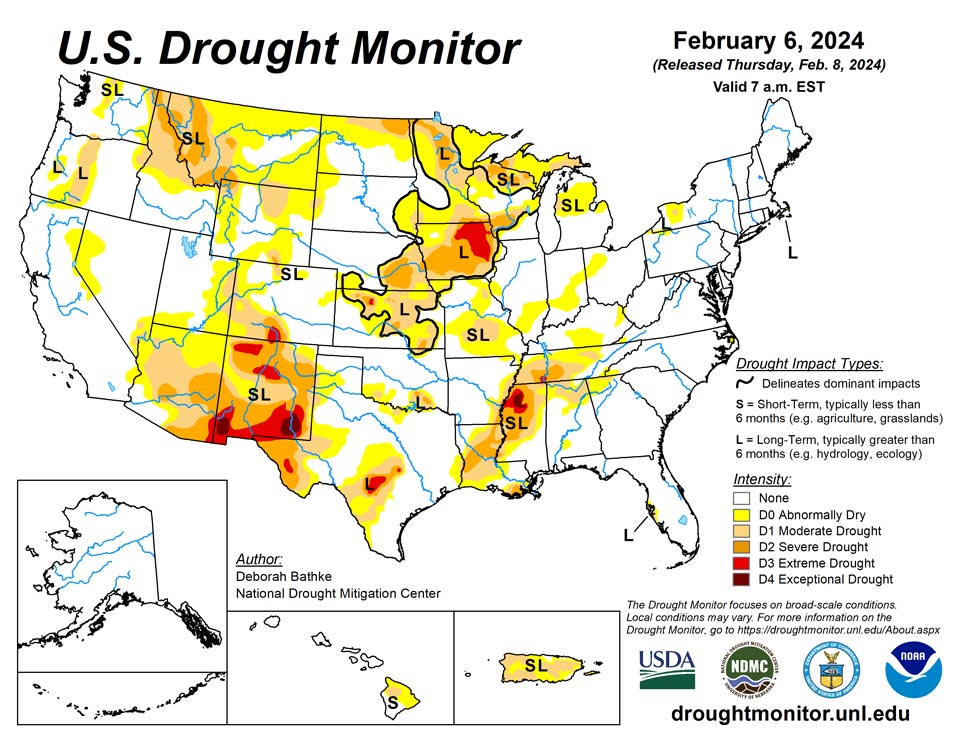
February 8, 2024 - Last week, a strong Pacific storm system brought flooding rains to California and heavy snow to the mountain ranges of Northern California and the Sierra Nevada. Parts of the state saw nearly a foot of rain from this storm, breaking long-standing records. Moisture from this system also brought rain and snow to the Pacific Northwest and inland regions of the West. Most states in the region saw pockets of improvement despite the heaviest precipitation missing many of the West’s persistent drought areas. Another round of showers and thunderstorms passed through the South and Southeast. In the last two weeks, rainfall totals of more than 10 inches fell in parts of East Texas, Louisiana, and Mississippi. The excess rain brought one and two category improvements to drought. The Northern Plains, Upper Midwest, and Northeast stayed relatively dry, with well above normal temperatures last week. Concerns continue to grow over the lack of snow this season.
Northeast
Last week’s weather was warm and dry. Daily high temperatures averaged about 3 to 14 degrees above normal with the largest departures in the western parts of the region. Precipitation was mostly less than 0.5 inches. Changes to the map include the removal of severe drought (D2) from Martha’s Vineyard. Here precipitation deficits and groundwater show improving conditions. Nantucket remains in D2 due to larger deficits and groundwater that has been slower to recover.
Southeast
Last week was wet for much of the Southeast. Rainfall totals ranged from less than 0.25 inches in the Carolinas to more than 2 inches. The continued wet weather left parts of Alabama with 200 to more than 400% of normal rainfall for the last two weeks. Much of the state saw 1- and 2-category improvements to drought conditions. The fact that drought remains shows just how dry conditions were in October, November, and December. Rainfall deficits of 5 to 7 inches over the last six months remain in northwest Georgia. Streamflow and groundwater levels also remain historically low for this time of year.
South
Another round of wet weather brought more than 3 inches of rain to parts of Texas, Louisiana, and Mississippi. Totals less than 0.25 inches fell in parts of Tennessee and Texas. The continued wet weather left parts of Alabama with 200 to more than 400% of normal rainfall for the last two weeks. Much of the state saw 1- and 2-category improvements to drought conditions. While the drought developed rapidly over the summer, improvements are slower to happen. Rainfall deficits of more than 10 inches over the last six months remain over parts of Louisiana and Mississippi. Streamflow, groundwater levels, and deeper soil moisture also remain historically low for this time of year. The fact that drought signals are still present shows how dry it was during earlier months.
Midwest
High temperatures averaged about 6 to more than 20 degrees above normal breaking records across the region. Precipitation of less than 0.25 inches fell across the eastern half of the region. Southern Missouri recorded totals of 1 to 2 inches. The rest of the Midwest was dry. After last week’s improvements, relatively few changes were made to the map this week. Abnormal dryness (D0) expanded in northeast Minnesota where state teams report a lack of snow cover, unusual for this time of year. Moderate drought (D1) improved in southwest Minnesota, one of the few places in the state to record above normal precipitation for the month of January. Improvements were also made to D0 in Ohio and Indiana.
High Plains
High temperatures averaged about 8 to more than 20 degrees above normal. Precipitation of less than 0.25 inches fell across much of the Dakotas, eastern Nebraska, and southwest Kansas. The rest of the region recorded totals ranging from about 0.25 inches to just over 1 inch. Moderate drought (D1) improved in eastern South Dakota in response to above normal precipitation during the month of January. South-central Nebraska and northern and central Kansas also saw 1-category improvements to long-term drought areas. While short-term moisture deficits have largely been eliminated, a dry signal remains at timescales longer than about 6 months. Precipitation deficits of nearly 10 inches over the last year remain in drought areas in these states and impacts to deeper soil moisture levels and groundwater continue to linger.
West
A strong storm system brought flooding rains to California and heavy snow to the mountain ranges of Northern California. Parts of the state recorded totals of 10 to 15 inches during the week, more than 600% of normal (for the same 7-day period). Moisture from this system also brought rain and snow to the Pacific Northwest and inland regions of the West. Outside of California, precipitation mostly totaled less than 3 inches. Pockets of improvements occurred in Idaho and western Montana, where recent precipitation has helped reduce drought signals in the short and longer terms. Central Arizona, the Four Corners region, and Colorado also saw improvements. A lack of snow in eastern Montana and western North Dakota led to the expansion of abnormal dryness (D0).
Caribbean
In Puerto Rico, moderate drought (D1) was reduced in the east and expanded in the west. Support for these changes includes rainfall over the last 30 to 90 days and streamflow.
The designations on all three sites are unchanged from last week, with severe long-term drought (D2) affecting St. Thomas, moderate drought (D1) affecting St. Croix, and abnormal dryness (D0) assessed for St. John.
Last week, generally 0.8 to 1.7 inches fell across the Charlotte Amalie West area on St Thomas while Nadir reported 1.2 inches; none of these totals was enough to substantially alter the long-term drought situation there.
Other locations across the Virgin Islands experienced a drier week. Totals of generally 0.2 to 0.4 inch were reported across the Cruz Bay, Myall Point, and Windswept Beach areas in St. John. Across St. Croix, 0.6 to locally 1.1 inches of rain dampened parts of the Frederiksted and Christiansted areas, but other locations reported only a few tenths of an inch.
Heavy rainfall moved into the Virgin Islands on February 7, with a few sites reporting 3.0 to 4.5 inches of rain. Since this occurred after the valid period, the effects of this rainfall will be assessed next week.
Pacific
In Alaska, no changes were made to the map this week.
In Hawaii, the last area of abnormal dryness (D0) was removed. Some areas of the island recorded the wettest January on record.
January 2024 was considerably drier than normal across the Marianas, and the first week of February continued that trend. Most sites recorded 1.8 to 3.1 inches of rain for the first month of the year, compared to normal of 3.5 to 5.3 inches, and the first six days of February brought less than one-half inch to these locations. With limited prospects for substantially increased rainfall, the recent dryness has been sufficient to intensify the drought designation to D1 (moderate drought) at Guam, Rota, and Saipan from D0 last week.
Rainfall has been slightly above normal in Palau recently, sufficient to keep up with demand. January brought just shy of 14 inches, compared to a normal of of 11.1 inches. As a result, no drought designation is assessed there.
In western Micronesia, Yap and Ulithi are experiencing severe drought (D2) due to conditions over the past 3 to 5 months. January was the third straight month with under 75 percent of normal rainfall at Ulithi, and the fifth consecutive drier-than-normal month at Yap. The three-month November – January period brough 14.2 inches of rain to Ulithi (normal 21.6 inches) and 16.2 inches to Yap (normal 25.7 inches). These totals are considerably less than what is needed to keep up with demand long-term (about 24 inches for the 3-months). The dry pattern has continued into February, with only a few tenths of an inch falling on both locations over the first six days of the month, when typically, over an inch would’ve fallen.
Across central Micronesia, a broken pattern of dryness extends west-to-east from Woleai and Lukunor (both D0) across Pohnpei and Pingelap (both D1). This represents a 1-class deterioration at Pingelap, where January brought only about 4.2 inches of rain, compared to a normal approaching 13 inches. This is considerably less than what is needed to keep up with demand. January was somewhat more generous at the other three locations, with Woleai reporting about 5 inches (normal 7.5 inches), Lukunor just under 5.5 inches (normal 9.2 inches), and Pohnpei 6.7 inches (normal 13.2 inches). January was the second consecutive month with near or less than half of normal at Pingelap, and the third straight month under 75 percent of normal at Pohnpei. Nine of the last 12 months through January brought subnormal precipitation to Lukunor. Woleai received 10.5 inches for December – January, compared to a normal of 17 inches. For at least the last two full months, these amounts were less than needed to keep up with demand. Rainfall totals ticked up in early February at Pohnpei, where over 2.3 inches fell during the first six days of the month, but only about an inch fell during the same period at Lukunor, and just a couple tenths at most were reported at Woleai and Pingelap.
Rainfall has been more generous at locations in north-central, south-central, and far eastern Micronesia. Chuuk recorded over 10 inches of rain in January while Kapingamarangi, Nukuoro, and Kosrae received 15 to 18 inches for the month. This is well above the amount needed to keep up with demand at these sites. Rainfall remained abundant for the first six days of February at Chuuk and Kosrae (3.2 and 4.4 inches, respectively), keeping any dryness-related impacts well at bay. In contrast, little rainfall was observed during these days at Kapingamarangi and Nukuoro, but antecedent conditions have been more than sufficiently wet to stave off any impacts for the immediate future.
Kwajalein and Wotje, in the northern Marshall Islands, are experiencing moderate drought (D1). This represents a 1-class deterioration at Kwajalein from abnormal dryness (D0). Only 1.7 inches of rain fell on Kwajalein during January (40 percent of normal), and just a few tenths of an inch dampened the site during February 1 – 6. Above-normal precipitation fell on Wotje in January after five consecutive drier-than-normal months, but this amounted to just 3.6 inches, as January begins several months that are climatologically drier than other times of the year. These amounts are not sufficient to keep up with demand each month.
Heavy precipitation has fallen recently across the southeastern Marshall Islands, where both Mili and Majuro improved to D0 (abnormally dry) from D1 (moderate drought) last week. After subnormal rain for the past few months, between 6.3 and 7.1 inches soaked these locations during the first six days of February, which was enough to noticeably ease antecedent dryness.
Ailinglapalap and Jaluit in the southwestern Marshall Islands reported 2 to 4 inches of rain in early February, following January totals of 8.6 and 7.5 inches, respectively. Although rainfall totals for December and January were slightly less than what is generally needed to keep up with demand at Jaluit, antecedent wetness and the wet start to February have held off any dryness-related impacts there. At Ailinglapalap, amounts have consistently been at least sufficient to keep up with demand for several months. Thus, no dryness designation is assessed at either location.
Located in the Southern Hemisphere, this is the wetter time of year in American Samoa, in contrast to the other affiliated islands in the Northern Hemisphere. After an exceptionally dry November, rainfall has been abundant at Pago Pago through early February. Over 50 inches of rain fell during this period at the airport, compared to a normal of about 28.5 inches. This is far more than necessary to keep up with demand, so no dryness designation is assessed in American Samoa.
Looking Ahead
The National Weather Service Weather Prediction Center forecast (valid February 7 – 10, 2024) calls for another round of rainfall to sweep across California and into the Desert Southwest. High elevation snow is expected over mountains in the West with a wintry mix (freezing rain, sleet, and snow) over the northern Plains and upper Midwest. Heading into the weekend, the extended forecast (valid February 10 - 14, 2024) calls for a band of heavy rain across the South and Southeast. High temperatures are expected remain above average across central and eastern parts of the country. The Climate Prediction Center’s 6-to-10-day outlook (valid February 13 – 17, 2024) calls for an increased probability that observed temperatures, averaged over this 7-day period, will be above normal across the Upper Midwest, the west Coast, and Alaska. Temperatures across the remaining parts of the country are expected to be near to below normal. The pattern of increased precipitation across California and the southern tier of the continental U.S. (CONUS) is expected to continue, while much of the remaining CONUS, eastern Alaska, and the Big Island of Hawaii are expected to have below or near-normal precipitation.
Author(s):
Deborah Bathke, National Drought Mitigation Center
Richard Tinker, NOAA/NWS/NCEP/CPC
Dryness Categories
D0 Abnormally Dry—used for areas showing dryness but not yet in drought, or for areas recovering from drought.
Drought Intensity Categories
D1 Moderate Drought
D2 Severe Drought
D3 Extreme Drought
D4 Exceptional Drought
Drought or Dryness Types
S Short-term, typically less than 6 months (agriculture, grasslands)
L Long-term, typically more than 6 months (hydrology, ecology)
SL Area contains both short- and long-term impacts
Source: National Drought Mitigation Center
