


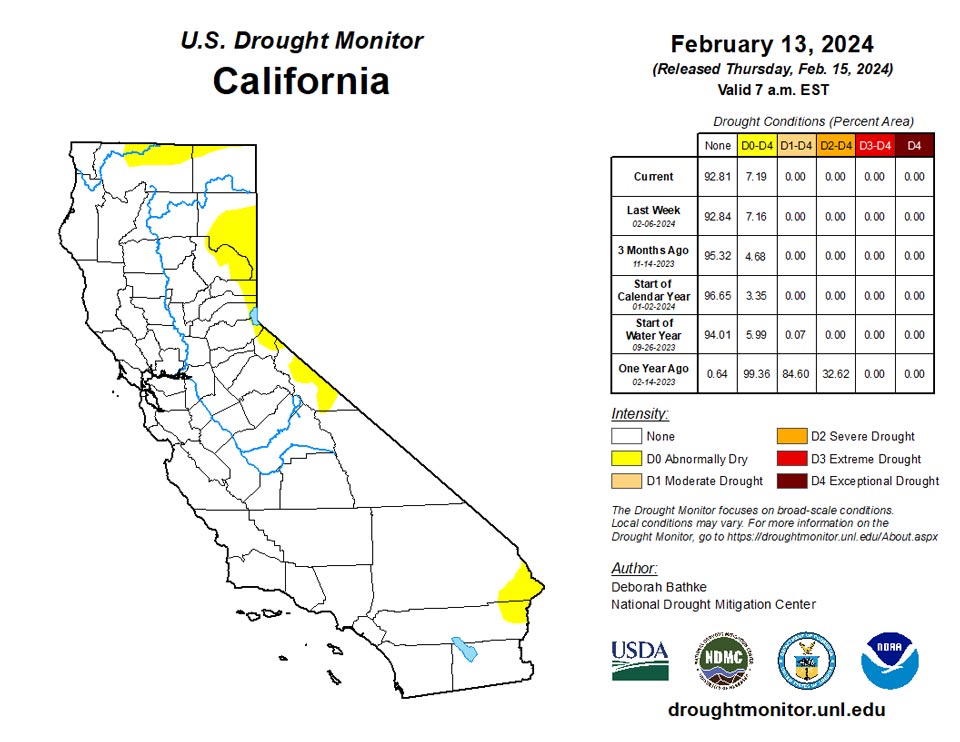
California and National Drought Summary for February 13, 2024
Summary
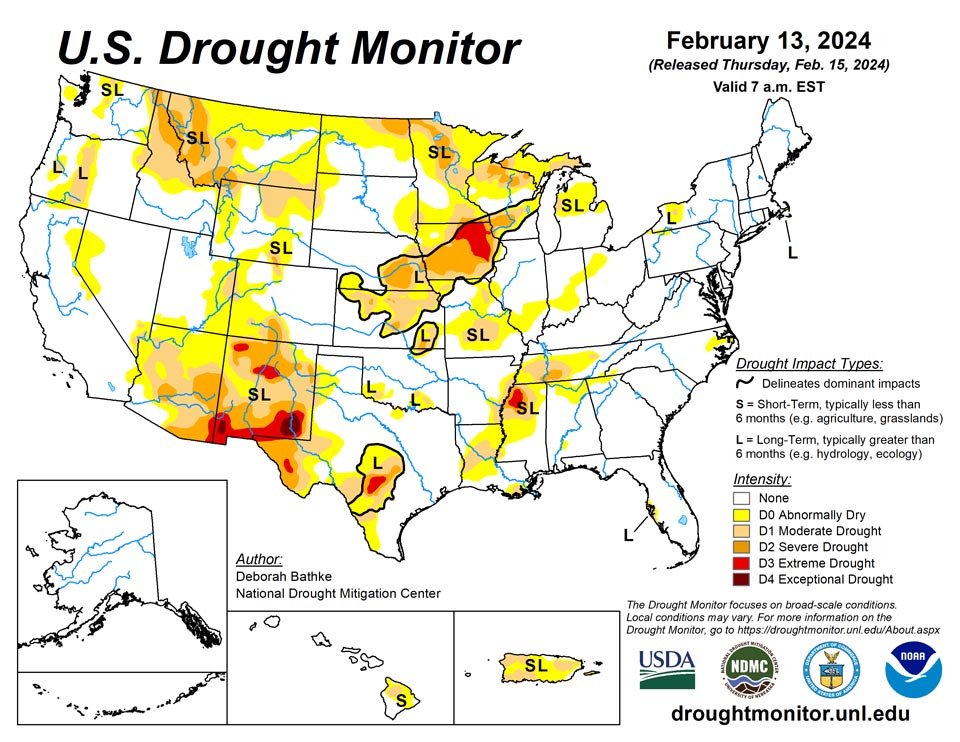
February 15, 2024 - Last week, another round of Pacific storms swept across the West, bringing rain and mountain snow. Storms left over 3 feet of snow in the northern Arizona mountains before dropping more than a foot of snow in the mountains of Colorado and New Mexico. After a slow start to the year, basin snowpack in the Southwest has returned to near-normal conditions. Southwestern states saw improvements to short- and long-term drought conditions. In the Northwest, basin snowpack remains below normal with some of the worst conditions in the northern Rocky Mountains. The lack of snow led to the expansion of drought conditions. The wet pattern continued in the South and Southeast. In the last 30 days, rainfall totals of more than 10 inches (200 to 400 percent of normal) fell in parts of the South and Southeast.
The excess rain brought additional one- and two-category improvements to drought. The Northern Plains and Upper Midwest stayed relatively dry, with temperatures well above normal for the second week in a row. States in the Southern Plains saw pockets of improvements as long-term moisture deficits are finally showing signs of improvement. The winter storm that brought heavy snow to the Northeast on Wednesday occurred at the data cutoff for this week’s map.
Northeast
No changes were made to the map in the Northeast. Moderate drought (D1) remains in western New York and Martha’s Vineyard. Nantucket remains in severe drought (D2). The heavy snow from Wednesday’s winter storm will be evaluated on next week's map.
Southeast
Last week was wet for much of the Southeast. Rainfall totals ranged from less than 0 in parts of Florida to nearly 4 inches in parts of Georgia. When combined with the previous week’s rainfall, parts of Alabama and Georgia recorded totals of 10 to 12 inches — 200 to 400% of normal — over the last 30 days. All remaining moderate drought (D1) was removed with abnormally dry conditions (D0) left to reflect areas with lingering long-term moisture and groundwater deficits. D0 expanded in eastern North Carolina, where rainfall deficits of close to 3 inches over the last 30 days can be found. Here, streamflow has fallen below normal and well levels have dropped.
South
Another round of wet weather brought 2 to 4 inches of rain to parts of Louisiana, Mississippi, and Tennessee. The continued wet weather left a band, stretching from east Texas to northeast Alabama, with rainfall totals of 6 to 12 inches — 200 to 400 percent of normal —over the last 30 days. Much of the region saw 1- and even 2-category improvements to drought conditions. All exceptional drought (D4) has been eliminated. Moderate (D1), severe (D2), and extreme (D3) drought remain in the region where drought signals can still be found in long-term indicators. Despite the record-breaking rainfall over the last several weeks, deficits of 4 to 10 inches over the last six months remain over parts of many parts of the region. Groundwater levels and deeper soil moisture also remain historically low for this time of year in some places. West Texas was the only area where drought expanded. Moderate drought (D1) was added in response to growing long-term moisture deficits and impacts to soil moisture, groundwater, and vegetation.
Midwest
High temperatures averaged from 7 to 20 degrees above normal. Precipitation was less than 1 inch across most areas. Changes to the map were limited areas of D0 (abnormal dryness). D0 expanded in Wisconsin and near St. Louis in response to the recent warm dry weather and lowered streamflow values. D0 was removed southeast Missouri, where rainfall totals have been above normal.
High Plains
High temperatures averaged about 8 to more than 20 degrees above normal. Precipitation of less than 0. 5 inches fell across much of the Dakotas, Nebraska, and Kansas. Southwest Nebraska, Kansas, and eastern Colorado saw 1-category improvements to long-term drought areas. Short-term moisture deficits have largely been eliminated. A dry signal remains in Nebraska and Kansas at timescales longer than about 6 months and moisture deficits linger in deeper soil levels and ground water. Moderate drought (D1) expanded in western South Dakota, near the Black Hills, and northeast Wyoming due to a lack of snow and below-normal soil moisture levels.
West
Pacific storms swept across the West again this week, bringing rain and mountain snow. Over 3 feet of snow fell in the northern Arizona mountains. The mountains of Colorado and New Mexico saw over a foot in some locations. The recent storms brought some of the best snowfall totals to date for this year’s snow season. Basin snowpack in the Southwest has returned to near-normal conditions, prompting improvements to areas of moderate (D1), severe (D2), extreme (D3), and exceptional (D4) drought. The largest improvements occurred in New Mexico and southwest Colorado. In the Northwest, basin snowpack remains below normal with some of the worst conditions in the northern Rocky Mountains. This lack of snow led to the expansion of D1 across southern Montana, northern Wyoming, central Idaho, and south-central Oregon. D2 expanded in eastern Idaho and western Montana. D1 improved in southern Washington and northern Oregon where above-normal precipitation over the last six months has helped reduce long-term moisture deficits.
Caribbean
In Puerto Rico, last week’s rain event brought improvements to moderate drought (D1) in the western, central, and southeast parts of the island. Local drought experts note improvements to streamflow, soil moisture, and vegetation.
Abundant rainfall was recorded across most of the Virgin Islands this past week, especially early in the period. Although the precipitation caused some localized flooding, it brought notable improvement to the dryness and drought that has been affecting the region.
The heaviest rains were observed on St Croix. Rohlsen Airport in Christiansted reported just over 4.5 inches of rain for the week, but several sites around the city reported 5.3 to 7.9 inches. Meanwhile, a few locations in and around Frederiksted reported 4.0 to 4.7 inches. The soaking rains brought robust relief from the dry conditions affecting the region. Leaving St. Croix with no dryness designation after experiencing moderate drought (D1) last week – a two-classification improvement. The one-month SPI is an extremely wet 2.79 at Rohlsen Airport, and only long-term SPI are negative (no shorter than 9 months).
A few locations around Charlotte Amalie on St. Thomas reported just shy of 3 inches of rain while a couple of other locations reported closer to 2 inches, but data there may be incomplete. Rainfall was sufficient to improve the dryness designation by one class, to moderate drought (D1) from severe drought last week.
On St. John, Windswept Beach reported approximately 4 inches of rain last week while 3.3 to 4.4 inches fell across the Cruz Bay area, and 2 inches were recorded at Myall Point. The soaking rains were enough to bring an end to abnormal dryness on St. John, and there is no longer any dryness designation there.
Pacific
In Alaska, no changes were made to the map this week.
In Hawaii, moderate drought (D1) expanded on the Big Island along the northeast slope of Mauna Kea in response to reports of increased dryness. Abnormal dryness (D0) was removed from the north and east sides of the island to align with streamflow and recent rainfall reports.
It was considerably drier than normal across the USAPI in general last week, although there were a few exceptions. Several inches of rain fell on American Samoa, the southernmost reaches of Micronesia, and southeastern portions of the Marshall Islands. In addition, portions of Palau reported almost two inches of rain. Elsewhere, totals were generally under an inch, which is considerably less than what is generally needed to keep up with demand.
Sites on Palau reported 1.1 to 1.8 inches of rain last week, which is a little drier than what is optimal, but earlier rainfall has February totals near 5 inches, which is about normal. Prior to this, almost 14 inches of rain fell during January. Thus, no dryness designation is indicated here.
It was very dry across the Marianas this past week. Rainfall totals generally ranged from a few hundredths of an inch to at most 0.2 inch (Saipan). So far in February, less than one-half inch has fallen, where normal ranges from 1.2 to 2.4 inches. In January, 1.8 to 3.0 inches were reported across the islands, which was 48 to 58 percent of normal. These amounts are considerably below the rate of 4 inches per month generally needed to keep up with demand, and D0 (abnormal dryness) remained unchanged from the prior week.
Across Micronesia, Kapingamarangi reported over 5.4 inches, mostly early in the period. Otherwise, amounts ranged from about 0.1 to 0.6 inch.
In western Micronesia, Yap and Ulithi remained in severe drought (D2). February rainfall so far has totaled only 0.9 to 1.2 inches (about one-third to one-half normal), and since November, Yap has received about 17.1 inches (normal 28.5 inches), and Ulithi 15.4 inches (normal 23.8 inches). These totals are considerably under the 8 inches generally required to keep up with demand. Meanwhile, at Woleai, about 1.6 inches of rain has fallen in February (58 percent of normal), and for December-January, totaled 10.4 inches (normal near 17 inches). Due to the increasing deficits, and being considerably drier than the 8 inches per month generally needed to keep up with demand, Woleai was degraded this week to moderate drought (D1), up from abnormally dry last week.
Conditions are better across central Micronesia; specifically (north to south) Chuuk, Lukunor, Nukuoro, and Kapingamarangi. Wetness dates back a few months at Kapingamarangi, where the 5.5 inches for February-to-date follows over 17 inches in January, precluding any dryness-related impacts. Meanwhile, Chuuk reported 10 to 22 inches of rain for each of the last 10 full months, and Nukuoro recorded over 40 inches for November-January; thus, despite subnormal February precipitation, these sites also have no dryness designation. The lone site experiencing some observable degree of dryness in central Micronesia is Lukunoch/Lukonor. Only one-third of normal rainfall has been reported for February 1-12, and January, with 5.4 inches of rain, was the driest month since September 2022. With the last six weeks bringing much less than the 8 inches per month generally needed to keep up with demand, Lukunoch/Lukunor remained in abnormal dryness (D0) this week.
In eastern Micronesia, conditions at Pingelap deteriorated to D2 (severe drought, intensification from D1 last week), Pohnpei persisted in abnormal dryness (D0), and Kosrae (near the Marshall Islands) remained free of any dryness or drought. Just under 10.5 inches of rain fell on Pingelap for December-January (normal 25.6 inches), and only 0.2 inch fell for February 1-13 (less than 5 percent of normal). The December-to-date total of near 10.7 inches is less than 40 percent of normal (30.4 inches) and considerably under the 8 inches per month considered ideal. Deterioration to D2 was based primarily on the extreme scarcity of rain in the past two weeks, following two sharply dry months. February rainfall has been more generous at Pohnpei (about 2.5 inches), but still only 60 percent of normal. Both December (less than 7.8 inches) and January (just 4.4 inches) were much drier than normal, and below the optimum threshold of about 8 inches per month. Since February has not been as excessively dry at Pohnpei as at Pingelap, the former site remained in moderate drought (D1) as it was last week. Kosrae has been wetter than the other two aforementioned locales, reporting about 4.6 inches of rain so far in February, which is a bit over 80 percent of normal, and above the 8-inch-per-month rate considered optimal. January totals there topped 15 inches which, while considerably below the large climatological normal, is well over the requisite 8 inches per month, so Kosrae remained dryness-free (no designation).
Most locations in the Marshall Islands are experiencing some degree of notable dryness, with the most acute conditions extending across the northern tier of the country – specifically, Kwajalein (moderate drought, D1) and Wotje (severe drought, D2). Meanwhile, three sites in southern and eastern parts of the Islands were all experiencing abnormal dryness (Majuro, Mili, and Jaluit, all D0). The only reporting site free of significant dryness is the west-central location of Ailinglapalap.
Wotje, which is climatologically the driest of the USAPI sites, reported 21.5 inches of rain for September-December (normal 28.9 inches). January was wetter than normal, but this is during the dry season, and the monthly total was only 3.6 inches. February has been even drier, with 0.35 inch recorded during the first 13 days of the month (about 58 percent of normal). The combination of longer-term deficits, greater vulnerability due to the drier climatology, and the acutely dry February-to-date totals prompted deterioration to D2 (severe drought) this week.
Kwajalein was relatively wet during mid- to late-autumn, but December was slightly drier than normal, and conditions dried out even more beginning in January. Through February 13, the year-to-date total of 2.4 inches is well under both the normal (5.4 inches) and the preferred average of about 8 inches per month to keep up with demand. Moderate drought (D1) persisted here from last week.
Across the southern and east-central Marshalls, the December-January two-month period was considerably drier than normal at Majuro (12.3 inches, 62 percent of normal) and Jaluit (13.6 inches, about two-thirds normal). At Mili, totals were closer to normal at 17.9 inches. All of these locations are near or slightly wetter than normal for February so far. As a result, abnormal dryness (D0) was introduced this week at Kwajalein while Majuro remained at D0 (abnormally dry), the same as last week. Conditions are more marginal at Mili, but with amounts for the last few weeks below the preferred 8 inches per month, abnormal dryness (D0) remained unchanged from last week there.
In the west-central Marshalls, Ailinglapalap remained free of any dryness or drought designation. Only somewhat more than half of normal rainfall was observed February 1-13, but rainfall was adequate during December-January (17 inches total) and abundant the prior two months (October-November total approached 34 inches). Despite the recent drop in rainfall, antecedent conditions have kept obvious dryness-related impacts at bay so far.
February is shaping up to be the third consecutive month with excessive rainfall in American Samoa. To date, February has brought over 14 inches of rain to Pago Pago. Earlier in the winter, 44 inches was recorded for December-January (normal about 29 inches), precluding any dryness-related impacts for now and the immediate future.
Looking Ahead
The National Weather Service Weather Prediction Center forecast (valid February 15 – 17, 2024) calls for another round of rainfall to push into the West Coast, bringing heavy rain and high elevation snow to the Cascades, Sierra Nevada, and the Northern Rockies. Polar air from Canada is expected to bring cold, dry air into the Northern Plains. Snow is expected across the Central Plains and Ohio Valley. Heading into the weekend, the extended forecast (valid February 17 - 21, 2024) calls for increased chances of multiple atmospheric river events for parts of central and southern California. Areas of lighter precipitation may spread across other parts of the west. The Upper Midwest and Northeast may see some snowfall. Storms tracking across the Gulf of Mexico may bring rain to Florida. The Climate Prediction Center’s 6-to-10-day outlook (valid February 20 – 24, 2024) calls for an increased probability of above-normal temperatures across most of the continental U.S. (CONUS) and Alaska. Temperatures across southern California, the East Coast, and northern Alaska are expected to be near to below normal. Increased precipitation is expected across California, the interior West, southern Alaska, and the Northeast. Much of the remaining CONUS, northern Alaska, and the Big Island of Hawaii are expected to have below- or near-normal precipitation.
Author(s):
Deborah Bathke, National Drought Mitigation Center
Richard Tinker, NOAA/NWS/NCEP/CPC
Dryness Categories
D0 Abnormally Dry—used for areas showing dryness but not yet in drought, or for areas recovering from drought.
Drought Intensity Categories
D1 Moderate Drought
D2 Severe Drought
D3 Extreme Drought
D4 Exceptional Drought
Drought or Dryness Types
S Short-term, typically less than 6 months (agriculture, grasslands)
L Long-term, typically more than 6 months (hydrology, ecology)
SL Area contains both short- and long-term impacts
Source: National Drought Mitigation Center
