


California and National Drought Summary for April 2, 2024
Summary
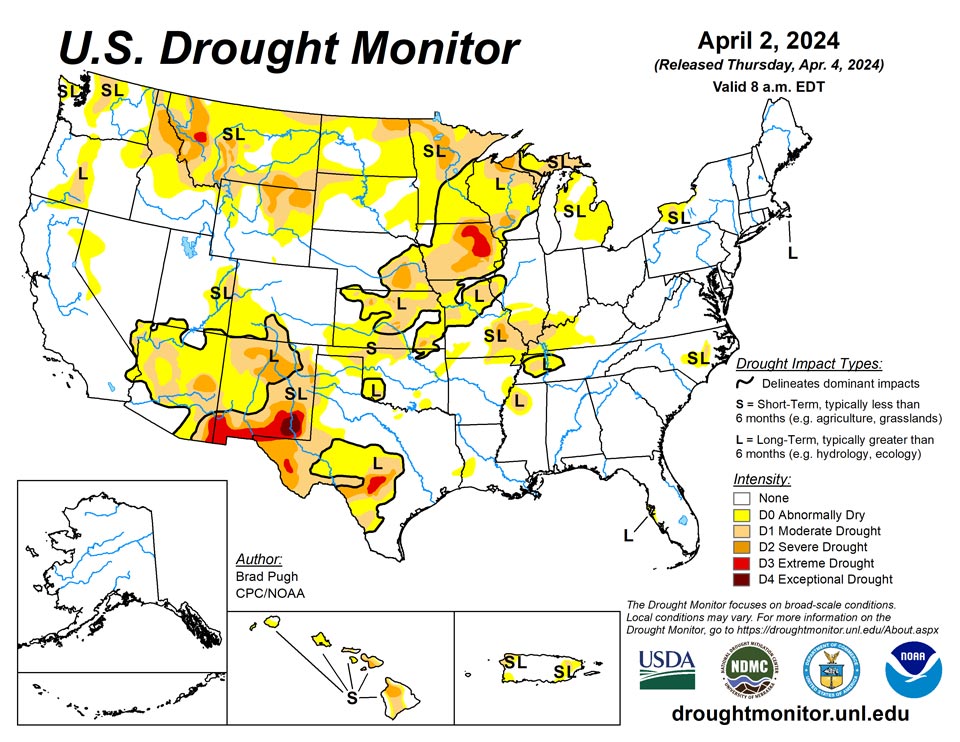
April 4, 2024 - An active early springtime pattern continued through late March and into the beginning of April. A pair of low pressure systems and trailing cold fronts tracked across the east-central contiguous U.S. (CONUS). A swath of 1 to 3 inches of precipitation supported improvements extending from parts of the Midwest to southeastern Kansa and northeastern Oklahoma. However, moderate drought (D1) was introduced to the lower Ohio Valley which has missed out on precipitation during the late winter and early spring. Increasing short-term dryness and periods of enhanced winds led to expansion of abnormal dryness (D0) and moderate drought (D1) in southwestern Kansas, northwestern Oklahoma, and western Texas. March was relatively wet across Arizona where additional improvements were warranted before a drier time of year sets in later this spring. Below-normal snowpack supported an increase in D1 across the northern Cascades of Washington. 7-day (March 26 to April 1) temperatures averaged below (above)-normal across the western and north-central (eastern) CONUS. Alaska remains drought-free, while leeward sides of Hawaii had a broad 1-category degradation. Following recent improvement across much of Puerto Rico, no changes were made this past week.
Northeast
No changes were made to the moderate drought (D1) for Nantucket since the heaviest precipitation (more than 1.5 inches) fell to the west. The other D1 area in western NY was mostly dry this past week and no changes were necessary. However, there was a slight increase in the surrounding abnormal dryness (D0).
Southeast
Nearly all of the Southeast remains drought-free after the wet El Nino winter. Only a small area of moderate drought (D1) is designated for eastern North Carolina. The surrounding abnormal dryness (D0) was reduced slightly after a week of 1 to 2 inches of precipitation.
South
Major drought relief, associated with El Nino, occurred this past winter across the lower Mississippi Valley. However, there remains a lingering long-term drought across parts of western Tennessee and northern Mississippi. On April 1, locally heavy rainfall (more than 1.5 inch) resulted in small improvements to northeastern Oklahoma. Farther to the west across the southern high Plains, short-term dryness is increasing. Enhanced winds, elevated wildfire risk, and blowing dust have been quite frequent the past few weeks due to low pressure systems forming to the lee of the Rockies. Based on 30 to 60-day SPI, an expansion of abnormal dryness (D0) and moderate drought (D1) was warranted for parts of northwestern Oklahoma and western Texas.
Midwest
Heavy precipitation (1 to 3 inches, locally more) prompted 1-category improvements throughout southern Michigan, Ohio, Indiana, Illinois, Missouri, and eastern Iowa. However, the lower Ohio Valley continues to miss out on late winter and early spring precipitation which led to an expansion of moderate drought (D1) for this region. 30 to 60-day SPI, soil moisture, and 28-day streamflows support the current drought depiction across parts of the lower Ohio and middle Mississippi Valleys. Following last week’s broad improvements across the upper Mississippi Valley, no changes were made this week with much of this region receiving less than 0.5 inch of precipitation, liquid equivalent. Despite the improvements the past two weeks throughout much of the Midwest, long-term drought indicators continue to support varying levels of drought intensity including extreme drought (D3) in northeastern Iowa. According to USDA’s National Agricultural Statistics Service, 59 percent of Iowa topsoil moisture is rated as short to very short.
High Plains
The northern to central Great Plains along with the central Rockies remained either status quo this week or had a 1-category improvement. Locally heavy precipitation (more than 1 inch) led to targeted improvements across southeastern Kansas. Lighter precipitation (0.25 to 1 inch) supported minor improvements to South Dakota. Based on SPIs at various time scales along with snow water equivalent close to average, improvements were necessary for parts of northern Colorado and southern Wyoming. 30-day SPEI and GRACE-based soil moisture supported a large increase in abnormal dryness (D0) across southwestern Kansas along with a slight expansion of moderate drought (D1) to the west of Wichita.
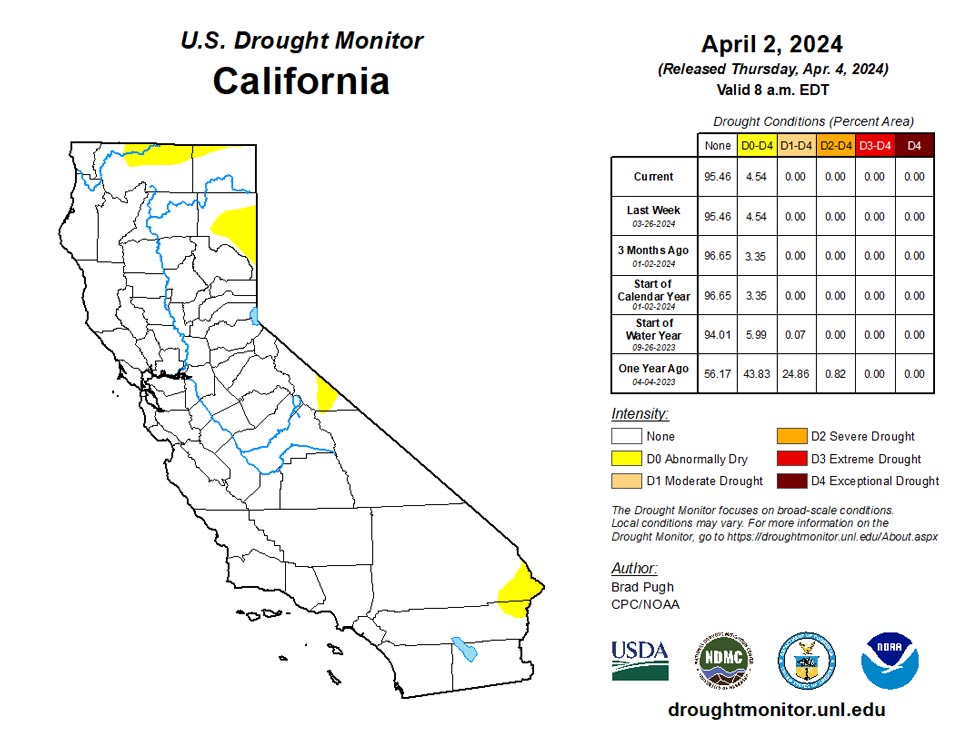
West
Multiple low pressure systems and enhanced onshore flow resulted in above-average precipitation for much of Arizona, Utah, Nevada, and California from March 26 to April 1. According to the California Department of Water Resources on April 2, snow water equivalent (SWE) averaged at or slightly above normal for the Sierra Nevada Mountains. A relatively wet March and widespread precipitation amounts of 0.5 to 1 inch, liquid equivalent, this past week supported improvements for Arizona. Given the recent precipitation, the drought impact was modified to reflect only long-term drought for most of Arizona. This region will be reevaluated next week and additional revisions may be warranted. Eastern and southern New Mexico have remained mostly dry during the past 30 days. According to USDA’s National Agricultural Statistics Service, 81 percent of New Mexico topsoil moisture is rated as short to very short. Washington, northern Idaho, and western Montana have below-normal SWE heading into early April. Abnormal dryness (D0) and moderate drought (D1) was expanded across the northern Cascade Mountains of Washington due to this low snowpack.
Caribbean
No changes were made to Puerto Rico this past week. Abnormal dryness (D0) and moderate drought (D1) continues for parts of the northwest and eastern interior. A drying trend is noted along southern coastal areas.
Mostly dry and stable conditions dominated the region during the first half of the drought week (Wed, March 27-Tue, April 2, 2024), coincident with weak surface ridging. During the second half of the drought week, a weak front north of the region provided variable to showery weather across the Islands, as associated moisture fragments continued to filter in to the region. No adjustments were made to the station depictions this week, based on unusually heavy rainfall received in February, and considering this is the height of the dry season across the USVI.
Volunteer (CoCoRaHS) rainfall observations across the USVI were on the light side this week, as would be expected during the climatological height of their dry season. On St. Croix, amounts ranged from 0.00-inch at VI-SC-24 (Christiansted 2.1 ENE), VI-SC-20 (Frederiksted 1.7 ESE), Henry Rohlsen Airport, and East Hill, to 0.09-inch at VI-SC-34 (Frederiksted 1.9 NE). Rohlsen Airport reported a total rainfall of 0.68-inch for the entire month of March, though it must be noted there have been problems with the rainfall recording equipment for much of this past winter. The Adventure 28 USGS Well water level fell slightly this week from 30.44 feet below the land surface (8am March 27) to 30.54 feet (8am April 2). No change was rendered to St. Croix’s drought depiction this week.
On St. John, rainfall measurements ranged from a tenth of an inch at VI-SJ-5 (Cruz Bay 1.6 E) to 0.19-inch at VI-SJ-4 (Cruz Bay 0.8 NE). The observation from VI-SJ-3 (Windswept Beach) fell right in-between at 0.14-inch of rain. Total rainfall during March at Windswept Beach was 1.05 inches, which is less than the 1984-2023 mean of 1.72 inches, with March typically being the driest month of the year. The last time March rainfall topped 3 inches at this location was in 2004. The Susannaberg USGS Well water level fell about a half-foot this past week, from 10.63 feet below the land surface (8am March 27) to 11.18 feet (8am April 2). Given these values, and Windswept Beach’s Standardized Precipitation Index (SPI) values of -0.71 (1-month), +0.73 (3-month), +0.46 (6-month), +0.49 (9-month), and +0.15 (12-month), St. John’s drought depiction was not changed this week.
St. Thomas received the heaviest precipitation amounts this week of the three islands. Station VI-ST-13 (Charlotte Amalie 1.2 NNW) measured nearly a half-inch (0.48-inch), VI-ST-15 (Charlotte Amalie West 1.3 N) recorded 0.21-inch, with the lowest amount at VI-ST-5 (Charlotte Amalie West 4.2 WNW) where only 0.02-inch of rain fell. The Grade School 3 USGS Well water level fell slightly this week from 7.77 feet below the land surface (8am March 27) to 7.86 feet (8am April 2). Given this week’s short-term rainfall, there was no reason to include an “S” in the drought label, so the current D0(L) depiction remains status quo.
Pacific
Alaska remains drought-free and no abnormal dryness is depicted. Snow water equivalent is running near to above-normal for much of the state.
Persistent trade winds during the past two weeks have resulted in drying conditions for the leeward side of the Hawaiian Islands. Based on this recent drying trend along with streamflows and pasture reports, a 1-category degradation was made to the leeward side of Kauai, Oahu, Molokai, Lanai, Maui, and the Big Island.
Several weak surface troughs and/or shear lines moved across the Marianas during the past drought week (Wed, March 27-Tue, April 2, 2024), bringing elevated wind speeds and fire danger to Guam. These stronger winds combined with Keetch-Byram Drought Index (KBDI) values in excess of 700 (indicative of extreme fire danger), and very dry fuels resulted in Red Flag Warnings being issued. Multiple brief surges in the trade winds and a round of surface trade-wind convergence brought scattered showers and some thunderstorms to eastern Micronesia. A dry trade-wind pattern prevailed across western Micronesia, with increasing dryness and drought across that region. During the latter half of the drought week, a weak cyclonic circulation center developed accompanied by persistent convection. However, the predicted track of this system keeps the bulk of the precipitation south of Palau and well to the south of Weno (in Chuuk State of the Federated States of Micronesia (FSM)) and Yap, and is unlikely to bring much needed drought relief. Across the South Pacific, surface ridging to the south of American Samoa favored fairly dry but breezy conditions, though towards the end of the drought week a weak trough was approaching the region from the north, resulting in increased shower activity for American Samoa.
Satellite-based estimates of tropical precipitation during the past week showed a pronounced boundary near 7N-8N latitude, separating lighter rainfall amounts (<0.75-inch) to the north and heavier amounts (>1.5 inches) to the south. On the south side of the boundary, estimated precipitation amounts rose rapidly from about 1.5 inches on the low end to 4-8 inches on the high end. Over the South Pacific, there were widespread 1-2 inch+ precipitation amounts in the vicinity of American Samoa.
In the Republic of Palau, weekly precipitation measurements ranged from 0.65-inch at the Palau International Airport (Airai) to 0.81-inch (2-days missing) at the Koror COOP, falling well short of the 2-inch weekly minimum required to meet most water needs. Palau experienced a long stretch of “wet” weather from May 2023 through February 2024. This long stretch came to an end in March 2024 when only 3.56 inches of rain fell for the entire month in Airai. For the time being, the Republic of Palau maintains a drought designation of D0(S).
The western FSM (Federated States of Micronesia) continues to experience drought ranging from moderate (D1) to extreme (D3). The worst conditions are in Yap where only a meager 0.02-inch of rain (1-day missing) fell this week. The monthly precipitation amounts received in the prior two months (February and March 2024) were 2.84 inches and 0.68-inch, respectively, both being far short of the 8-inch monthly minimum required to meet most water needs. There are reports of stressed vegetation (including coconuts) in Yap, along with fresh water shortages. These rainfall amounts, the noted impacts, and xmACIS monthly ranked precipitation percentiles for March and Feb-Mar (2nd and 7th driest periods, respectively, support the continuation of Yap’s D3(S) drought depiction this week. With the dryness dating back to last November, it may soon be necessary to include longer-term effects in the impacts label, i.e. D3(SL). Gilman and Rumung also reported very dry conditions during March, with the totals being 1.49 inches and 0.91-inch, respectively. Ulithi and Woleai (3-days missing) also received paltry amounts of rain this past drought week, with these stations registering only 0.06-inch and 0.05-inch of rain, respectively. During March, these stations reported 1.20 inches and 2.44 inches (3-days missing) of rain, respectively. Based on these numbers and recent precipitation rankings, Ulithi retains its D2(S) drought designation this week, and Woleai keeps its D1(S) designation. Stations in the central and eastern FSM have fared much better recently compared to the western FSM, with conditions ranging from no drought/dryness at Lukunor, Nukuoro, Kapingamarangi, Pohnpei, and Kosrae, to moderate drought (D1-S) at Chuuk Lagoon and Pingelap. For Lukunor, the accumulated precipitation for this week, and for the month of March are, respectively, 1.85 inches (3-days missing) and 14.17 inches, so this locale continues to be dryness and drought-free. For Nukuoro, 0.83-inch and 12.49 inches of rain fell in the rain gauge (respectively) which keeps them free of any drought or dryness. Nukuoro has been wet every month from May 2023 through March 2024, with the sole exception being February 2024 when only 2.93 inches of rain fell. Similar conditions are noted at Pohnpei and Kosrae, where the last week/last month precipitation pairs are 1.58 inches and 12.02 inches at Pohnpei, and 1.95 inches and 12.70 inches at Kosrae. Near Pohnpei, Mwoakilloa reported 8.06 inches of rain for the month of March, which just satisfies the 8-inch minimum requirement. Of all the USAPI stations this week that continue to do well, Kapingamarangi has received the most precipitation by far, reporting 5.43 inches this week, a whopping 22.43 inches of rain in March, and 5 of the past 6 weeks have been “wet”. Pingelap received 1.30 inches (1-day missing) of rain this week and 8.50 inches during March. The xmACIS data for March shows a precipitation rank of 13, 35 years of good data, and a resulting percentile of 0.371, which is indicative of no dryness or drought. Based on these indicators, Pingelap’s drought depiction was improved this week from D1(S) to D0(S). Elsewhere, Chuuk and North Fanif received 0.60-inch (2-days missing) and 0.08-inch of rain, respectively, with March rainfall totals of 3.30 and 2.11 inches. Chuuk retains its D1(S) drought designation this week, though recent precipitation rankings indicate a potential degradation to D2(S) fairly soon if things don’t improve. No analysis was performed at Fananu this week due to missing data.
Across the Commonwealth of the Northern Mariana Islands (CNMI), moderate to severe drought (D1-D2) persists. On Saipan, precipitation measurements this past drought week ranged from 0.08-inch at the National Park Service (NPS) site to 0.20-inch at both the ASOS site (2-days missing) and the Saipan International Airport’s manual gauge. March precipitation at these 3 Saipan sites were, respectively, 0.47-inch, 1.61 inches, and 1.57 inches, all less than half of the 4-inch monthly minimum requirement to meet most water needs. Within the last two weeks, 16 grass fires were reported on Saipan. For now their drought designation remains D2(S). A total of 8 grass fires were reported on Tinian in the last two weeks, with a third of an inch of rain measured this past week (1-day missing), and 1.75 inches observed for the month of March (2-days missing). On Guam, 0.53-inch of rain fell this week, while volunteer (CoCoRaHS) observations depicted rainfall amounts ranging from 0.97-inch to 2.56 inches during March. These monthly amounts remain well below the 4-inch minimum requirement, and February was also a dry month with 1.89 inches recorded. A number of grass fires were reported over the Easter weekend, which varied in size, but all remained controllable. Guam retains its D2(S) designation this week. Other precipitation amounts received across the CNMI this past week included Agat (0.62-inch), Rota (0.64-inch, retains D1(S) depiction), and Dededo (0.57-inch).
The Republic of the Marshall Islands (RMI) also received meager precipitation amounts this past drought week, as it remained north of the sharp precipitation gradient noted earlier in the synopsis. Kwajalein measured a scant 0.02-inch of rain this week, and 4.61 inches during March (4-days missing). As this is Kwajalein’s second consecutive dry week, their D1(S) depiction remains. Ailinglaplap reported 0.37-inch of rain this week, and 3.15 inches during March, retaining its D0(S) designation. Jaluit, Wotje, and Majuro reported 0.00-inch, 0.00-inch, and 0.14-inch of rain, respectively, this week. Their monthly rainfall totals were 6.39 inches, 0.00-inch, and 1.08 inches. This marks the tenth consecutive dry week in Wotje. For the most recent month of March, Wotje’s precipitation ranking was 1. With 28 years of good data, the resulting percentile is 0.036, which is consistent with its current D3(SL) depiction. The times series graph for the Majuro reservoir shows a steady decline in water level during the month of March, from 25.1 million gallons to 20.2 million gallons. This reflects a 20% drop in water level just in the past month. The maximum storage for this reservoir is 36 million gallons. Jaluit and Majuro retain their current depictions of D0(S) and D2(S). No analyses were performed this week at Utirik and Mili due to missing data.
South of the equator, dryness and drought-free conditions continued across American Samoa. Pago Pago reported 1.89 inches of rain this week and 8.93 inches in March, easily surpassing both the weekly and monthly minimum water requirements of 1-inch and 4-inches, respectively. For the higher elevation sites of Siufaga and Toa Ridges, the weekly and monthly precipitation totals were, respectively, 3.54 and 11.12 inches, and 1.26 and 6.30 inches. The island of Tutuila therefore remains dryness and drought-free.
Looking Ahead
During the next five days (April 4-8, 2024), drier weather is forecast to overspread the Midwest and East behind a cold front. Another low pressure system is forecast to track inland to the West with another round of rain and high-elevation snow from California east to the north-central Rockies. Later on April 8, precipitation is expected to develop across the southern Great Plains and lower Mississippi Valley.
The Climate Prediction Center’s 6-10 day outlook (valid April 9-13, 2024) depicts a pattern change by mid-April with a drying trend for the West. Below-normal precipitation is favored for this region along with the northern Great Plains. Elsewhere, across the central to southern Great Plains, Midwest, and East, above-normal precipitation is more likely. Above-normal temperatures are favored for much of the lower 48 states except for parts of New Mexico and western Texas where increased below-normal temperature probabilities are forecast.
Author(s):
Brad Pugh, NOAA/CPC
Anthony Artusa, NOAA/NWS/NCEP/CPC
Dryness Categories
D0 Abnormally Dry—used for areas showing dryness but not yet in drought, or for areas recovering from drought.
Drought Intensity Categories
D1 Moderate Drought
D2 Severe Drought
D3 Extreme Drought
D4 Exceptional Drought
Drought or Dryness Types
S Short-term, typically less than 6 months (agriculture, grasslands)
L Long-term, typically more than 6 months (hydrology, ecology)
SL Area contains both short- and long-term impacts
Source: National Drought Mitigation Center
