


California and National Drought Summary for March 8, 2016
Summary
Early in the period, a ridge of high pressure over the Southwest directed Pacific storm systems into the Northwest, bringing persistent unsettled weather to Washington and Oregon but dry and warm weather further south. Meanwhile, an upper-air trough of low pressure over the East steered these Pacific storms southeastward across the Midwest which then tracked northeastward into New England. Since these systems were moisture-starved and moving rather fast, precipitation that fell on parts of the Southeast, Ohio Valley, and Northeast was mostly light. Later in the period, however, a change in the upper-air pattern allowed Pacific storm systems to move farther southward into California. This brought the state some badly-needed precipitation after rather dry and mild conditions the past 3 weeks caused a sharp decline in the Water Year-To-Date (WYTD) precipitation and snow pack that were both above-normal in early February. In the meanwhile, warmer and drier weather enveloped the eastern third of the Nation. As the period ended, the California storm began to impact the southern Plains. Showers and thunderstorms developed in north-central Texas and eastern Oklahoma late Monday, and expanded and intensified across the southern Plains and Delta after the 12 UTC (7 am EST) Tuesday Drought Monitor cutoff time. Therefore, the appropriate improvements in these two regions will be made next week. Weekly temperatures averaged above-normal in the West and Plains, and subnormal in the eastern third of the Nation. Light to moderate showers fell across Puerto Rico, while Alaska and Hawaii were quite dry. Unseasonably mild air persisted across Alaska - just like much of this winter.Northeast
Generally light precipitation (less than an inch) fell on much of New England and the mid-Atlantic as temperatures averaged near to below normal. After last week’s widespread moderate to heavy precipitation and 1-category improvements, this week’s totals were not enough to remove the lingering D0 in eastern New England. In the mid-Atlantic, however, the remaining D0 area in the central Appalachians saw little or no precipitation this week, and after missing out on the previous week’s heavy totals, a slight northward and southward expansion of abnormal dryness was made to reflect the short-term (60- and 90-days) deficiencies. Although 7-, 14-, and 28-day USGS average stream flows were normal to much above normal in the Northeast, the instantaneous and daily (Mar. 8) values depicted some below-normal flows in the central Appalachians and coastal New England. On a side note, this winter’s unseasonably mild air, especially in December, has caused a “snow drought” in upstate New York. This has hurt the ski industry as the precipitation has mainly fallen as rain instead of snow – a sharp contrast as compared to the previous winter.Southeast
While parts of the Southeast (from central Mississippi eastward into western South Carolina) received between 1 to 2 inches of rain, areas to the south and north observed less, especially southeastern Georgia (less than 0.5 inches) and Florida (little or no rain), excluding the Panhandle (0.5-1.4 inches). Outside of the June-September summer tropical months, March should be the wettest time of the year in southeastern Georgia. As a result, short-term (90-day) deficiencies continued to grow, while field measured 12-inch topsoil moisture in this area has nosedived at Nahunta, GA (Brantley County). In northeastern Florida, the lack of normal rainfall and recent cool but dry (low humidity) weather has produced “crunchy” conditions (fire weather lingo), raising fire danger concerns. Although the KBDIs (fire danger indices) are not exceptionally dry, WYTD dryness is pronounced (50-75% of normal). Accordingly, D0 was increased into coastal Georgia and northeastern Florida.Lower Mississippi Valley (Delta)
As of the 12 UTC (7 am EST) Tuesday, March 8 cutoff, little or no precipitation had fallen across most of the Delta, except for 0.5 to 1 inches across central Arkansas and northern Mississippi during Day 1 (24-hours ending 12 UTC Mar. 2). But on Day 7 (24-hours ending 12 UTC Mar. 8), a potent and moisture-laden storm system was just developing over the southern Plains, poised to drop heavy rains on the southern Plains and Delta the following days. However, based upon the cutoff period, short-term (90-day) deficits of 4-8 inches had accumulated over most of Louisiana, southeastern Arkansas, and southwestern Mississippi. Therefore, D0 was expanded to encompass the largest shortages and lowest percent of normal precipitation (50-75%), albeit this D0 area will be short-lived based upon 24-hour (Mar. 9) observed and expected heavy rainfall over the next few days.Southern Plains
Similar to the lower Mississippi Valley, the first 6 days of the period were dry and warm, with temperatures averaging 6 to 12 degF above normal. By Day 7, however, the California storm system had just entered the southern Plains, and showers and thunderstorms rapidly developed in parts of central and northern Texas and eastern Oklahoma overnight Monday into Tuesday (March 8) morning. However, the only D0 area to be impacted (improved) by the Day 7 rains was in west-central Texas (near San Angelo and Abilene), with the other rainfall occurring over non-drought portions. With many tools showing short-term dryness at the 2- and 4-month time frames, and where no rain fell before the 12 UTC Tuesday, March 8 cutoff, D0 was expanded in eastern Texas (and into Louisiana), D1 was slightly increased in extreme south Texas (Starr and Hidalgo counties) – where no February rain was measured at McAllen, Harlingen, Brownsville, and Port Isabel - new and expanded D0 in the Panhandle (which extended northward into Oklahoma, Colorado, and Kansas), and a new D1 area in the northeastern Texas Panhandle (and northwestern Oklahoma).Central and Northern Plains
In association with the D0 and D1 in the Texas Panhandle and no Day 7 rainfall, short-term dryness (at 30-, 60-, and 90-days), unseasonable warmth, low humidity, and occasional gusty winds, plus with less residual moisture from the November and December storms, abnormal dryness was increased into southeastern Colorado, southwestern Kansas, north-central Oklahoma and the Panhandle. A new D1 area was drawn in Roger Mills and Ellis Counties where 90-day percentages were 25-50% of normal. Although February was quite dry in eastern Kansas (and southwestern Missouri), reports on the ground indicated no issues yet. Examples included intermittent streams still flowing, full ponds, and running springs as residual moisture from November and December storms persisted.Farther north, adjustments were made to the D0 and D1 areas in the Dakotas, western Minnesota, and eastern parts of Montana and Wyoming based upon short-term dryness (or wetness) at 60- and 90-day station data (ACIS) using percent of normal (PNP) and SPI, the lack of decent snow cover this winter, and the greatest positive temperature anomalies during these periods. In general, the consensus for D0 is more of a concern for limited soil moisture in the near future if the temperature and precipitation patterns persist. With respect to changes, D0 was extended southward into south-central North Dakota, across extreme northern South Dakota (where 90-day PNPs were below normal and temperatures well above normal), and west-central Minnesota (similar conditions to South Dakota). In contrast, the short-term indicators were wet in southeastern Montana and northeastern Wyoming, thus D0 was removed there.
Rockies, Intermountain West, and Southwest
In the northern Rockies, a reassessment and update of monthly tools (with February now in the books) indicated modifications were needed in most of western Montana, southeastern Washington, Idaho, eastern Oregon, and northeastern Nevada. A continued active winter weather pattern brought 1 to 2 inches of precipitation to northern and central Idaho, northwestern Montana, and parts of eastern Washington and Oregon, keeping WYTD basin average precipitation above normal, and basin average snow water content (SWC) near normal. In much of the northern Rockies, most river basins have achieved 80% of their annual peak snowpack, with snows still accumulating in the higher elevations, and lower elevation snows melting out and filling reservoirs. Therefore, a 1-category improvement was made in much of the northern Rockies. Some D1 and D2 was kept in basins with lower WYTD precipitation and SWC, such as southern part of Idaho’s Big Lost River basin, and D2 in northwestern Montana where WYTD basin average precipitation is 76% and SWC at 68%. In southern Idaho, recent rains have started the melt out in the Owhyee basin, and the Mountain Home irrigation district in Elmore County is seeing reservoirs filling that were completely dry for the past few years. To the west in north-central Oregon, continued wet weather (0.5-1.5 inches) has maintained above-normal WYTD precipitation and SWCs that continue to fill reservoirs, thus D1 was removed. No changes were made in the central Rockies and Intermountain West as most locations received light precipitation (0.5-1 inches), not enough for improvement but enough to hold off deterioration. The WYTD basin average precipitation and SWC in this area remained near to above normal.In the Southwest, however, moisture from the Western storms failed to reach southeastern California, southern Nevada and Utah, and most of Arizona and New Mexico. 3-month SPEIs (December-February) were driest in southern California, southern Nevada, and most of Arizona and western New Mexico. Although WYTD basin average precipitation was near normal in central Arizona and western New Mexico, the SWC had dropped to near zero in some areas, and 10-25% elsewhere. To the north and west, however (e.g. southern Utah and Colorado, northern New Mexico), WYTD basin average precipitation was above normal, and basin average SWCs were close to or above normal. Accordingly, D2 was expanded into the Yuma, AZ area, D1 was extended eastward into extreme southeastern California and western Arizona, and D0 now covered most of Arizona. Impacts from the short-term dryness were difficult to find as much of this region is irrigated. As of Feb. 29, percent of average reservoir storage ranged from 81-89% in central Arizona, but only 27-32% in western New Mexico and southeastern Arizona.
The Far West
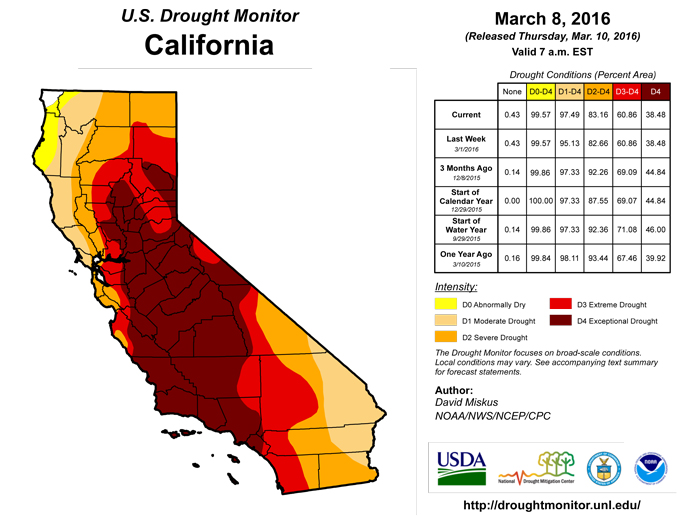
Early in the period, a series of storms dropped ample precipitation on the Pacific Northwest, but bypassed most of California. Fortunately, a change in the upper-air pattern around mid-week allowed the storms to shift southward, bringing welcome precipitation to all of California except the extreme southeastern sections (see Southwest). Most locations from western Washington southward to south-central California, including the Sierra Nevada and Cascades, received 3 to 6 inches, with 8 to 12 inches locally in the Olympic Peninsula, portions of coastal northern and central California, and the northern Sierras. While the precipitation was beneficial in California, dry and warm weather during the previous 3 weeks halted the normal increase in snow pack in the Sierras, stalled the accumulated WYTD precipitation, and decreased the normal inflow into streams and reservoirs. In addition, the storm was rather mild, with freezing levels above 8000 feet in the Sierras, and not the best for building snow packs in lower elevations. For example, after decent December and January precipitation and snowfall, the Feb. 2 northern, central, and southern Sierras, and the state SWCs (inches) stood at 22.7, 21.3, 16.4, and 20.2, respectively, or above normal (107-120%) for this day. By March 8 (after the storms), however, they stood at 22.5, 23.2, 19, and 21.8, respectively, or below normal (79-86%) for this day. With February normally one of the wettest months of the year in California, the state was primed to see big increases in the WYTD precipitation and snow pack, but instead those last 3 weeks of the month stalled or lowered these figures. Precipitation-wise, as of March 9, the northern, central (San Joaquin), and southern (Tulare basin) Sierra station indices rebounded back above normal, standing at 42.1 inches (115%), 31.9 inches (109%), and 22 inches (105%), respectively. More good news from the recent storm was that reservoir storages did increase from the heavy rains and snowmelt from the lower elevations. For example, selected reservoirs depict the differences between Feb. 1 versus March 8 historical averages/capacities (percent): Shasta 52/77 vs 68/90; Oroville 44/67 vs 61/86; Don Pedro 41/59 vs 50/70; San Luis 34/43 vs 45/52; Exchequer 14/29 vs 23/43. Reservoirs in the south, however, lost capacity as significant precipitation fell to the north (e.g. Castaic 34/41 vs 30/34; Perris 36/44 vs 34/41). Therefore, considering that this storm basically negated the decline caused by the prior 3 weeks of dryness and warmth, no changes were made this week. However, with the state now recharged with short-term moisture, any additional precipitation, especially from a colder system (e.g. lower elevation snows), should provide some improvement to the state, especially in northern and central areas.Alaska, Hawaii, and Puerto Rico
In Hawaii, mostly dry weather prevailed as rainfall was limited to a few light scattered showers on the windward sides. This week’s changes included a downgrade from D0 to D1 on the Big Island to encompass all of North and South Hilo districts. Water haulers were doing brisk business due to demand from residents on water catchment, mainly in the Puna District (east side) of the Big Island. Coffee and tropical fruit growers on the Kona side of the Big Island stated that they were losing seedlings and even some older trees, while pastures on the southeast side of the Big Island were deteriorating. Year-to-date rainfall and deficits (inches) through Mar. 8 included: Honolulu 0.45 -4.39; Lihue 1.32 -6.76; Kahului 5.35 -3.59; Hilo 4.93 -17.15. The rest of the islands were not changed.In Alaska, little or no precipitation fell across the entire state, with less than an inch limited to parts of the south-central coast, and temperatures continued to average well above normal. As of March 1, NRCS mountain snowpack was generally close to normal (between 70-129%) thanks in part to a very snowy November (and even with a dry and mild winter), and in better shape than last year at this time. One area of concern is the southeastern Panhandle with 50-69% of normal snow pack mainly due to the unseasonable warmth melting the snow at lower elevations. Even so, this year was better than last year when values were even lower. No changes were made in Alaska this week.
In Puerto Rico, widespread showers dropped 0.5 to 3.5 inches of rain on most of the island, thereby preventing any deterioration but not enough to warrant any improvement. Rainfall during the past 60- and 90-days was above normal in the western and southern sections, and subnormal in northeastern areas. An area to watch for possible future deterioration was in the north-central portion of the island (currently D0) just west of San Juan as average 7-, 14-, and 28-day USGS stream flows were at or near record low flows as of March 8.
Looking Ahead
During the next 5 days (March 10-14), an ongoing storm in the southern Plains and Delta (as of Wed., Mar. 9) is expected to slowly track northeastward, dumping heavy rains (more than 2 inches, locally to 10 inches in Louisiana) on the southern Plains, lower and middle Mississippi, Tennessee, and Ohio Valleys, and New England. This is expected to cause localized flooding in many parts of the Delta (and did in northern Louisiana Tuesday night). In the Far West, Pacific storm systems are forecast to drop heavy precipitation (8-14 inches) on western sections of Washington, Oregon, and northern and central California, including the Cascades and Sierra Nevada, with lesser totals (up to 4 inches) in the northern Rockies. In addition, temperatures should be much lower with this set of storms as compared to the early March storm, producing more snow for the Cascades and Sierra Nevada. Unfortunately, little or no precipitation is expected in-between these two large events (Southwest, central and southern Rockies, northern and central High Plains). Temperatures will also average well above normal from the Rockies eastward.For days 6-10 (March 15-19), the odds favor above median precipitation in the Rockies, northern Plains, eastern half of the Nation (except southern Florida), and southern Alaska. Below median precipitation probabilities were found in the Far West, Southwest, south-central Plains, southern Florida, and northern Alaska. The eastern half of the U.S. and southern Alaska will see good chances for above normal temperatures, while near to below normal readings are likely in the West and northern Alaska.
Author(s):
David Miskus, NOAA/NWS/NCEP/CPC
Dryness Categories
D0 ... Abnormally Dry ... used for areas showing dryness but not yet in drought, or for areas recovering from drought.Drought Intensity Categories
D1 ... Moderate DroughtD2 ... Severe Drought
D3 ... Extreme Drought
D4 ... Exceptional Drought
Drought or Dryness Types
S ... Short-Term, typically <6 months (e.g. agricultural, grasslands)L ... Long-Term, typically >6 months (e.g. hydrology, ecology)
Source: National Drought Mitigation Center
