


Important Note: The employment data for the month of May 2026 comes from the survey week that included May 12. The release date for June 2026 data is scheduled for release on July 17.
June 20, 2026 - SACRAMENTO — California gained 3,100 nonfarm payroll jobs1 in May 2026 as the State’s unemployment rate held steady at 5.3 percent2, maintaining the rate of the past three months according to the latest Employment Development Department (EDD) data, which comes from two separate surveys. The total nonfarm employment for April was revised up (+3,300), resulting in a zero change in the job total for that month.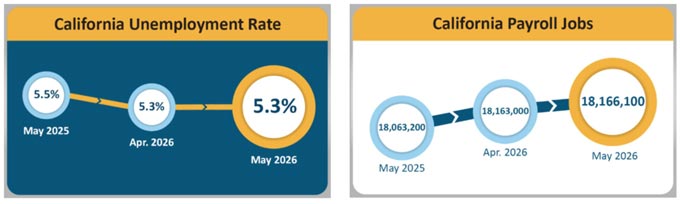
California's Labor Market, by the Numbers...
- California added 103,600 jobs since the beginning of 2026, averaging 20,720 jobs per month. Over that period, the State accounted for 18.2 percent of the nation’s total job growth (+569,000), which is well above its usual 11.4 percent monthly share of U.S. total nonfarm jobs.
- Over the past year, California’s employment rate has declined by 0.2 percentage points while the nation’s rate has held steady.
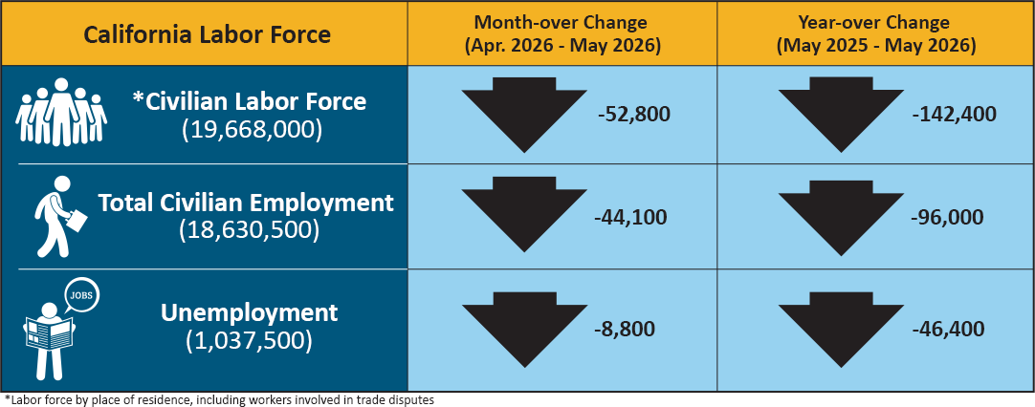
- May marks the State’s sixth consecutive monthly decline in the number of unemployed Californians (-8,800), totaling 56,600 fewer persons over that timeframe.
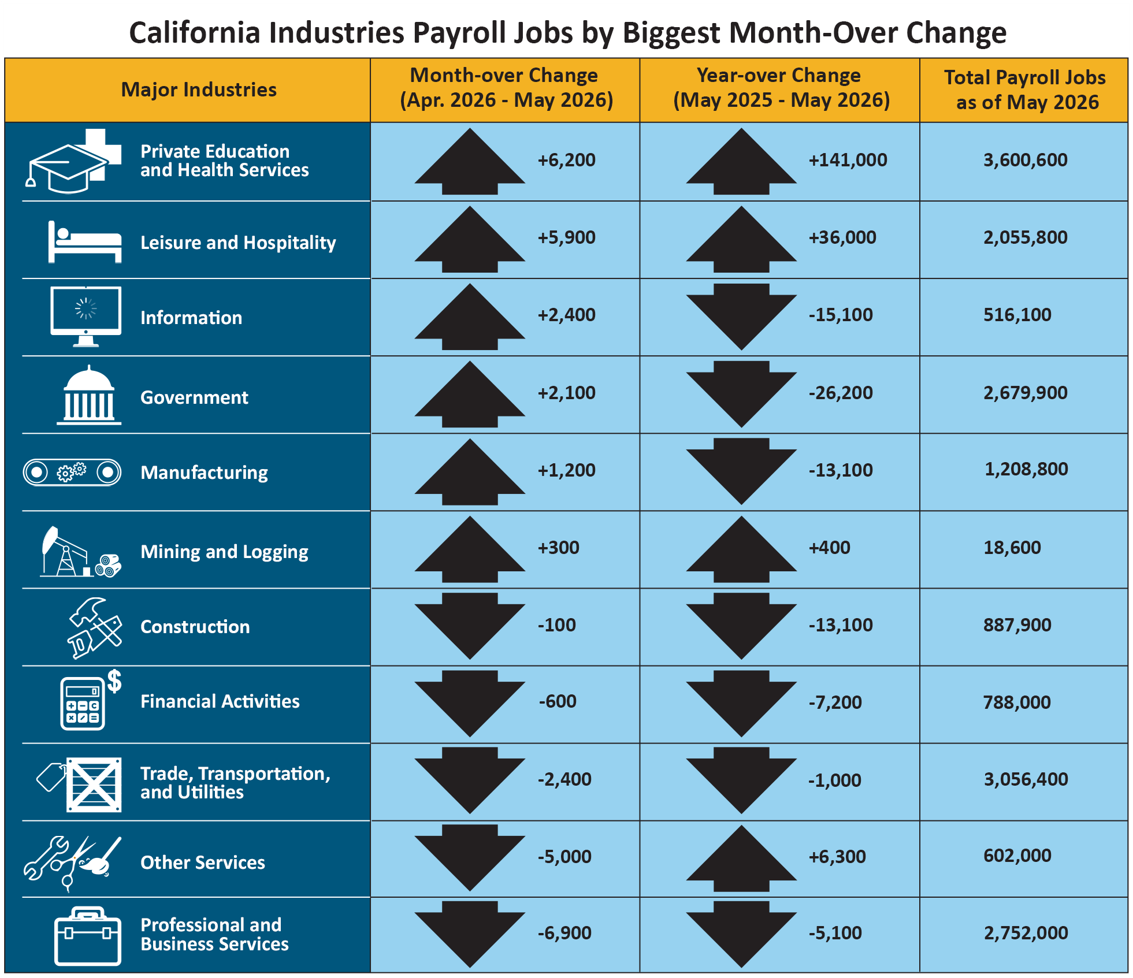
- Six of California's 11 industry sectors added jobs in May, led once again by gains in Private Education & Health Services (+6,200). All of the gains came from Health Care and Social Assistance, with significant gains in Ambulatory Heath Care Services, Individual and Family Services, and Social Assistance as California’s population continues to age.
- Leisure & Hospitality (+5,900) also saw an increase driven by gains in Performing Arts, Spectator Sports, and Related Activities, as well as Amusement Parks and Arcades and Other Amusement and Recreation Industries. However, this gain was smaller than usual for May.
- Professional & Business Services (-6,900) posted the State’s largest month-over job loss with declines in Accounting, Tax Preparation, and Bookkeeping Services, as well as Computer System Design and Related Services.
1. The nonfarm payroll job numbers come from a federal survey of 80,000 California businesses.
2. The unemployment rate comes from a separate federal survey of 4,400 California households
Data Trends about Jobs in the Economy
Total Nonfarm Payroll Jobs (Comes from a monthly survey of approximately 80,000 California businesses – seasonally adjusted)
- Month-over – Total nonfarm jobs in California’s 11 major industries amounted to 18,166,100 in May – a gain of 3,100 from April. This followed April’s upward revision of 3,300 jobs, resulting in no month-over April change in jobs.
- Year-over – Total nonfarm jobs increased by 102,900 (0.57 percent increase) from May 2025 to May 2026 compared to the U.S. year-over gain of 503,000 jobs (0.32 percent increase).
Total Farm Jobs – The number of jobs in the agriculture industry decreased by 8,300 in April to a total of 409,600 jobs in May. The agriculture industry had 12,300 more farm jobs in May 2026 than it did in May 2025.
Data Trends about Workers in the Economy
Employment and Unemployment in California (Based on a monthly federal survey of 4,400 California households which focuses on workers in the economy)
- Employed – The number of Californians employed in May was 18,630,500, a decrease of 44,100 from April and down 96,000 compared to May of last year.
- Unemployed – The number of unemployed Californians was 1,037,500 in May, a decrease of 8,800 from April and a decrease of 46,400 from May 2025.
Data Trends Accordion Panel
Unemployment Insurance Claims (Not Seasonally Adjusted)
The following data is from a sample week that includes the 19th of each month:
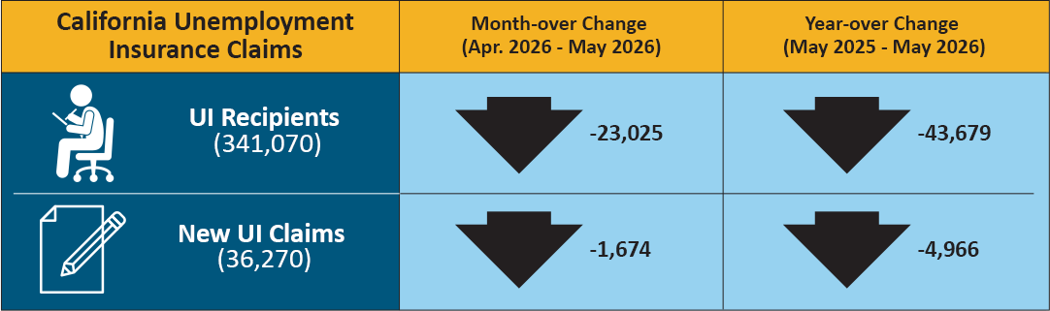
In related data that figures into the State’s unemployment rate, there were 341,070 people certifying for Unemployment Insurance (UI) benefits during the May 2026 sample week. That compares to 364,095 people in April and 384,749 people in May 2025. Concurrently, 36,270 initial claims were processed in the May 2026 sample week, which was a month-over decrease of 1,724 claims from April and a year-over decrease of 4,966 claims from May 2025.
| County | Labor Force | Employment | Unemployment | Rate |
|---|---|---|---|---|
| State Total | 19,475,800 | 18,554,800 | 921,100 | 4.7% |
| Alameda | 851,400 | 818,800 | 32,600 | 3.8% |
| Alpine | 440 | 400 | 40 | 9.8% |
| Amador | 15,040 | 14,300 | 740 | 4.9% |
| Butte | 89,900 | 85,200 | 4,700 | 5.2% |
| Calaveras | 17,350 | 16,420 | 930 | 5.4% |
| Colusa | 11,550 | 10,220 | 1,320 | 11.4% |
| Contra Costa | 571,800 | 549,100 | 22,700 | 4.0% |
| Del Norte | 9,240 | 8,730 | 510 | 5.6% |
| El Dorado | 89,300 | 85,500 | 3,800 | 4.2% |
| Fresno | 478,100 | 442,600 | 35,500 | 7.4% |
| Glenn | 11,690 | 10,950 | 740 | 6.3% |
| Humboldt | 59,800 | 57,200 | 2,600 | 4.3% |
| Imperial | 73,500 | 61,100 | 12,400 | 16.9% |
| Inyo | 8,290 | 7,980 | 310 | 3.7% |
| Kern | 409,400 | 375,600 | 33,800 | 8.3% |
| Kings | 60,000 | 55,200 | 4,800 | 8.0% |
| Lake | 26,410 | 24,820 | 1,590 | 6.0% |
| Lassen | 8,080 | 7,630 | 450 | 5.6% |
| Los Angeles | 5,018,200 | 4,755,700 | 262,500 | 5.2% |
| Madera | 71,400 | 66,400 | 5,000 | 7.0% |
| Marin | 122,500 | 118,300 | 4,200 | 3.4% |
| Mariposa | 7,430 | 7,060 | 380 | 5.1% |
| Mendocino | 36,540 | 34,860 | 1,690 | 4.6% |
| Merced | 123,600 | 112,800 | 10,800 | 8.8% |
| Modoc | 3,070 | 2,900 | 170 | 5.7% |
| Mono | 8,520 | 8,230 | 290 | 3.5% |
| Monterey | 225,900 | 212,600 | 13,300 | 5.9% |
| Napa | 75,100 | 72,500 | 2,700 | 3.6% |
| Nevada | 46,450 | 44,520 | 1,930 | 4.2% |
| Orange | 1,598,200 | 1,543,000 | 55,100 | 3.5% |
| Placer | 206,600 | 199,200 | 7,500 | 3.6% |
| Plumas | 7,760 | 7,320 | 440 | 5.6% |
| Riverside | 1,175,600 | 1,120,300 | 55,300 | 4.7% |
| Sacramento | 777,100 | 744,200 | 32,900 | 4.2% |
| San Benito | 34,100 | 32,200 | 2,000 | 5.7% |
| San Bernardino | 1,016,100 | 969,900 | 46,200 | 4.6% |
| San Diego | 1,644,700 | 1,581,000 | 63,700 | 3.9% |
| San Francisco | 494,300 | 477,800 | 16,500 | 3.3% |
| San Joaquin | 373,500 | 352,700 | 20,800 | 5.6% |
| San Luis Obispo | 132,200 | 127,500 | 4,800 | 3.6% |
| San Mateo | 404,500 | 391,800 | 12,700 | 3.1% |
| Santa Barbara | 224,600 | 216,400 | 8,300 | 3.7% |
| Santa Clara | 1,021,400 | 986,400 | 35,000 | 3.4% |
| Santa Cruz | 136,400 | 129,500 | 6,900 | 5.1% |
| Shasta | 80,800 | 77,100 | 3,700 | 4.5% |
| Sierra | 1,420 | 1,360 | 60 | 4.2% |
| Siskiyou | 16,170 | 15,130 | 1,050 | 6.5% |
| Solano | 215,600 | 206,000 | 9,600 | 4.4% |
| Sonoma | 244,700 | 235,700 | 9,000 | 3.7% |
| Stanislaus | 252,100 | 236,100 | 16,000 | 6.4% |
| Sutter | 46,000 | 42,400 | 3,600 | 7.9% |
| Tehama | 27,220 | 25,790 | 1,430 | 5.2% |
| Trinity | 5,570 | 5,310 | 260 | 4.7% |
| Tulare | 221,800 | 200,700 | 21,100 | 9.5% |
| Tuolumne | 21,760 | 20,730 | 1,040 | 4.8% |
| Ventura | 417,900 | 401,700 | 16,200 | 3.9% |
| Yolo | 111,500 | 106,200 | 5,300 | 4.8% |
| Yuba | 35,800 | 33,700 | 2,100 | 5.9% |
Source: CA. EDD
