


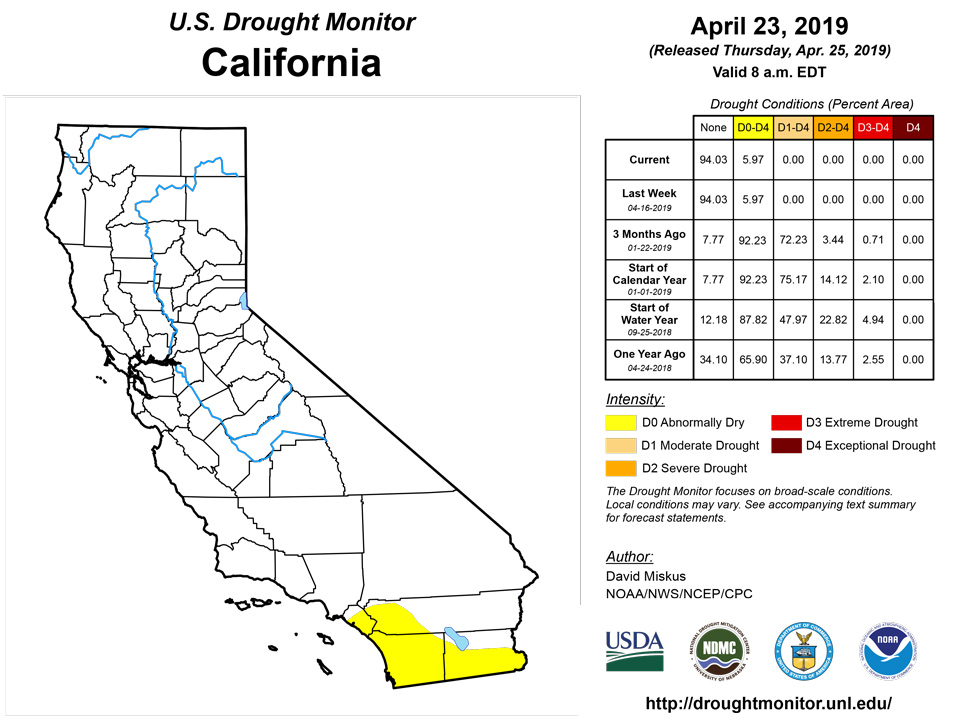
California and National Drought Summary for April 23, 2019
Summary
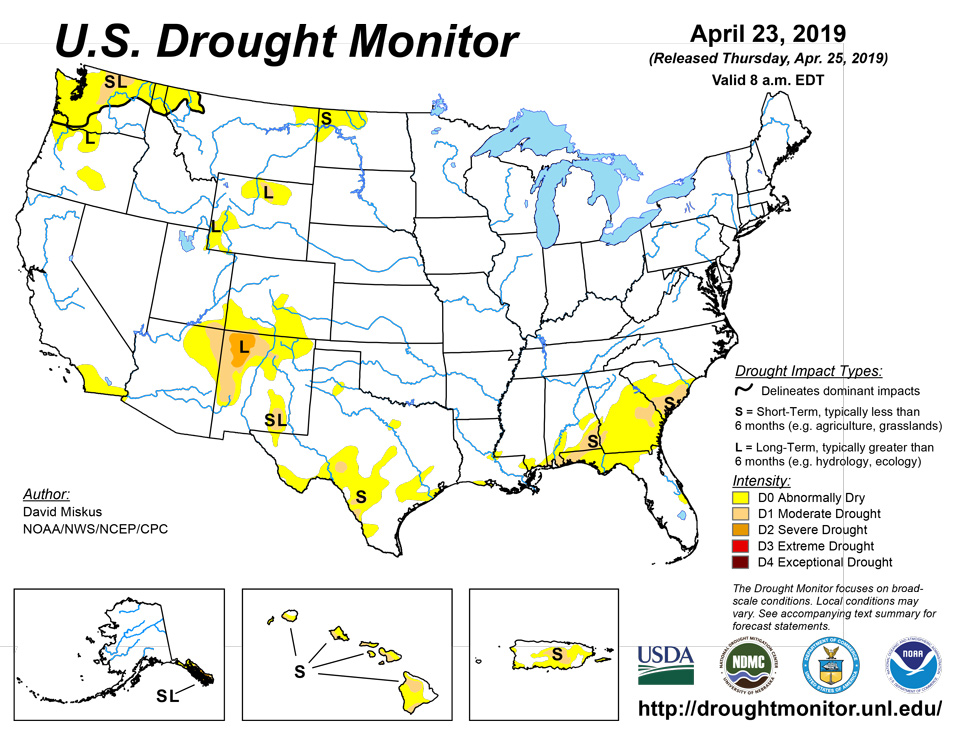
April 25, 2019 - A series of storm systems moved quickly across the lower 48 States until reaching the East Coast as a strong ridge of high pressure over the western Atlantic Ocean blocked their eastward progression. Due in part to this slowdown, severe weather and heavy rainfall occurred in portions of the southern Great Plains, lower Mississippi Valley, Southeast, and mid-Atlantic during April 17-19. Moderate to heavy precipitation (1.5-4 inches) also occurred over the western Great Lakes region, Tennessee and central Ohio Valleys, parts of New England, and northwestern Washington. Light to moderate precipitation (0.5-2 inches) was widespread in the Northwest, eastern Great Basin, northern and southern thirds of the Rockies, northern Plains, and the eastern third of the Nation. Only portions of the Southwest, central Rockies and Plains, and western Corn Belt saw little or no precipitation. Weekly temperatures averaged above-normal for much of the contiguous U.S., except for subnormal readings across the Southeast and western and southern Alaska. Light to moderate precipitation along the southern and southeastern Alaskan Coast and light showers on the windward side of the Hawaiian Islands maintained conditions in both states. Changes were made in Puerto Rico as spotty heavy showers provided some relief to short-term D0 and D1 areas, but where the rains missed, some deterioration occurred.
With near- to record wetness in many parts of the country this winter and in 2018, the April 16 USDM had the lowest percent of area in drought (D1-D4) for the lower 48 States (3.73%) and all 50 States (3.78%) since the inception of the U.S. Drought Monitor in 2000, surpassing the previous low drought standard of May 23, 2017. In fact, no dryness/drought (D0-D4) in both the lower 48 (85.88%) and all 50 States (87.06%) also set record low values last week. With more wet weather over D0-D2 areas this week, new USDM record lows will most-likely be set.
Northeast
Most areas saw light to moderate precipitation (0.5-1.5 inches), although northern Maine, Massachusetts, Connecticut, and Long Island, central Pennsylvania, central New York, and southern West Virginia received 1.5-3 inches, with reports of severe weather, including tornadoes, in Maryland, Delaware, and Pennsylvania. The last remaining area of D0 in the Northeast (in southwestern New York) measured 1-2 inches of rain, bringing 90-day deficits close to zero as 7-day averaged USGS stream flows were in above (76-90th percentile) to much-above (>90th percentile) levels. In fact, much of the Northeast reported similar 7-day USGS average stream flows along with adequate to surplus topsoil and subsoil moisture (from USDA/NASS), and could use some drier conditions.
Southeast
As the storm system strengthened and slowed Thursday into Friday, a line of severe weather developed ahead of the cold front, dropping heavy rains (2-6 inches, locally to 8 inches) from south-central Alabama northeastward into western North Carolina and eastern Tennessee. The rains eased short-term deficits (where D0-D1 was) in south-central Alabama, southwestern Georgia, northeastern South Carolina (Myrtle Beach area), and southeastern North Carolina (Wilmington area). In the latter two areas, a narrow band of 1.5-3 inches of rain was enough to make a 1-category improvement. In southeastern Alabama, a narrow band of 2-category improvement was made (D1 to nothing) where flash flooding from 4-8 inches of rain was reported in Crenshaw, northern Pike, southern Montgomery, western Bullock, central Macon, and Lee counties. Further north, numerous reports of severe weather, including numerous tornadoes, slammed into the Carolinas and Virginia on April 19. To the south across southern South Carolina, eastern Georgia, and Florida, in addition to severe weather here, enough rain fell (0.5-1.5 inches) to prevent deterioration, but it was not sufficient to make any improvements, hence status-quo.
South
Two different storm systems brought welcome precipitation to the South. Early in the period, central and eastern Texas and the lower Mississippi and Tennessee Valleys received widespread moderate to heavy rains (1.5-3 inches, locally to 6 inches) that erased much of the short-term D1 and D0 in central Texas, eastern Louisiana, and southwestern Mississippi. The few areas that received less than an inch of rain, or where 60- to 90-day significant deficits still remained, were left unchanged. In contrast, parts of west-central Texas (Edwards Plateau) missed out on the rain, and some slight D1 and D0 expansion was made here, and additionally in northern Webb County. The second system which occurred late in the period dropped beneficial precipitation on the southern Rockies (New Mexico mountain snows) and south-central Plains (Texas Panhandle and west-central Oklahoma), easing dryness and drought there (see West for New Mexico). Some short-term (2-3 months) dryness was found in northern and central Oklahoma, but longer-term wetness has kept D0 development at bay so far. Elsewhere in the South, overall wet conditions prevailed.
Midwest
The Midwest remained D0 and drought-free as a wet 2018 and wet 2019 continued to dominate the soils. This week, moderate to heavy rains (1.5-4 inches) fell across southern Minnesota, northern Wisconsin, and the Upper Peninsula of Michigan, while another band of decent rain (1.5-3 inches) was measured from southeastern Michigan southwestward into central and western Kentucky. In contrast, little or no rain was observed across most of Iowa, northern Illinois, northern Missouri, and eastern Ohio. According to USDA/NASS on April 21, every Midwestern state reported little or no topsoil or subsoil moisture shortages (0-2% short or very short), with several states reporting 25-60% surpluses. Some hint of dryness at 1-2 months was showing up in southern Iowa and northern Missouri and it will be watched, but for now it was welcome news for farmers to get into the fields for preparation and planting.
High Plains
A fairly large area of light to moderate precipitation (0.5-1.5 inches) was observed across most of Montana, southern North Dakota, western and southeastern South Dakota, Wyoming, and western and northeastern Nebraska. Southern Kansas also received some decent rains (0.5-2.5 inches), as did southern Colorado (0.5-1.5 inches). The precipitation in Colorado was enough to improve D1 to D0 (see West summary with respect to New Mexico). In southwestern Wyoming, the additional precipitation boosted WYTD average basin precipitation and SWE to 112% and 123%, respectively, thus D1 and D0 was shrunk. In northern Wyoming, 0.5-1.5 inches of precipitation was enough to create WYTD and YTD surpluses near the northern and southern D0 edges, thus erasing some of the D0. However, the D1 in the Bighorn Mountains remained intact as both WYTD basin average precipitation and SWE still stayed around 75% of normal. In contrast, extreme northern Montana and North Dakota have missed out on the precipitation, and at 60-days, only 25-50% of normal precipitation has fallen, leading to deficits of 0.5-1.5 inches. In addition, a rapid snow melt during mid-March left much of the water to run off instead of percolating into the still frozen subsoil, thus D0(S) was added. Longer time periods were wet, but since this is the start of the wet season, it is critical that timely and adequate rains fall during the next few months for agricultural interests. Short-term (2-3 months) deficits in central Kansas were also accumulating, but large longer-term surpluses have kept D0 from developing so far.
West
Additional Pacific moisture spread across the Northwest, dropping light to moderate amounts (0.5-1.5 inches) on coastal Washington, the Cascades, northern Rockies, and the central Great Basin (eastern Nevada, western and northern Utah). As a result, some D0 was erased from central Oregon, northern Olympic Peninsula (Washington), and extreme northwestern Washington, while a bit of D1 (west edge) was improved in the extreme northern Cascades. From field reports of excessive moisture & standing water in northwestern and northeastern Utah (since station data can be scarce), D1 and D0 was improved by 1-category in the state and adjacent southwestern Wyoming. WYTD basin average precipitation and SWE are both well above normal as of April 23. Even New Mexico (and southern Colorado) received beneficial precipitation (0.5-2 inches) late in the period. For New Mexico, a reassessment was made based upon short-term (WYTD) wetness vs long-term (several years) drought, plus this week's precipitation. With many SNOTEL WYTD basin average precipitation and SWE above normal, and most USGS stream flows at or above normal with good inflows into reservoirs, 1-cat improvements were made across most of the state, with the lone D2 area remaining in the northwest where ground observations confirmed worse conditions than the rest of the state. Although this WY has been quite favorable for New Mexico, multi-year strong summer monsoons and additional wet winters will be needed to make a full hydrologic recovery.
Alaska, Hawaii, and Puerto Rico
In Hawaii, mostly light scattered showers fell on the windward sides of the Hawaiian Islands while little or no rain was reported on the leeward sides during the last 6 days of the period, although day1 (24-hour totals ending 8am HST) totals were a bit more substantial and widespread on both the windward and leeward sides of the islands. After last week’s improvements to the windward sides of the Big Island and Maui and this week’s mostly lower precipitation amounts, no changes were made.
In Puerto Rico, scattered showers, some with moderate to heavy amounts (1.5-5 inches), fell on western, northeastern, and far eastern sections, greatly reducing 90-day deficits or producing small surpluses, and easing dryness (D0) and drought (D1) in these areas. In contrast, drier weather added onto existing short-term shortages, slightly expanding D1 in southeastern sections (Cayey, Aibonito, Cidra municipalities) as USGS 7-day average stream flows dropped below the tenth percentile (much below-normal) in most of the D1 area.
In Alaska, status-quo as light to moderate (1-4 inches) precipitation, with some locally heavy amounts (4-10 inches), fell along the southern and southeastern coasts, with lighter totals (0.25-1 inch) occurring in central and eastern interior sections. According to ACIS data, southeastern Alaska still had 6-month deficits of 5-15 inches, and well over 20 inches going back 9-months and longer. It will most-likely take a prolonged wet spell in southeastern Alaska to bring long-term deficits close to zero.
Pacific Islands
The overall weather pattern changed little during this USDM week (4/17/19-4/23/19) compared to last week. Scattered precipitation occurred in southern portions of Micronesia this week along a near-equatorial trough across parts of the Federated States of Micronesia (FSM) and in a region of trade-wind convergence in eastern Micronesia, and a weak circulation slowly migrated from southern Chuuk State into southern Yap State. These features comprised the Inter-Tropical Convergence Zone (ITCZ). Dry trade winds from the sub-tropical ridge (North Pacific High) inhibited precipitation across western and northern portions of Micronesia. South of the equator, a surface trough was mostly stationary just south of the Samoan Islands, but showers from the trough occasionally brushed the islands. This trough was part of the South Pacific Convergence Zone (SPZC). The ITCZ and SPCZ activity was reflected on satellite-based estimates of 7-day precipitation (QPE) as a broad band of 1+ inches of rain from eastern Yap State to the Marshall Islands (RMI), with patchy areas of 2-4 inches or more. The band was between 5 and 8 degrees North latitude over parts of Yap State, but mostly south of 6 N over eastern FSM and the RMI. Little to no rain was indicated on the QPE across the northern and far western portions of Micronesia. A band of 2-6 inches of rain was depicted on the QPE associated with the trough south of the Samoan Islands, with areas of 1-2 inches extending into American Samoa, and little to no precipitation further to the north.
Dry trades and subsiding air kept precipitation amounts low across the Marianas this week. A third of an inch of rain or less was recorded at Rota (0.35 inch), Saipan (0.28), and Guam (0.23). Spotty fires developed on Guam, with a Fire Weather Watch issued for a couple days and Red Flag Warning in effect near the end of the week. No change was made to the USDM depiction in the Marianas, with D4-S continuing at Saipan, D3-S continuing at Guam, and D2-S continuing at Rota.
It was another dry week in the Republic of Palau, with rainfall less than an inch on Koror (0.78 inch). Only 4.41 inches of rain has fallen so far in April, and this is the third consecutive dry month (less than the 8-inch monthly minimum needed to meet most water needs). Local reports have been received that water rationing has been implemented in parts of Palau, on the northern state in Babeldaob (the big island), so the USDM status at Palau was changed from D1-S to D2-S.
More than half of the days were missing this week for Kapingamarangi, Nukuoro, and Pingelap, and Ulithi has been missing for several months, so no analysis could be made for these 4 stations this week. However, reports of damage to coconut trees from the drought in Ulithi have been received, and coconut and breadfruit in the northern islands are drying up. In the Yap Main Islands, data from Yap were incomplete, but North Fanif received 0.25 inch of rain based on 4 days of data. Fananu recorded less than a tenth of an inch (0.07) of rain this week. The previous 2 weeks were wet, but 5 of the last 6 months (including April) have been dry at Fananu. Based on the agricultural impacts, and April marking the third consecutive dry month at these 2 stations, the USDM status was worsened to D3-S at Yap and D2-S at Fananu. Woleai reported 0.01 inch of rain this week with 3 days missing. Based on the agricultural impacts, and April marking the fourth consecutive dry month, the status at Woleai was worsened to D1-S. According to the data received by analysis deadlines, the week was wet only at Pohnpei (2.90 inches) and Kosrae (3.12 inches). D-Nothing continued at Chuuk, Pohnpei, Kosrae, and Lukonor.
It was a dry week across the Marshall Islands, with less than an inch of rain recorded at all of the regular reporting stations. The reservoir level on Majuro steadily declined during April. Due to reservoir water rationing and a few scattered showers, the decline was halted with the reservoir level holding mostly steady during this USDM week. But with the level at roughly 23.7 million gallons for the week, it is still only 65.8% of maximum, which is well below the 80% threshold for concern. A tenth of an inch, or less, of rain has fallen for each of the last 4 weeks at Ailinglapalap, with 0.17 inch for April so far and 6.90 inches for March, so the status was worsened to D1-S at Ailinglapalap. D3-S continued at Kwajalein and Majuro, and D4-S continued at Utirik and Wotje. The last 2 or 3 weeks have been dry, but, benefiting from ITCZ convection due to their southern location and with March being wet, D-Nothing continued at Jaluit and Mili.
The last 4 weeks have been dry (less than 2 inches) at Pago Pago, but enough rain has fallen each week (1.50 inches this week), and the previous several months have been wet, so D-Nothing continued for Tutuila.
Looking Ahead
During the next 5 days (April 25-29, 2019), two systems are expected to provide precipitation to the lower 48 States. One system will track from the southern Rockies northeastward into New England, bringing moderate to heavy rain(1-4 inches) and severe weather to the southern Plains, lower Mississippi, Tennessee, and Ohio Valleys, and Northeast, with another system moving southeastward out of southwest Canada across the northern Rockies and Plains, Midwest, and eastern Great Lakes region, dropping light to moderate totals (0.5-2 inches). Little or no precipitation is expected in the Far West, Southwest, south-central Plains, far upper Midwest, and along the southern Atlantic Coast. Temperatures should average below-normal across the northern third of the U.S., near normal in the Southeast, and above-normal in the Southwest.
The CPC 6-10 day extended range outlook (April 30-May 4, 2019) favors above-normal precipitation odds across much of the central U.S., from the Rockies eastward to the Appalachians, in western and northern Alaska, with subnormal totals likely along the West Coast and in southeastern Alaska, with near-normal chances elsewhere. Subnormal temperatures are likely in the North-Central States while chances of above-normal readings are favored in the Southeast and western Alaska.
Author(s):
David Miskus, NOAA/NWS/NCEP/CPC
Richard Heim, NOAA/NCEI
Dryness Categories
D0 Abnormally Dry—used for areas showing dryness but not yet in drought, or for areas recovering from drought.
Drought Intensity Categories
D1 Moderate Drought
D2 Severe Drought
D3 Extreme Drought
D4 Exceptional Drought
Drought or Dryness Types
S Short-Term, typically less than 6 months (e.g. agricultural, grasslands)
L Long-Term, typically greater than 6 months (e.g. hydrologic, ecologic)
Source: National Drought Mitigation Center

