


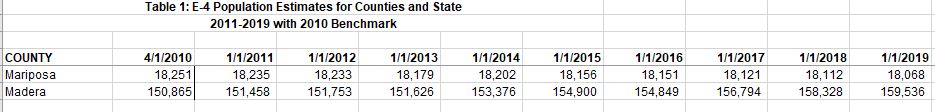
Mariposa County had 18,251 residents on April 1, 2010 and a preliminary population of 18,068 on January 1, 2019, a decrease of 183 residents.

Mariposa County Population Estimates from 2000 through 2010.
Data Reflect Fire-Driven Changes to Local Populations, Housing
May 6, 2019 - SACRAMENTO - California added 186,807 residents to bring the state’s estimated total population to 39,927,315 people as of January 1 st, 2019, according to new population estimates and housing data released today by the California Department of Finance.
The report contains preliminary January 2019 and revised January 2018 population data for California cities, counties, and the state, and reflects the dramatic changes caused by the state’s catastrophic wildfires. Key findings include:
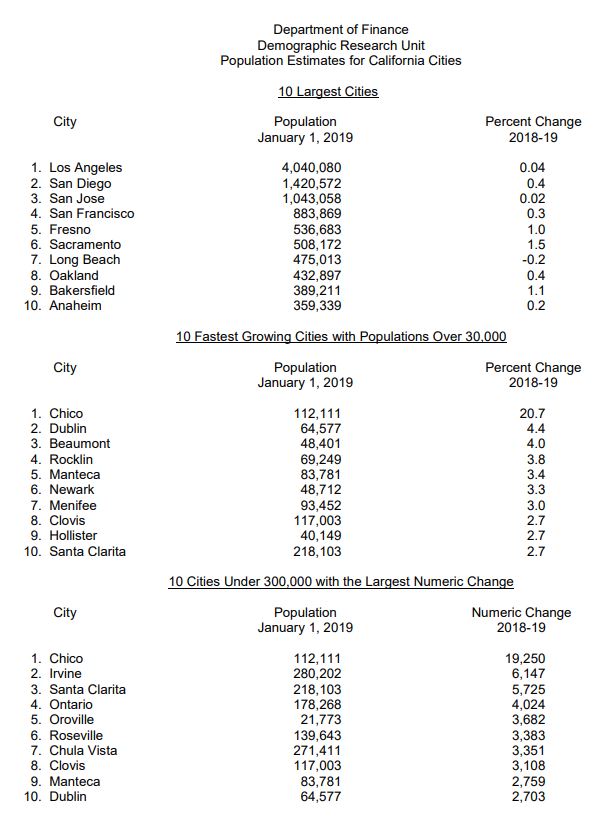
The Camp Fire in Butte County was the most destructive wildfire in California history, with over 14,600 housing units destroyed. The fire destroyed almost 90 percent of the housing stock and displaced 83 percent of the population in the Town of Paradise, which suffered the loss of 11,371 housing units. The majority of the displaced persons relocated to the surrounding cities of Chico and Oroville, each adding more than 20 percent to their total populations.
With a population of 112,000, Chico saw the largest numeric change in the state, adding over 19,000 persons. With a population of 508,000 persons, Sacramento added over 7,400 persons. San Diego (1,421,000) added 6,200 persons, followed by Irvine (280,000) adding 6,100 persons. Santa Clarita (218,000) rounds out the top five cities by numeric growth with 5,700 new residents due to a large annexation from Los Angeles County.
Throughout the state, more than 23,700 housing units were demolished in 2018, with wildfires heavily influencing a number of areas. The counties with most housing loss due to fire include Butte (14,600), Shasta (900), Ventura (700), and Lake (300). The City of Malibu in Los Angeles County also lost close to 500 housing units due to wildfire.
In terms of population growth from housing production not related to wildfires, the top five cities include: Lathrop (5.2 percent) in San Joaquin County, San Juan Bautista (4.8 percent) in San Benito County, Dublin (4.4 percent) in Alameda County, Irwindale (4.1 percent) in Los Angeles County, and Beaumont (4.0 percent) in Riverside County.
California's statewide housing growth, as measured by net unit growth in completed housing units for 2018, was 77,000 units. Total housing in California reached 14,235,000 units, a 0.6- percent increase.
2018’s population growth rate of 0.47 percent is the slowest in the State’s history. This rate is driven by a significant decline in births, down by more than 18,000 over the previous year, as well and data reflecting lower student enrollment. Deaths continued an upward trend seen since 2010 as California’s “Baby Boomers” continue to age.
Also of note in the report:
Ranked by net housing gains, Los Angeles (16,525), San Diego (4,505), Irvine (3,384), Santa Clarita (2,486) and Sacramento (2,353) added the most housing units in 2018.
Of the ten largest cities in California, Sacramento had the largest percentage gain in population (1.49 percent, or 7,400) with Bakersfield (1.11 percent, or 4,300) a distant second.
Of the 14,235,000 housing units in California, 9,186,000 are single family and 4,490,000 are multi-family with 560,000 mobile homes. Multi-family housing growth outpaced single family housing by over 1,900 net units (“net” refers to new construction minus demolition), narrowing the difference from previous years but continuing a seven-year trend. Los Angeles led the state with 12,217 multi-family units, comprising 73.9 percent of their total housing growth, followed by San Diego (3,648 for 81.0 percent), San Francisco (2,277 for 99.5 percent), and Irvine (1,439 for 42.5 percent).
Group quarters account for about 2 percent of the total state population (849,000). This population includes, among others, those living in college dorms (243,000) and in correctional facilities (215,500). In 2018, the group quarters population grew by just over 200 people or 0.03 percent. The college dormitory population grew the fastest at 3,800 (1.6 percent), the military group quarters population decreased by 2,700 (4.8 percent), local jails decreased by 260 (less than 1 percent) and state prisons decreased by 370 (less than 1 percent).
State prisons are generally located in remote areas; as a result, increases or decreases in this population can account for significant changes in their respective locations. For example, state prison declines led to population decreases in Calipatria in Imperial County, Chowchilla in Madera County, and Blythe and Norco in Riverside County, while driving population increases in Tehachapi in Kern County, Coalinga in Fresno County, Corcoran in Kings County, Folsom in Sacramento County, and Vacaville in Solano County.
Background Information:
These population estimates are produced annually by the Department of Finance for use by local areas to calculate their annual appropriations limit. The State Controller’s Office uses Finance's estimates to update their population figures for distribution of state subventions to cities and counties, and to comply with various state codes. Additionally, estimates are used for research and planning purposes by federal, state, and local agencies, the academic community, and the private sector.
Changes to the housing stock are used in the preparation of the annual city population estimates. Estimated occupancy of housing units and the number of persons per household further determine population levels. Changes in city housing stock result from new construction, demolitions, housing unit conversions, and annexations. The sub-county population estimates are then adjusted to be consistent with independently produced county estimates.
Related population reports are available on the Department’s website: http://www.dof.ca.gov/Forecasting/Demographics/
Source: CA. DOF

