


May 13, 2019 - By Emily Becker - Forecasters estimate a 70% chance that our current El Niño will continue through the summer, and a 55-60% chance it will extend into the fall.
Just a number
El Niño conditions were still evident across the tropical Pacific Ocean during April, as the sea surface temperature in the Niño3.4 region averaged about 0.7°C warmer than the long-term average (via the ERSSTv5 database). Most computer models predict that the ocean surface will stay warmer than average in the Niño3.4 region, with the majority of predictions remaining above the El Niño threshold of 0.5°C through next fall.
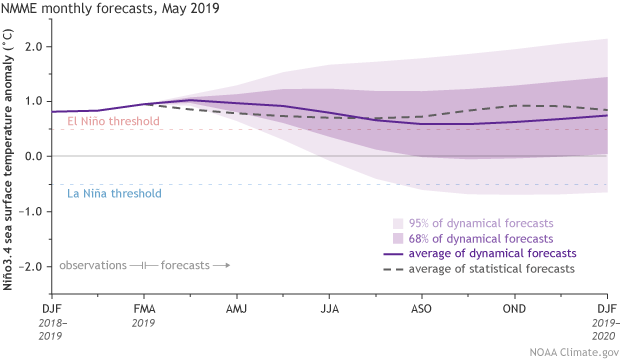
Climate model forecasts for the Niño3.4 Index. Dynamical model data (purple line) from the North American Multi-Model Ensemble (NMME): darker purple envelope shows the range of 68% of all model forecasts; lighter purple shows the range of 95% of all model forecasts. Statistical model data (dashed line) from CPC’s Consolidated SST Forecasts. NOAA Climate.gov image from CPC data.
However, there is a broad range of potential outcomes shown here, and we’re still within the spring predictability barrier, when forecast models have a tougher time making successful predictions, partly due to the tendency of ENSO to be in transition during the spring. We’re starting to pass that barrier, but we still bear it in mind when looking at forecasts made in early May.
Blow out your candles
The atmosphere also continued to reflect El Niño in April, with more clouds and rain forming over the warmer-than-average waters of the central tropical Pacific, and drier conditions over the far western Pacific and Indonesia, although this pattern was somewhat weaker than during February or March.
The near-surface winds in the tropical Pacific, the trade winds, were near average in April. The trade winds usually blow from the east to the west, keeping warm water piled up in the far western Pacific. Changes in these winds are a critical component of the El Niño system. When they weaken in the central Pacific, surface waters can warm, and sometimes allow a downwelling Kelvin wave to form: a large blob of warmer-than-average water that moves from the west to the east under the surface of the Pacific.
After a couple of months of weaker-than-average trade winds (what we expect during El Niño conditions), they were near average overall during April. This slight weakening of the typical El Niño signal is in part due to a reawakening Madden-Julian Oscillation (MJO) in the second half of April.
The MJO is an area of active storms and convection (rising air) that travels from west to east along the equator. It can circle the globe in about 30-60 days. We’ve talked about the MJO quite a bit on the ENSO Blog and climate.gov, since this pattern can affect US weather, and interact with El Niñoand La Niña.

The surface and upper-atmosphere structure of the MJO for a period when the enhanced convective phase (thunderstorm cloud) is centered across the Indian Ocean and the suppressed convective phase is centered over the west-central Pacific Ocean. Horizontal arrows pointing left represent wind departures from average that are easterly, and arrows pointing right represent wind departures from average that are westerly. The entire system shifts eastward over time, eventually circling the globe and returning to its point of origin. Climate.gov drawing by Fiona Martin.
Near-surface air is drawn toward the MJO-related area of convection. So when the MJO is over the Indian Ocean, the trade winds in the west-central Pacific are stronger than average, because the inflow to the MJO reinforces them. But when the MJO moves into the central Pacific, the trade winds tend to be weaker, because the inflow to the MJO opposes them.
After going mostly quiet in mid-March, by mid-April the MJO was showing signs of re-development. The trade winds in the western Pacific during mid-late April were stronger than average (more east-to-west), consistent with what we’d expect when the center of MJO convection is in the Indian Ocean. However, during the first week of May, as the MJO moved into the Pacific, the trade winds weakened substantially in the west-central Pacific.
Over the hill

Area-averaged upper-ocean heat content anomaly (°C) in the equatorial Pacific (5°N-5°S, 180º-100ºW). The heat content anomaly is computed as the departure from the 1981-2010 base period pentad (5-day) means. Heat content has been elevated for the last 12 months, but recently decrease. Climate.gov figure from CPC data.
Over the past year, subsurface waters (from the surface down to about 1,000 feet) have remained warmer-than-average overall, but with some substantial increases and decreases, resembling a particularly brutal stage of the Tour de France. If the recent weakening in the trade winds does lead to a downwelling Kelvin wave and increases the subsurface anomalies, it could provide fuel to help this El Niño event to persist. Bikers beware, another uphill climb may be ahead of you.
Bon anniversaire
Lastly, happy 5th birthday to the ENSO Blog! We’ve learned a lot over the past 60 months, and we hope you have, too. We’ve reported on a slow-to-develop, but strong El Niño; consecutive weak La Niñas; and the current, weak El Niño. We’ve built an extensive catalog of posts on ENSO (the whole El Niño/La Niña system), other climate patterns, and many other climate-related topics. Check out our editor’s handy index page for a stroll down memory lane. And, never forget Tom’s three-postseries on forecast verification.
The best part is that we have a long list of topics we’re looking forward to covering in future posts, and we’re happy to solicit suggestions in the comments section below on topics you would like us to cover. Thank you for reading us—we’ve had well over 2 million unique page views so far—otherwise, we’d just be yelling into the (trade) winds.
A blog about monitoring and forecasting El Niño, La Niña, and their impacts.
Disclaimer:
The ENSO blog is written, edited, and moderated by Michelle L’Heureux (NOAA Climate Prediction Center), Emily Becker (contractor to CPC), Nat Johnson (NOAA Geophysical Fluid Dynamics Laboratory), and Tom DiLiberto and Rebecca Lindsey (contractors to NOAA Climate Program Office), with periodic guest contributors.
Ideas and explanations found in these posts should be attributed to the ENSO blog team, and not to NOAA (the agency) itself. These are blog posts, not official agency communications; if you quote from these posts or from the comments section, you should attribute the quoted material to the blogger or commenter, not to NOAA, CPC, or Climate.gov.
Source: ENSO blog team

