


California and National Drought Summary for June 4, 2019
Summary
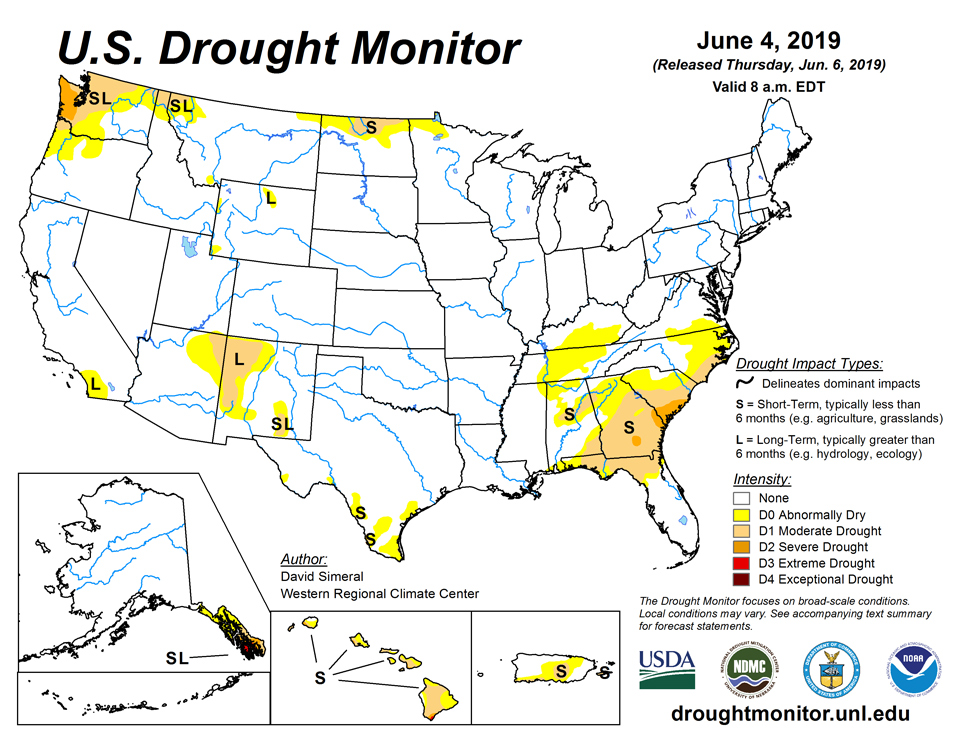
June 6, 2019 - This U.S. Drought Monitor week saw further deterioration in drought-related conditions across portions of the Southeast and lower Mid-Atlantic where persistent hot and dry weather stressed dryland crops, depleted soil moisture, and reduced streamflow activity. Some relief may be on the way during the next week, however, as heavy rains are expected to impact the region. In the South, beneficial rains helped alleviate small areas of drought in the Trans Pecos region of Texas while areas of Abnormally Dry (D0) were introduced on the map across Tennessee in response to short-term dryness and hot temperatures. In the Midwest, severe weather outbreaks and areas experiencing flooding continued to impact parts of the region. According to NOAA’s National Center for Environmental Information (NCEI), several states in the Midwest including Iowa and Minnesota experienced their wettest 12-month period (May 2018–April 2019) on record. In the High Plains, dry conditions during the past month led to introduction of areas of moderate drought in north-central North Dakota. Out West, drought conditions intensified in western Washington where streamflow conditions are well below normal levels after a shallow snowpack this past winter.
Northeast
On this week’s map, the Northeast region remained drought-free. Average temperatures for the week were 2-to-8 degrees below normal in Upstate New York and New England while the southern locales were 2-to-10 degrees above normal. Light-to-moderate rainfall accumulations were observed across the region with the heaviest accumulations (3-to-6 inches) observed in western Pennsylvania. Elsewhere in the region, accumulations ranged from 1-to-2 inches.
Southeast
Drought conditions quickly intensified across portions of Alabama, Georgia, northern Florida, and South Carolina as a heat wave impacted much of the region this week. Temperatures soared into the mid to high 90s with areas in southeastern North Carolina reaching the low 100s. These excessively hot and dry conditions increased evaporative demand levels further drying soils in the region and stressing dryland crops in parts of Georgia, South Carolina, and along the Coastal Plain of North Carolina. According to the USDA (for the week ending June 2nd), the percentage of topsoil moisture by state rated short to very short was as follows: Alabama 76%, Florida 56%, Georgia 88%, South Carolina 95%, and North Carolina 57%. Streamflow levels dipped below the 10th percentile range at numerous creeks and rivers across Alabama, eastern portions of the Carolinas, and Georgia. On this week’s map, areas of Severe Drought (D2) were introduced in eastern South Carolina as well as in southeastern and southern Georgia. Additionally, areas of Moderate Drought (D1) expanded across northern Florida, southern Georgia, central South Carolina, and eastern North Carolina. For the 7-day period, average temperatures ranged from 2-to-10 degrees above normal, and the only significant rainfall accumulations (2-to-3 inches) were restricted to isolated areas in central Florida and northern North Carolina. Looking at the NWS Quantitative Precipitation Forecast (QPF), the region is expected to receive some much-needed precipitation later in this week with 7-day totals ranging from 2-to-6 inches.
South
Minor improvements were made on the map in small areas of Moderate Drought (D1) and Abnormally Dry (D0) in the Trans Pecos region of Texas where 1-to-4 inches of rain fell this week. In south Texas, short-term precipitation deficits during the past 30-day period led to the expansion of areas of Abnormally Dry (D0). In northeastern Mississippi and Tennessee, short-term precipitation deficits during the past 30 days and below-normal streamflow levels led to the expansion of areas of Abnormally Dry (D0). Conversely, Oklahoma has experienced a very wet period during the past 30 days with northern portions of the state recording rainfall accumulations of 6-to-12 inches above normal levels. According to the June 3rd USDA Oklahoma Crop Weather report, pasture and range conditions were rated 88% good to fair and livestock condition was rated 92% good to fair. For the week, average temperatures were above normal across most of the region with the largest positive temperature anomalies observed in northern Mississippi and Tennessee where temperatures were 4-to-8 degrees above normal with maximum temperatures reaching the low to mid 90s. Conversely, average temperature were 2-to-6 degrees below normal across the western half of Texas. Some light-to-moderate rainfall accumulations (2-to-4 inches) were observed this week in northern Texas, southwestern Louisiana, and northern Arkansas.
Midwest
The region remained drought-free on the map this week. During the past 30-day period, parts of the region experienced outbreaks of severe weather including severe thunderstorms and tornadic activity as well as flooding. For the past 60-day period, precipitation has been well above normal (130% to 250%) across a large portion of the region. According to the USDA, the Midwest region topsoil moisture is at 50 to 70% in surplus. During the past 7-day period, the heaviest rainfall accumulations (2-to-4 inches) were observed in southern Iowa and northwestern Illinois. For the week, average temperatures hovered within a few degrees of normal across most of the region, with the exception of areas in northern Michigan and northern Minnesota where temperatures were 4-to-8 degrees below normal.
High Plains
On this week’s map, an area of Moderate Drought (D1) was introduced in north-central North Dakota in response to short-term precipitation deficits (30-90 days), dry topsoils, reports of stress to pastures, and low stock pond levels. According to the USDA, South Dakota topsoil was 52% in surplus with many areas experiencing flooded fields. For the week, northern portions of the region, including the Dakotas, experienced above normal temperatures with the largest positive anomalies ranging from 2-to-8 degrees above normal while southern portions of the region were a few degrees below normal. Overall, most of the region was dry during the past week with the exception of some isolated showers in Nebraska and eastern Wyoming.
West
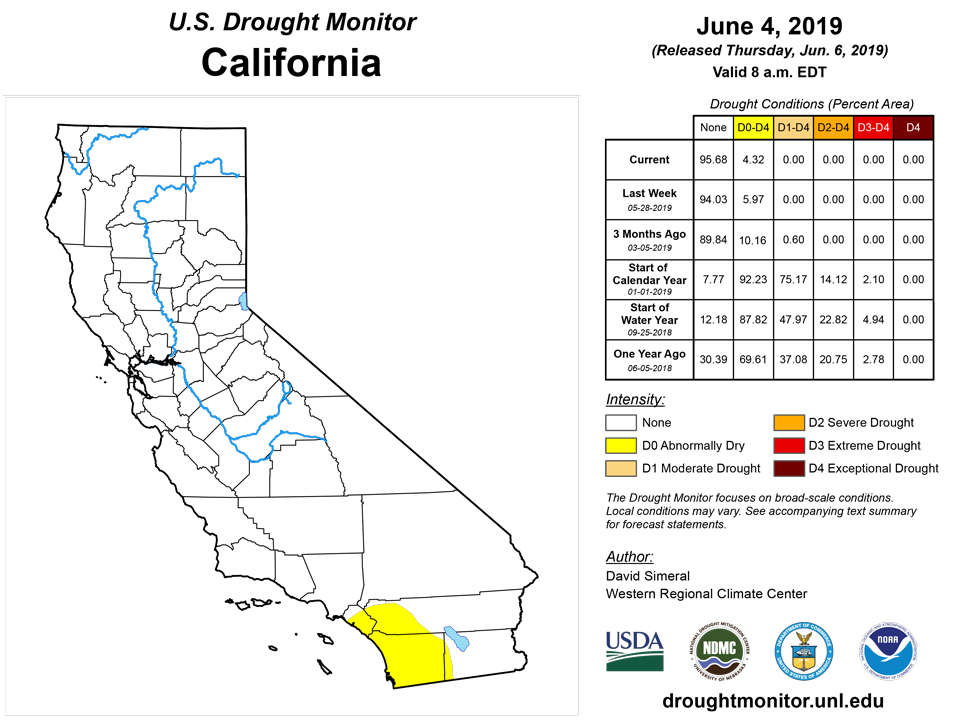
On this week’s map, continued warm and dry conditions in the Pacific Northwest led to the introduction of Severe Drought (D2) in areas of western Washington including the Olympic Mountains where Water-Year-to-Date (since October 1st) precipitation at several NRCS SNOTEL stations has been well below normal ranging from the 14th to the 30th percentile. According to the USGS, the 7-day streamflow levels in rivers and creeks across western Washington and northwestern Oregon are flowing well below normal levels. In the Willamette Valley and coastal mountains of Oregon, areas of Abnormally Dry (D0) were added in response to the low streamflow levels and below normal precipitation during the past 30 days. In southwestern Montana, short-term dryness (past 30 days) led to the introduction of an area of Abnormally Dry (D0). In southeastern California and southwestern Arizona, areas of Abnormally Dry (D0) were removed as conditions have improved during the past year with precipitation in western Imperial County, California falling in the top 10% of percentile rankings. During the past week, average temperatures were well above normal across the Pacific Northwest, northern California, and the northern Rockies while the southern half of the region experienced below normal temperatures. Some isolated showers and thunderstorms were observed across the central Sierra, Great Basin, and eastern portions of Colorado and New Mexico.
Alaska, Hawaii, and Puerto Rico
No changes were made on this week’s map in Alaska, Hawaii, or Puerto Rico. In the Hawaiian Islands, conditions were generally dry for the 7-day period with the exception of some light-to-moderate accumulations (1-to-3 inches) on the Big Island. Average temperatures for the week ranged from 2-to-8 degrees above normal while the higher elevations of the Big Island experienced slightly cooler than normal temperatures. For the past 14-day period, maximum temperatures were 15 degrees above normal in the North Kohala district of the Big Island and in east Maui. In Alaska, generally dry conditions continued this week across most of the state with some light-to-moderate accumulations observed in parts of Southeast, Southcentral, and the Interior. Average temperatures for the week were above normal across Alaska with the largest positive anomalies observed in the Interior and northwestern region where temperatures were 5-to-10 degrees above normal. In Puerto Rico, moderate-to-heavy rainfall accumulations (3-to-10+ inches) were observed across northern, eastern, and parts of central Puerto Rico. Areas currently in Moderate Drought (D1), however, received accumulations of less than 2 inches.
Pacific Islands
In the U.S. Affiliated Pacific Islands, the weather pattern during this USDM week (5/29/19-6/4/19) consisted of a medley of surface troughs, tropical disturbances, and converging trade winds across parts of Micronesia, with some upper-level troughs and lows with their upper-level divergence mixed in, all superimposed atop or within a broader dry trade-wind regime. A near-equatorial trough or Inter-Tropical Convergence Zone (ITCZ) tended to dominate in southern Micronesia, while the dry trade winds held sway in the northern portions. South of the equator, a high pressure ridge spread dry air across American Samoa. Satellite-based estimates of 7-day precipitation (QPE) showed a band of 1- to 4-inches of precipitation that stretched east-west across Micronesia, mainly between about 2 degrees North to 7 degrees North, with a wider north-south spread over Yap State. Areas of 4+ inches of rain were embedded within this band. Less than an inch to no precipitation was indicated on the QPE north and south of this ITCZ band. The satellite QPE showed a few 1-inch blobs of precipitation near the Samoan Islands, but mostly little to no precipitation across the immediate area.
Saipan and Rota saw dry conditions this week with 0.24 inch and 0.44 inch, respectively, leaving both islands in extreme drought (D3-L for Saipan and D3-S for Rota). Saipan has been classified as D3-L due to dryness during the 6 months prior to May, but with recently wet conditions in May, while Rota is classified as D3-S since dryness has lasted less than 6 months. Guam received 0.96 inch of precipitation this week which follows the 1.72 inches of precipitation from last week. In total, 3.38 inches has accumulated since May 21. Extreme drought (D3-S) was changed to severe drought (D2-S) on Guam, where the “S” denotes that dryness has lasted less than 6 months.
Palau saw 2.93 inches of rain this week. Although the 2-inch weekly minimum needed to meet most water needs was met, precipitation has been below the 8-inch monthly minimum for four consecutive months. Severe drought with dryness that has lasted less than 6 months (D2-S) remains for the island.
Pingelap (2.30 inches; 2 days missing), Pohnpei (2.97 inches), and Kosrae (2.71 inches; 2 days missing) received adequate precipitation this week and remain free of drought and dryness. Woleai saw extremely abundant precipitation this week (6.28 inches) that was enough to fill up rain catchment tanks, per a local source. Severe drought (D2-S) was changed to moderate drought (D1-S; dryness has lasted less than 6 months). Kapingamarangi (1.15 inches; 2 days missing) did not reach the 2-inch weekly minimums needed to meet most water needs, but has seen wet conditions in previous weeks and months, leaving no concerns of dryness or drought at this time. Nukuoro saw 2.69 inches of rain this week (2 days missing) and Lukunor saw 3.53 inches (1 day missing). Both islands remain abnormally dry (D0-S) with dryness that has lasted less than 6 months. Yap saw 1.86 inches of rainfall this week and remains in severe drought (D2-S) with dryness lasting since February. Rainfall this week was well below the 2-inch threshold needed to meet most water needs at Fananu (0.74 inch) and Chuuk Lagoon (0.54 inch; 1 day missing) leaving severe drought (D2-S) on both islands.
Utirik (1.23 inch; 1 day missing) and Wotje (0.45 inch; 1 day missing) saw some rain this week, but totals were still well below the 2-inch weekly minimum needed to meet most water needs. Both islands remain in exceptional drought (D4-SL) due to dry conditions that have lasted more than 6 months. Ailinglapalap saw very little precipitation this week (0.05 inch), but had adequate precipitation in May (10.28 inches) so abnormal dryness remains (D0-S). Jaluit was also somewhat dry this week (1.13 inches), but saw a couple wet weeks in May leaving the atoll only abnormally dry (D0-S). Kwajalein received only 0.92 inch of rain this week, so moderate drought (D1-S) remains. In contrast, Majuro received abundant precipitation this week (3.05 inches) and over double the 8-inch monthly threshold in May (16.14 inches). Because of the recent wetness, moderate drought (D1-S) was changed to abnormal dryness on Majuro (D0-S). Mili also saw ample precipitation this week (4.06 inches) and in May (11.54 inches) leaving the island free of drought and dryness.
Although Pago Pago saw only 0.34 inch of rain this week, the last 11 months have seen ample precipitation and the island remains drought-free.
In the vicinity of the U.S. Virgin Islands, a series of troughs moved in bringing southeasterly winds, moisture, and unstable conditions at the beginning and through the middle of the U.S. Drought Monitor (USDM) week. Showers and thunderstorms brought relatively heavy rain to the area Wednesday through Friday, leading to the issuance of flash flood watches for the USVI by the National Weather Service in San Juan. Scattered showers were found around the islands over the weekend and into Monday.
Precipitation at King Airport on St. Thomas was 77% of normal in January, 130% of normal in February, 91% of normal in March, 38% of normal in April, and 76% of normal in May. One- and 3-month SPIs indicate D-nothing and low end D1 (moderate drought), respectively, while 6- and 9-month SPIs indicate D1 conditions. There has been 1.13 inches of precipitation this week and measurable rainfall nearly every day the last 10 days. Although precipitation was well below normal in April and the beginning of May, the adequate precipitation in February and March, showery conditions the last two weeks, and improving conditions evident in SPI values, indicate D0-L on St. Thomas. This implies abnormal dryness with lingering impacts from more intense drought earlier this year.
March and April were very dry on St. Croix, with Rohlsen Airport breaking the record for the driest March with 0.02 inch. However, May was relatively wet with 150% of normal precipitation observed at Rohlsen Airport, 122% of normal precipitation found at Christiansted Fort (with the whole last week of May still missing), 106% at Montpellier, and 181% at East Hill. Even though 3.70 inches of the May precipitation at Rohlsen airport fell on one day leading to runoff, there has been precipitation over multiple days since totaling 2.50 inches. Christiansted Fort also picked up 1.20 inches of precipitation on June 3 and Rohlsen Airport has seen 0.88 inch of rain this USDM week. One-, 3-, 6- and 9- month SPI values for Christiansted Fort indicate D0 and D-nothing. Six- and 9-month SPI values for Rohlsen Airport indicate D1 (moderate drought) and D2 (severe drought), respectively, while 1- and 3-month SPI values indicate no drought. With very dry conditions in March and April but wetter conditions in recent weeks, St. Croix is under D0-L indicating abnormally dry conditions with lingering impacts from previously drier conditions.
Precipitation at East End was 96% of normal in January, 103% of normal in February, 44% of normal in March and 32% of normal in April. From radar and observation derived estimates for St. John, it appears the island received between 2 and 6 inches of rain in May. This would indicate areas around the island received anywhere between about 70% (eastern part of the island) and 125% (central and western parts of the island) of normal precipitation (based on PRISM data 1971-2000 normals). One- and 3-month SPI values for East End using data through the end of April indicated D1 (moderate drought) conditions. However, with the estimated precipitation in May, St. John was determined to have D0-L conditions, i.e. abnormal dryness with lingering impacts from previously drier conditions.
Looking Ahead
The NWS WPC 7-Day Quantitative Precipitation Forecast (QPF) calls for moderate-to-heavy accumulations ranging from 2-to-7 inches across much of the South and Southeast. Further north, lesser accumulations (<2 inches) are forecasted for eastern Colorado and New Mexico, the southern Plains, Midwest, Northeast, and Mid-Atlantic. Out West, dry conditions are expected to prevail across the Great Basin and Desert Southwest while some lesser accumulations (<1 inch) are forecasted for the northern Rockies of Idaho and Montana as well as western Washington. The CPC 6–10-day outlook calls for a high probability of above-normal temperatures across the West with the exception of Colorado, New Mexico, and Wyoming where temperatures are expected to be below normal. Likewise, the eastern two-thirds of the continental U.S. is forecasted to be below normal with the exception of the Gulf Coast region and Florida. In terms of precipitation, there is a high probability of above-normal amounts in areas east of the Mississippi River as well as in Texas and eastern portions of the Desert Southwest while dry conditions are expected in the Pacific Northwest and northern Plains. In Alaska, above-normal temperatures are expected with above-normal precipitation in the southeast, southwest, and coastal areas of south-central.
Author(s):
David Simeral, Western Regional Climate Center
Claire Shield, National Drought Mitigation Center
Dryness Categories
D0 Abnormally Dry—used for areas showing dryness but not yet in drought, or for areas recovering from drought.
Drought Intensity Categories
D1 Moderate Drought
D2 Severe Drought
D3 Extreme Drought
D4 Exceptional Drought
Drought or Dryness Types
S Short-Term, typically less than 6 months (e.g. agricultural, grasslands)
L Long-Term, typically greater than 6 months (e.g. hydrologic, ecologic)
Source: National Drought Mitigation Center

