


California and National Drought Summary for June 11, 2019
Summary
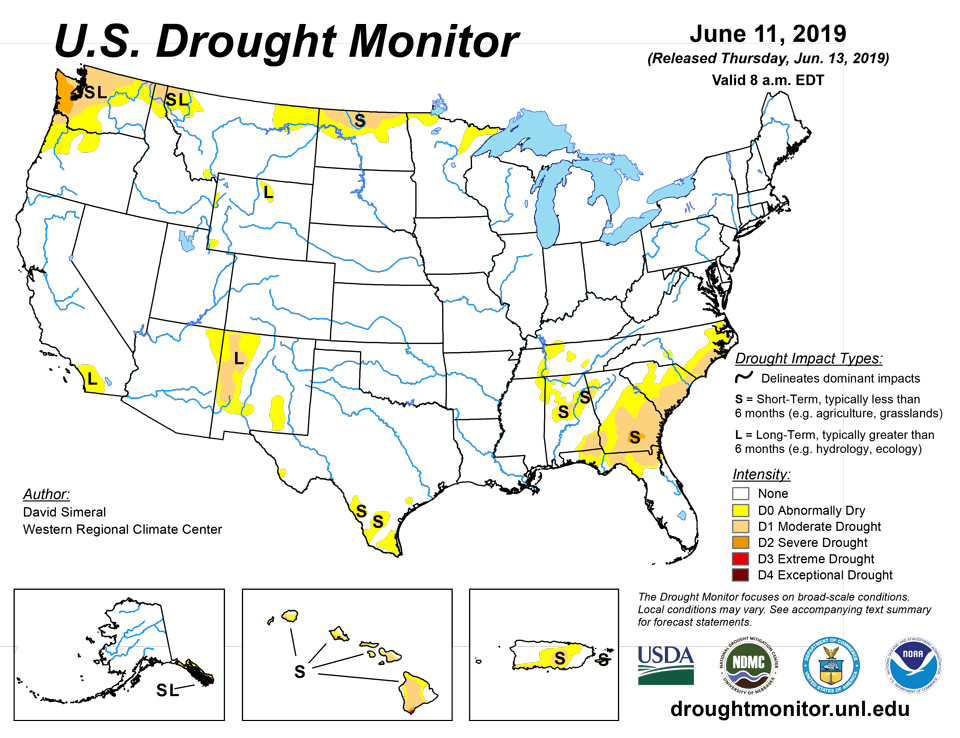
June 13, 2019 - This U.S. Drought Monitor week saw highly beneficial rainfall activity across drought-stricken areas of the Southeast. Across this region, locally heavy rainfall accumulations (ranging from 2 to 8+ inches) and localized flash flooding were observed. These soaking rains helped to significantly improve soil moisture as well as boost streamflow levels in some of the areas hardest hit by the recent heatwave. In parts of the Midwest, continued rains, flooding, and very moist soils delayed the planting of crops—including corn and soybeans. According to the USDA June 11th Weekly Weather and Crop Bulletin, “only 67% of the nation’s corn and 39% of the soybeans had been planted, breaking 1995 records of 77 and 40%, respectively.” In northern North Dakota, areas of drought expanded in relation to short-term precipitation deficits and reported impacts in the agricultural sector. Out West, drought intensified in the Idaho Panhandle where poor snowpack conditions during the 2018–19 season have led to below-normal snowmelt runoff conditions. Nationwide, May of 2019 was the 2nd wettest May on record for the contiguous U.S., according to NOAA’s National Center for Environmental Information (NCEI).
Northeast
On this week’s map, the Northeast region remained drought-free. Average temperatures for the week were 2-to-5 degrees below normal across most interior parts of the region while coastal areas were slightly above normal. Light-to-moderate rainfall accumulations (1-to-4 inches) were observed across the region with the heaviest accumulations centered on Delaware, Upstate New York, New Hampshire, northern Vermont, and southern portions of West Virginia.
Southeast
The region received highly beneficial rains during the past week as several slow-moving systems delivered widespread moderate-to-heavy rainfall accumulations (2-to-8+ inches) and flash flooding to portions of the Southeast and Mid-Atlantic states. The rains helped boost soil moisture and streamflow levels, as well as provided much-needed moisture to stressed crops in Georgia and South Carolina. In response, areas of Abnormally Dry (D0), Moderate Drought (D1), and Severe Drought (D2) were reduced or removed in Alabama, Florida, Georgia, and the Carolinas. Some portions of southeastern Georgia, however, largely missed out on the heavier rainfall accumulations leaving creeks and rivers continuing to flow at below normal (8th to 22nd percentile range) levels. In this area, a pocket of Severe Drought (D2) slightly expanded on the map in response to growing precipitation deficits ranging from 4-to-8 inches during the past 90 days. According to the USDA (for the week ending June 9th), the percentage of topsoil moisture by state rated short to very short was as follows: Alabama 28%, Florida 34%, Georgia 55%, South Carolina 31%, and North Carolina 18%. Across the region, average temperatures ranged from near normal to approximately 6 degrees above normal—with the greatest anomalies observed in southeastern Georgia, Florida, and coastal areas of North Carolina.
South
Widespread showers and thunderstorms impacted the region with the heaviest rainfall accumulations observed across portions of the Gulf Coast of Louisiana and Texas where 5-to-14 inches of rain fell. Elsewhere in the region, rainfall totals were generally less than 5 inches across Arkansas, Mississippi, Oklahoma, and Tennessee. On the map, areas of Abnormally Dry (D0) were reduced in eastern and central Tennessee as well as along the Gulf Coast of Texas, while areas of dryness expanded in South Texas. For the last 60 days, precipitation has been above normal across much of the region with the exception of South Texas, southeastern Louisiana, and western Tennessee. According to the USDA (for the week ending June 9th), the percentage of topsoil moisture rated short to very short was as follows: Arkansas 7%, Louisiana 14%, Oklahoma 2%, Tennessee 12%, and Texas 10%. For the period of June 2018 to May 2019, Arkansas and Oklahoma experienced their wettest 12-month period on record (1895–2019)—while Tennessee and Texas had their 2nd wettest on record for the same 12-month period, according to NOAA NCEI.
Midwest
The region remained drought-free on the map this week. The only change made on the map was the introduction of an area of Abnormally Dry (D0) in northeastern Minnesota where rainfall has been below normal during the past 30 days. Overall, the region has been anomalously wet during the past 12-month period, as well as on shorter-term time scales. According to the NOAA NCEI, the Upper Midwest and Ohio Valley Climate Regions (which encompass the entire Midwest) experienced their wettest 12-month period on record. These wet conditions impacted the agricultural sector and according to the USDA June 11th Weekly Weather and Crop Bulletin, only 67% of the nation’s corn and 39% of the soybeans had been planted. For the week, average temperatures were mainly above normal across the region with the greatest positive anomalies observed in northern portions where temperatures were 4-to-8 degrees above normal.
High Plains
On this week’s map, areas of Abnormally Dry (D0) and Moderate Drought (D1) expanded in northwestern North Dakota in response to short-term precipitation deficits (30–90 days) and reported drought impacts in the agricultural sector. According to the latest drought impact report from the North Dakota State Climate Office, some producers are starting to cull herds in northwestern North Dakota because of the arrival of drought conditions. Elsewhere in the region, some isolated shower activity (generally <1.5 inch accumulations) was observed this week in the eastern plains of Colorado, Montana, and Wyoming, while areas of central Kansas and Nebraska saw accumulations ranging from 1 to 3 inches. For the past 30 days, precipitation accumulations have been above normal across much of the region including Kansas, Nebraska, and South Dakota. Average temperature for the week were 2-to-8 degrees above normal in the eastern half of the region while western portions ranged from 1-to-6 degrees below normal.
West
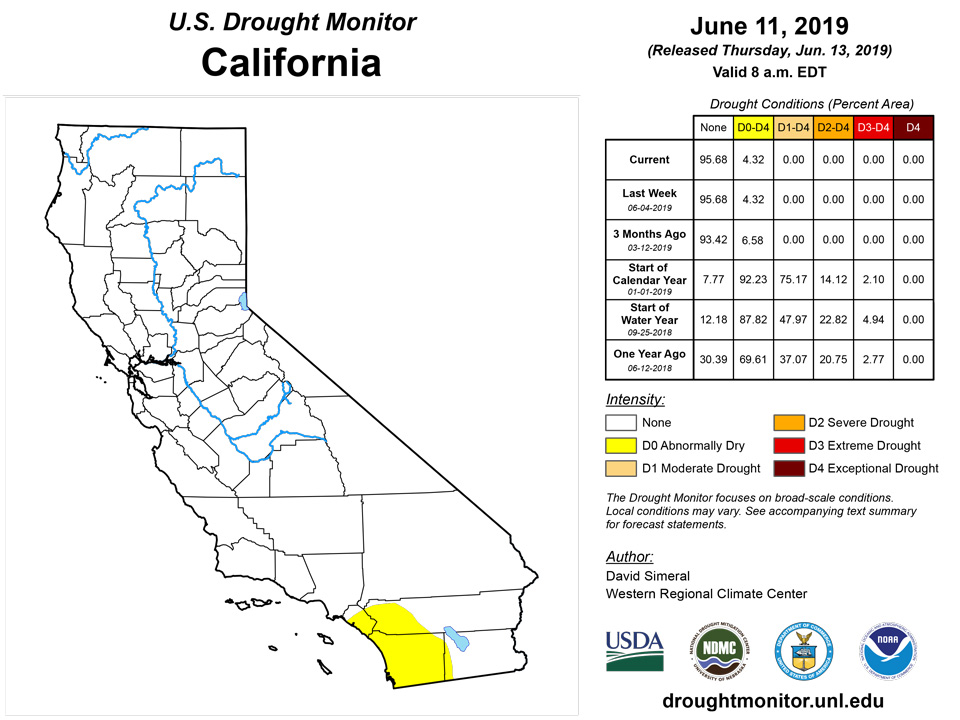
Across most of the region, dry conditions prevailed with the exception of some isolated shower activity in western Washington, the northern Rockies, as well as eastern Colorado and New Mexico where accumulations were generally less than an inch. In the Desert Southwest, a re-assessment of long-term drought conditions on the map for the Four Corners region led to reductions in areas of Abnormally Dry (D0) and Moderate Drought (D1) where the vast majority of drought indicators (within the last 12-months) and absence of drought impacts supported improvements. Both satellite-based vegetation health indices and reports on the ground have indicated widespread green-up across much of the Four Corners region. Some pockets of dryness still exist, however, in northwestern and north-central New Mexico that missed some of the precipitation events throughout the cool season. In the Panhandle of Idaho, areas of Abnormally Dry (D0) and Moderate Drought (D1) expanded in response to poor snowpack runoff and related low streamflow levels. According to the NRCS SNOTEL network, Water Year-to-Date (Oct 1st 2018 to present) precipitation accumulations in the northern Panhandle currently rank below the 10th percentile. In northeastern Montana, areas of Abnormally Dry (D0) were expanded in response to below-normal precipitation during the past 30 days. During the past week, average temperatures were well above normal across the Pacific Northwest, northern California, and the northern Rockies while the southern half of the region experienced below-normal temperatures.
Alaska, Hawaii, and Puerto Rico
No changes were made on this week’s map in Alaska or Puerto Rico. In the Hawaiian Islands, modest rainfall accumulations (3-to-5 inches) during the past 14-day period led to reductions in areas of Abnormally Dry (D0) and Moderate Drought (D1) on the windward slopes of the Big Island and Maui—while leeward slopes of the Big Island, Maui, and Molokai remained dry. Average temperatures for the week were above normal across the island chain with the exception of the higher elevations of the Big Island where temperatures were a few degrees below normal. In Alaska, generally dry conditions persisted this week across most of the state with some light accumulations (<1 inch) observed in parts of the Interior and Southeast. In the southeastern Alaskan city of Ketchikan, drought conditions are negatively impacting hydroelectric power production and forcing Ketchikan Public Utilities to augment power supplies with more costly diesel-power generators. Average temperatures for the week were above normal across much of Alaska, including the Southwest region that experienced temperatures 5-to-7 degrees above normal. In Puerto Rico, moderate-to-heavy rainfall accumulations (4-to-10+ inches) were observed across northwestern and north-central Puerto Rico.
Pacific Islands
The weather pattern during this USDM week (6/5/19-6/11/19) consisted of several features which comprised the Inter-Tropical Convergence Zone (ITCZ). A surface trough across Palau and Yap State, at times extending into central parts of the Federated States of Micronesia (FSM), and a weak circulation in western Yap State near the end of the week, combined with upper-level divergence associated with an upper-level trough over western Micronesia to generate rounds of showers and thunderstorms over Palau and western FSM. Surface troughs, converging trade winds, and trade-wind disturbances generated showers and thunderstorms over parts of the Marshall Islands (RMI) and eastern FSM, although dry trade winds mostly dominated the northern RMI. Descending air and dry trade winds kept precipitation sparse over the Marianas. A broad area of high pressure lingered over the Samoan Islands at the beginning of the week, with mid-level moisture and instability convergence moving into the region near the end of the week.
Satellite-based estimates of 7-day precipitation (QPE) showed a broad band of ITCZ precipitation which stretched across the western Pacific between the equator and about 10 degrees N latitude. Precipitation within this band was estimated to amount to 1-4 inches, with locally more than 4 inches, over Palau and western FSM and parts of the southern RMI, but mostly less than an inch across eastern FSM and adjacent RMI. The QPE showed a band of precipitation from western Micronesia stretching south of the equator southeastward toward the Samoan Islands. In the vicinity of the Samoan Islands, most of the 1-3 inches of rain was indicated just south and west of American Samoa.
Rainfall was below the 1-inch weekly minimum needed to meet most water needs on all three islands analyzed in the Mariana Islands. Saipan saw 0.38 inch of rain and Rota saw 0.17 inch leaving extreme drought for both (D3). Guam only received 0.13 inch of precipitation this week and remains in severe drought with dryness having lasted less than 6 months (D2-S).
Palau received 5.67 inches of rain this week following the 2.93 inches of rain that fell last week. Both totals are well above the 2-inch weekly minimum needed to meet most water needs, and the June total (7.96 inches) is already close to the 8-inch monthly minimum. Because of this, severe drought (D2-S) was changed to moderate drought (D1-S) with dryness having lasted less than 6 months.
In the Federated States of Micronesia, Yap met the 2-inch weekly minimum this week (2.38 inches; 1 day missing) but remains in short-term severe drought (D2-S) due to dryness the previous 4 months. Woleai saw 4.41 inches of precipitation this week and has recorded 10.05 inches of precipitation so far in June but remains in moderate drought (D1-S) after improvement from severe drought (D2-S) last week. Fananu (2.24 inches; 1 day missing) and Chuuk Lagoon (1.95 inches; 1 day missing) saw precipitation totals near the 2-inch weekly minimum but remain in severe drought (D2-S) since previous weeks and months were dry. Kapingamarangi (0.67 inch; 1 day missing), Pingelap (1.10 inches; 1 day missing), and Kosrae (1.59 inches; 1 day missing) were all somewhat dry this week but remain free of drought and abnormal dryness since they have all exceeded the monthly minimum in the recent past. Pohnpei was wet this week with 3.54 inches (1 day missing) and so remains free of drought and dryness.
The northern and central Marshall Islands remained relatively dry this week. Utirik saw yet another dry week with only 0.72 inch of rain while Wotje has seen no rain this week (1 day missing). Kwajalein and Ailinglapalap saw relatively wet conditions in May (10.71 inches and 10.28 inches, respectively) but only received 1.33 inches and 0.80 inch, respectively, this week. Kwajalein remains in moderate drought (D1-S) while Ailinglapalap remains abnormally dry (D0-S). Jaluit saw only 0.39 inch this week and remains abnormally dry (D0-S). In contrast, wet conditions continued for the second week in a row for Majuro (2.21 inches; 2 days missing) and Mili (5.48 inches). Majuro remains abnormally dry (D0-S) since it was just improved from moderate drought (D1-S) last week and was especially dry in April. Mili remains free of drought and dryness.
Pago Pago recorded 3.08 inches of precipitation this week, which is above the 2-inch weekly minimum. Along with the wet conditions in previous months, there is no concern of dryness or drought at this time.
Virgin Islands
At the beginning of the U.S. Drought Monitor (USDM) week, an upper-level trough present over the region along with sufficient moisture led to the production of showers in the northern U.S. Virgin Islands (USVI), especially on Wednesday and Thursday. About 0.50 to 1.25 inches of rain fell over St. Thomas and St. John according to Doppler radar estimates. Through the end of the week and into the weekend, precipitable water decreased to below-normal levels causing a reduction in shower activity. A tropical wave passed south of the area Monday resulting in some passing showers. By Tuesday, a strengthening ridge to the north of the USVI and below-normal precipitable water combined to strengthen the trade wind cap inversion and produce primarily fair weather.
On St. Croix, only trace amounts of precipitation were recorded at Rohlsen Airport this week, while 0.05 inch was recorded at Christiansted Fort on June 10. (The rest of the week’s data is missing.) At Rohlsen Airport, SPI values at the 1- and 3-month time scales (0.31 and 0.09, respectively) indicate no drought or dryness, but the 9- and 12-month SPIs (-1.27 and -1.37, respectively) indicate D1 and D2, respectively. Although this week was dry on St. Croix, May precipitation ranged from 106% to 151% of normal at Rohlsen Airport, Christiansted Fort, East Hill and Montpellier. Therefore, abnormally dry conditions with lasting impacts from drier conditions in the previous 6 plus months remain on St. Croix (D0-L).
King Airport on St. Thomas recorded 0.24 inch of precipitation this week from showers on the morning of June 5. Trace amounts of precipitation were also recorded June 6 and June 10. The 1-month SPI value for the King Airport is 0.12, indicating no drought or dryness. SPI values at the 3-, 6-, 9- and 12-month time scales all indicate moderate drought (D1) with values of -0.89, -1.17, -1.11, and -1.04, respectively. The island remains abnormally dry this week with lingering impacts from more intense drought earlier this year (D0-L).
Moderate to heavy rain was observed on St. John on the morning of June 6 due to a nearly stationary cell. The rain was heavy enough to warrant the issuance of a flood advisory by the NWS in San Juan. According to doppler radar estimates, approximately 0.50 to 1.25 inches of rain fell around the island. At East End, 1- and 12-month SPI values (0.13 and -0.43, respectively) calculated using data through the end of May indicate drought-free conditions, while the 3-month SPI (-0.61) indicates abnormal dryness (D0), and the 6- and 9- month SPI values (-0.77 and -0.86, respectively) indicate moderate drought (D1) conditions. With the shower activity earlier this USDM week, and after consideration of the SPI values, St. John remains abnormally dry with lingering impacts from drier conditions on a longer-term scale (D0-L).
Looking Ahead
The NWS WPC 7-Day Quantitative Precipitation Forecast (QPF) calls for moderate-to-heavy accumulations ranging from 2-to-4 inches across eastern portions of the Southern Plains, lower Midwest, and coastal areas extending from Georgia to North Carolina. Lesser accumulations (<2 inches) are forecasted for portions of the upper Midwest, Northeast, southern Florida, and the northern Rockies of Montana and Wyoming. Elsewhere in the West, dry conditions are expected. The CPC 6–10-day outlook calls for a high probability of above-normal temperatures across the Far West and Great Basin while areas of the Intermountain West, Great Plains, and much of the Midwest are expected to be below normal. Above-normal temperatures are forecasted for an area extending from Texas to the Southeast and northward along the Mid-Atlantic states. In Alaska, temperatures across the state are forecasted to be above normal. In terms of precipitation, there’s a high probability of above-normal precipitation across the Intermountain West and eastern half of the continental U.S., while the Pacific Northwest and eastern portions of the Desert Southwest are expected to be below normal.
Author(s):
David Simeral, Western Regional Climate Center
Claire Shield, National Drought Mitigation Center
Dryness Categories
D0 Abnormally Dry—used for areas showing dryness but not yet in drought, or for areas recovering from drought.
Drought Intensity Categories
D1 Moderate Drought
D2 Severe Drought
D3 Extreme Drought
D4 Exceptional Drought
Drought or Dryness Types
S Short-Term, typically less than 6 months (e.g. agricultural, grasslands)
L Long-Term, typically greater than 6 months (e.g. hydrologic, ecologic)
Source: National Drought Mitigation Center

