


California and National Drought Summary for June 18, 2019
Summary
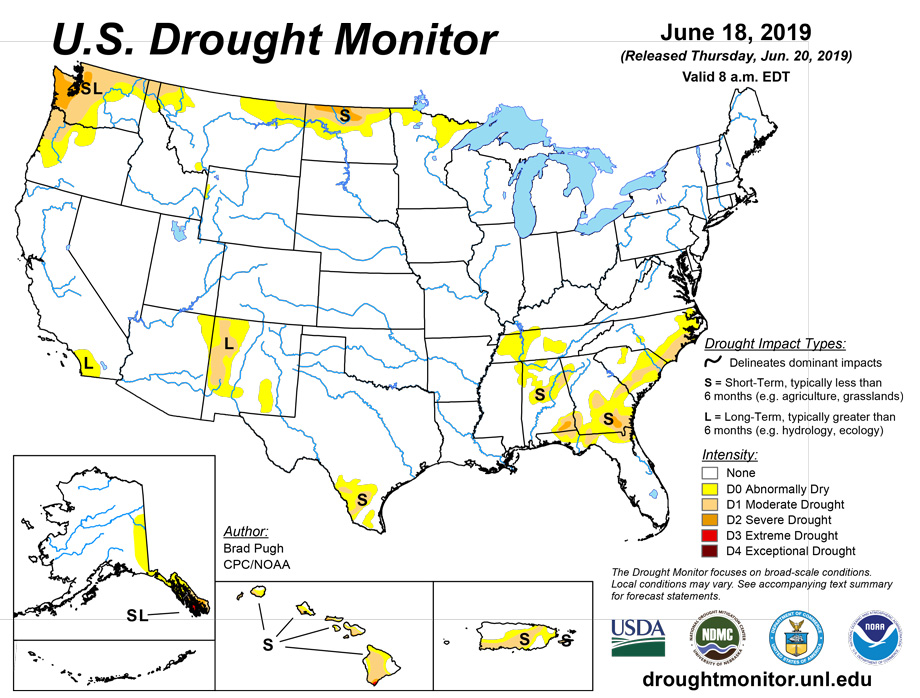
June 20, 2019 - A stationary front was a focus for frequent showers and thunderstorms with locally heavy rainfall from eastern South Carolina south to the Big Bend of Florida from June 11 to 14. The heavier rainfall resulted in short-term rainfall surpluses and drought elimination to parts of the Coastal Plain of Georgia and South Carolina. Another cold front progressed slowly south and east across the Great Plains, Corn Belt, and Mississippi Valley from June 14 to 16 before becoming stationary. Locally heavy rain (more than 2 inches) and hundreds of severe weather reports were common across the central and southern Great Plains, middle to upper Mississippi Valley, and Ohio Valley during mid-June. Excessively wet conditions continue to slow the emergence of corn and soybeans across the Corn Belt. Meanwhile, drought intensified across northern North Dakota due to a lack of rainfall since April. A strong ridge of high pressure resulted in dry weather and record high temperatures (June 11 and 12) across the Pacific Northwest where drought is also intensifying. Suppressed rainfall continues to affect parts of Puerto Rico.
Northeast
Scattered showers and thundershowers fell throughout much of the Northeast during early to mid-June with the heaviest 7-day totals (more than 2 inches) across the northern mid-Atlantic and western to central Pennsylvania. 30-day precipitation has averaged at or above normal for most of this region although a small pocket of below average precipitation is located in the lower Hudson River Valley and southern New England. 28-day streamflows remain normal to much above normal throughout the Northeast with this region completely free of abnormal dryness since mid-April.
Southeast
Very heavy rainfall (5 to 11 inches) during the preceding week prompted a 2-category improvement from moderate drought (D1) to an absence of abnormal dryness from Charleston, SC southwest to Savannah, GA. Since June 1, rainfall amounts have totaled 16.72 inches near Bluffton, SC. This 2-cateory improvement coincides with where 30 to 90-day precipitation surpluses are now observed and there is no longer support for abnormal short-term dryness. Despite these improvements, it should be noted that hot temperatures earlier in the month damaged corn in the reproductive stage. Moderate drought (D1) persists across southeast North Carolina along with the Pee Dee region of northeast South Carolina where field corn was rolled up and pasture conditions were poor. Recent, heavier rainfall also led to improvements across parts of southern Georgia and northern Florida. A small area of severe drought (D2) remains centered over Ware County in southeast Georgia. The 28-day streamflow along the Satilla River near Waycross, Georgia is at the 9th percentile. Drought severity was degraded to severe (D2) in parts of southeast Alabama due to large precipitation deficits from 30 to 180 days along with low streamflows. The 28-day streamflow along the Choctawhatchee River in Dale County of southeast Alabama is below the 8th percentile. The D2 area is generally consistent with where 180-day precipitation deficits range from 8 to 12 inches. As of June 18, moderate drought (D1) remains centered over Leon County in northern Florida with a year-to-date precipitation deficit of 10.26 inches.
South
7-day rainfall anomalies (June 11 to 17) varied across the southern Great Plains, lower Mississippi Valley, and Tennessee Valley which is typical for this time of year. The heaviest rainfall (2 to 4 inches, locally more) was observed across scattered areas of Oklahoma, eastern Texas, and the Texas Gulf Coast. Less than an inch of rainfall was generally observed across most of Arkansas and adjacent areas of northwest Mississippi and western Tennessee. The Vegetation Drought Response Index (VegDRI) continues to reflect moist conditions throughout much of this region. Soil moisture remains above the 99th percentile across most of Oklahoma and northern Texas. According to the Oklahoma Mesonet, the northeast quarter of Oklahoma has received 12 to 18 inches of rainfall during the past 30 days. Abnormal dryness was expanded slightly across parts of the Tennessee Valley in areas where 60-day precipitation averages 50 to 75 percent of normal. However, much of this region remains drought-free since 28-day streamflows and soil moisture do not support a drought designation at this time. A slight expansion of abnormal dryness (D0) and moderate drought (D1) was necessary across Deep South Texas due to increasing short-term rainfall deficits and periods of above normal temperatures during the past month.
Midwest
A majority of the Midwest remains excessively wet with precipitation averaging 150 to 200 percent of normal dating back 180 days. Due to the wet winter and spring, soil moisture remains above the 99th percentile across much of the Corn Belt. According to the USDA Weekly Weather and Crop Bulletin (valid on June 16), 79 percent of the nation’s corn had emerged which is 18 percentage points behind last year and the average. Only 55 percent of the soybeans had emerged which is 34 percentage points behind last year and 29 points behind the average. Moderate flooding continues along the middle Mississippi and Illinois Rivers. Farther to the north, a slight expansion of abnormal dryness (D0) was depicted for parts of northern Minnesota due to increasing short-term precipitation deficits.
High Plains
Late May through mid-June is typically a wetter time of year across the northern Great Plains. However, during the past 60 days, parts of northwest North Dakota have received less than 50 percent of their normal rainfall. Given the lack of rainfall since the snow melt in early April, multiple adverse impacts to agriculture and livestock are being reported across the northern tier of counties in North Dakota. These reports include: lack of forage production on pastures, culling of cattle herds, and delayed crop growth. Based on the increasing short-term deficits, soil moisture conditions, and reported impacts, severe drought (D2) is warranted for parts of northern North Dakota. A lack of late spring rainfall also continues to result in an expansion of abnormal dryness (D0) and moderate drought (D1) across the northern half of North Dakota. In contrast to the worsening conditions across North Dakota, abnormal dryness was removed from the Big Horn Mountains of Wyoming based on a continuation of a favorably wet pattern through May and June.
West
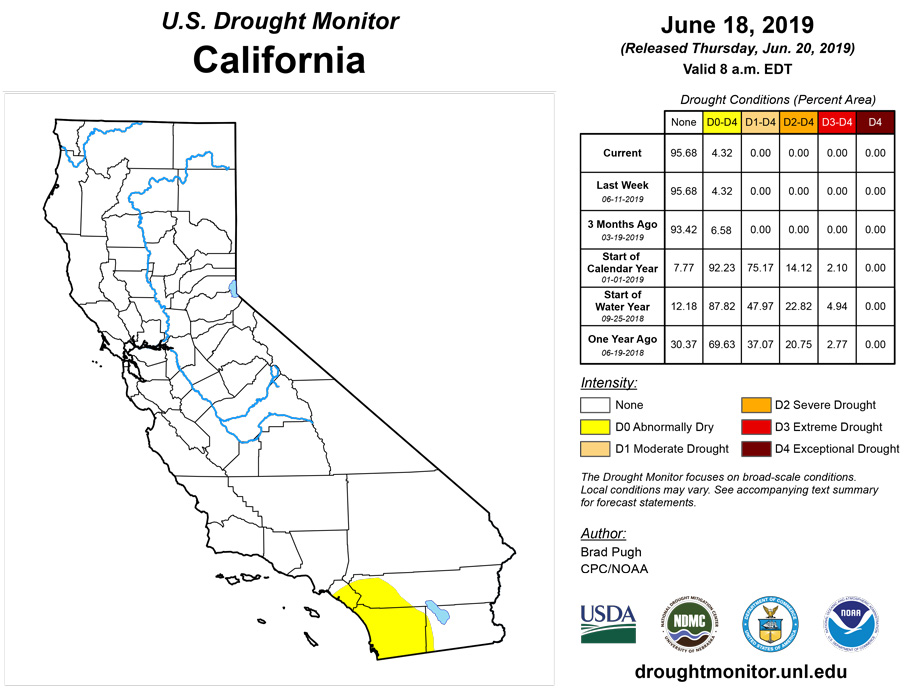
The month of May tied for the 9th warmest for Washington dating back to 1895 and statewide March thru May tied for the 13th driest period on record Based on 90-day precipitation deficits of more than 8 inches along with 28-day streamflows and soil moisture below the 10th percentile, severe drought (D2) was expanded across western Washington. Levels along Rimrock Lake are extremely low with adverse impacts to boating docks. Record high temperatures during early June also played a role in the intensification of drought across western parts of Washington and Oregon. On June 12, a daily-record high of 95 degrees F was set in Seattle. In Oregon, daily-record highs on June 12 included: 98F at Portland, 99F at Medford, and 101F at Roseburg. The expansion this week of D0 and D1 across Oregon and Washington is generally reflective of the current 28-day streamflows. Long-term D0 remains in parts of southern California due to the multi-year drought. Elsewhere across California and the Great Basin, many reservoirs are full and 28-day streamflows remain high after the onset of the snowmelt season.
Alaska, Hawaii, and Puerto Rico
The southern Alaska Panhandle had its driest June 2018 through May 2019 period on record, which supports the ongoing extreme drought (D3). Based on low 28-day streamflows along the Yukon River in eastern mainland Alaska and below average precipitation from March through May 2019, abnormal dryness (D0) was introduced to eastern mainland Alaska. 90-day precipitation has averaged less than 50 percent of normal across southwest and south-central Puerto Rico. Also, as of June 18 the year-to-date precipitation deficit at San Juan, Puerto Rico is 8.57 inches. Based on these increasing precipitation deficits, moderate drought (D1) was expanded to include more of southern Puerto Rico and the San Juan area. No changes were made this week to the drought status in the Hawaiian Islands.
Pacific Islands
The weather pattern during this USDM week (6/12/19-6/18/19) consisted of Inter-Tropical Convergence Zone (ITCZ) convection across southern Micronesia while a dry trade-wind pattern dominated across the north. The ITCZ convection was triggered by trade-wind convergence, surface troughs, and tropical disturbances, including a circulation of interest labeled Invest 94W over western Yap State and Palau. An upper-level low northeast of the Marianas teased the islands with showers which mostly kept offshore. A warm, humid, and unstable air mass brought rain to American Samoa early in the week, but drier and more stable air dominated the weather for most of the week.
Satellite-based estimates of 7-day precipitation (QPE) showed a broad band of precipitation across southern Micronesia, with an inch or more from roughly 7 degrees North latitude to the equator. Four inches or more of rainfall was indicated over the west south of about 6 degrees N, in the vicinity of 94W, and south of 4 degrees N over central and eastern Micronesia in the areas of most intense ITCZ convection. Little to no rainfall was indicated on the QPE over northern areas of Micronesia. A band of 4+ inches of rain was indicated on the QPE south of the Samoan Islands, with a thumb of 2-4 inches extending northward near American Samoa.
Showers were observed in the Mariana Islands this week, although rainfall totals were well below the 1-inch weekly minimum needed to meet most water needs. Saipan saw 0.66 inch of rain and Rota recorded 0.08 inch so both islands remain in extreme drought (D3). Guam picked up only 0.20 inch of rain this week. After a few weeks of rain at the end of May and beginning of June, conditions on Guam were improved to severe drought (D2-S). But with dry conditions again the last two weeks, Guam deteriorated to D3-S again this week.
Palau recorded 2.26 inches of rain this week bringing the June total to 10.20 inches already. Due to dry conditions in February through May, Palau remains in moderate drought (D1-S) with dryness having lasted less than 6 months.
It has been a relatively wet June so far for a portion of the Federated States of Micronesia. Woleai saw 3.69 inches of rain this week (2 days missing) bringing the June total to 13.74 inches. With all the precipitation the last few weeks, moderate drought (D1-S) improved to abnormal dryness (D0-S) this week with dryness having lasted less than 6 months. Chuuk Lagoon recorded 5.41 inches this week (1 day missing) which follows the 2.94 inches that fell last week and the 3.73 inches that fell during the week of May 28. Severe drought (D2-S) was improved to moderate drought (D1-S). Lukunor saw 2.31 inches of rain this week (1 day missing) and has seen 11.63 inches of rain in June already, so drought-free conditions remain. Precipitation this week at Nukuoro (2.59 inches; 1 day missing), Kapingamarangi (5.80 inches; 1 day missing), Pohnpei (6.32 inches), Pingelap (5.40 inches), and Kosrae (4.34 inches) all exceeded the 2-inch weekly minimum needed to meet most water needs, so each location remains free of drought and dryness. In contrast, dry conditions were found on Yap (0.99 inch; 2 days missing) and Fananu (1.02 inches; 2 days missing) this week, so severe drought (D2-S) remains on both islands.
Much needed rain fell on Utirik this week (2.25 inches), but exceptional drought with dryness on short- and long-term time scales (D4-SL) remains since one week of adequate rain is not enough to improve drought conditions. Wotje remained very dry with no rain this week (1 day missing) and so remains in exceptional drought (D4-SL). Kwajalein saw its third dry week in a row (0.62 inch) and remains in moderate drought (D1-S). Meanwhile, Jaluit recorded 1.26 inches of precipitation this week marking the fourth week in a row below the 2-inch weekly minimum. Because precipitation in April and May also failed to meet the 8-inch monthly minimum, abnormal dryness (D0-S) was degraded to moderate drought (D1-S) on Jaluit this week. Majuro saw 1.21 inches of rain this week (1 day missing) and remains abnormally dry (D0-S). Mili recorded only 0.75 inch this week (1 day missing) but has already seen 9.53 inches of rain in June and so remains drought-free. Ailinglapalap was the only location to receive abundant rain this week (3.58 inches), but remains abnormally dry (D0-S) since drier conditions were observed in previous weeks.
Pago Pago recorded 1.79 inches of rain this week and remains drought-free since previous months saw adequate rainfall.
Virgin Islands
Stable and somewhat dry conditions were present over the U.S. Virgin Islands (USVI) region at the beginning of this U.S. Drought Monitor (USDM) week (June 12-13) leading to primarily fair weather conditions. Beginning Friday and continuing through Monday, two weak tropical waves passed over the area causing an increase in low-level moisture and some showers. Organized convection, however, was not present due to the lack of upper-level forcing, and observed rainfall at each station was less than 0.20 inch. On Monday and into Tuesday, surface high pressure over the Atlantic brought easterly to southeasterly winds to the area and drier, more stable conditions causing a reduction in shower activity.
On St. Croix, Rohlsen Airport saw 0.14 inch of rain this week with trace amounts of precipitation recorded on four other days. June precipitation has totaled 0.16 inch so far compared to the 1.42-inch normal (11% of normal) and is on track to be the fifth driest June on record (since 1951). However, the Rohlsen Airport May precipitation total was 151% of normal (10th wettest on record) and the March-May spring total was near the median value of the period of record. Fort Christiansted saw only 0.09 inch of rain this week, but because 1.20 inches of precipitation fell on June 3, the monthly precipitation total through June 17 is 1.34 inches, or 79% of normal. One- and 3-month SPI values at Rohlsen Airport (0.43 and 0.11, respectively) still indicate no drought, while the 6-month SPI value of -0.83 indicates moderate drought (D1) and 9- and 12-month SPI values (-1.47 and -1.37, respectively) indicate severe drought (D2). St. Croix remains abnormally dry this week with lingering impacts from drier conditions on time scales longer than six months (D0-L).
St. Thomas’s King Airport recorded 0.15 inch of rain this week with trace amounts of precipitation on a couple of additional days. The monthly sum of precipitation through June 18 is 0.44 inch compared to the 1.32-inch normal (33% of normal). As of now, June 2019 is on pace to be approximately the 14th driest (since 1953, but with data gaps some years). If it were to not rain again the entire month, it would be the eighth driest June on record. May precipitation was near the median value while April was the 10th driest. The March-May precipitation total was the 16th driest. A CoCoRaHS station near Anna’s Retreat saw 0.04 inch of rain through June 15. The 1-month SPI value at King Airport (0.47) indicates drought-free conditions, but the 3-, 6-, 9- and 12-month SPI values (-0.95, -1.01, -1.07, and -0.99, respectively) all indicate moderate drought (D1). Abnormal dryness continues for St. Thomas with drier conditions on a longer-term scale (D0-L).
With the lack of precipitation data from the island, St. John was not analyzed this week.
Looking Ahead
During the next 5 days (June 20-24, 2019), a couple of cold fronts are forecast to progress east across the northern half of the central and eastern U.S. On June 20, locally heavy rain (more than 1 inch) is expected to accompany a cold front as it crosses the Northeast and northern mid-Atlantic. A second frontal system is likely to trigger severe thunderstorms with heavy rainfall across the central U.S. The NWS WPC 5-day quantitative precipitation forecast (QPF) calls for widespread amounts of 1 to 3 inches, locally more, from eastern portions of the central and southern Great Plains east to the Midwest and Ohio Valley. Dry weather is likely to persist across southern Texas and the Pacific Northwest. The most anomalous warmth is expected across the Gulf Coast States. Overall suppressed rainfall is expected to continue for Puerto Rico through late June.
The CPC 6-10 day outlook (June 25-29, 2019) favors above-normal temperatures across much of the central and eastern U.S. with below-normal temperatures lingering over the western U.S. Enhanced odds for above-normal precipitation are forecast for much of the eastern U.S., Ohio and Tennessee Valleys, middle to lower Mississippi Valley, and southern Great Plains. A slight tilt in the odds for below-normal precipitation is forecast for southern areas of Florida and Texas, the High Plains, and central to southern Rockies. A relatively warm and dry pattern is most likely to persist across Alaska.
Author(s):
Brad Pugh, NOAA/CPC
Claire Shield, National Drought Mitigation Center
Dryness Categories
D0 Abnormally Dry—used for areas showing dryness but not yet in drought, or for areas recovering from drought.
Drought Intensity Categories
D1 Moderate Drought
D2 Severe Drought
D3 Extreme Drought
D4 Exceptional Drought
Drought or Dryness Types
S Short-Term, typically less than 6 months (e.g. agricultural, grasslands)
L Long-Term, typically greater than 6 months (e.g. hydrologic, ecologic)
Source: National Drought Mitigation Center

