


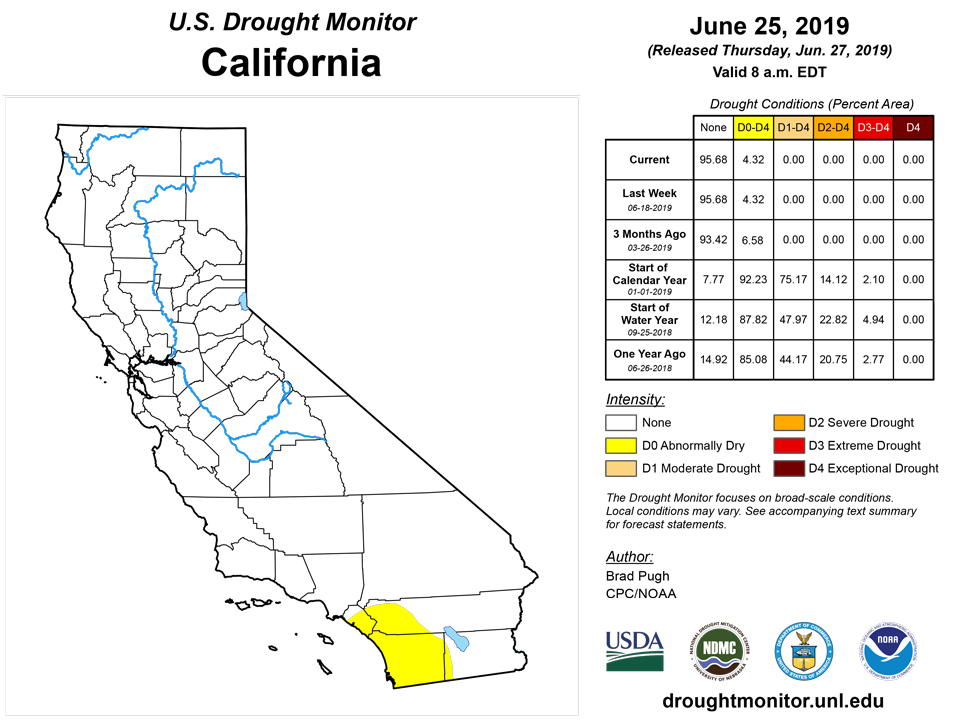
California and National Drought Summary for June 25, 2019
Summary
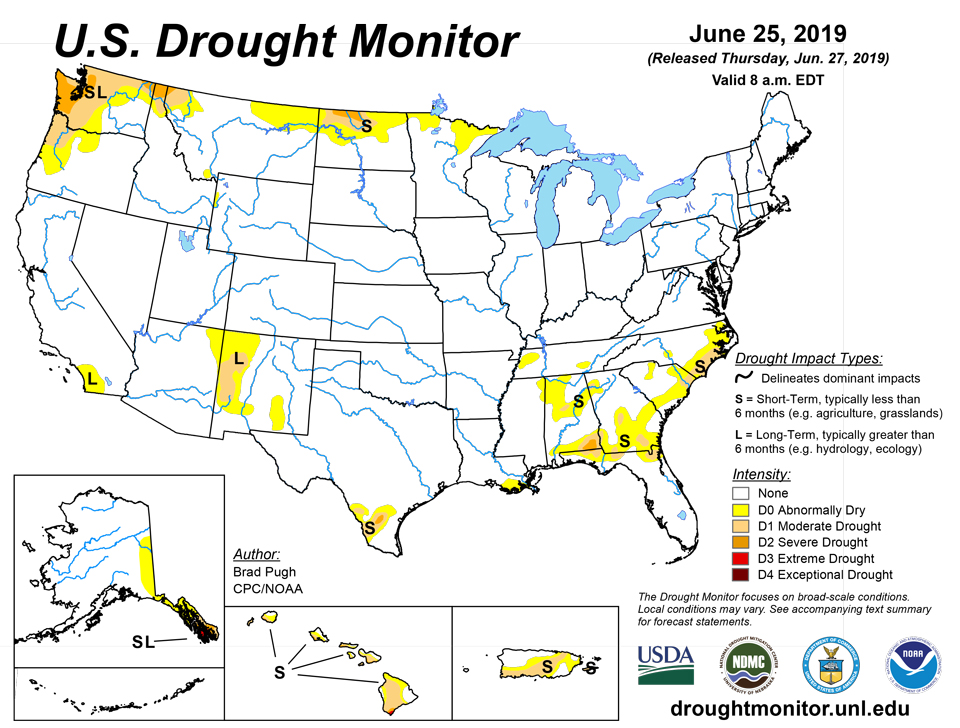
June 27, 2019 - Multiple cold fronts progressed across the central and eastern U.S. during mid to late June with widespread showers and thundershowers from the Great Plains east to the East Coast. During the past week (June 18 to 24), heavy rainfall (2 to 6 inches) maintained excessively wet conditions across eastern portions of the Great Plains, middle Mississippi Valley, and Ohio Valley. Diurnal convection resulted in locally heavy rainfall (more than 2 inches) from the Florida Panhandle south to the central Florida Peninsula. An unseasonably strong low pressure system resulted in accumulating snow to the northern and central Rockies on the first full day of the summer. More than a foot of snow was observed at elevations above 9,000 feet in the Colorado Rockies. During mid to late June, cooler-than-normal temperatures persisted throughout the western and central Corn Belt. Above average rainfall has occurred throughout a majority of the central and eastern U.S. during the past 30 days, with below average rainfall limited to scattered areas of the Southeast, south Texas, the northern Great Plains, upper Mississippi Valley, and Pacific Northwest.
Northeast
Occasional showers and thundershowers accompanied frontal passages across the Northeast during the past couple of weeks, maintaining normal to above normal stream flows and soil moisture above the 70th percentile. During the past 30 days, rainfall has averaged more than 4 inches above normal across parts of the central Appalachians and northern mid-Atlantic. Although parts of New England have been slightly drier-than-normal recently, a lack of abnormal heat has limited evapotranspiration rates for this time of year. The Northeast has remained drought-free since November 2018.
Southeast
Drought amelioration continued across the Coastal Plain of Georgia and South Carolina with 2-week rainfall amounts of more than 3 inches observed at many locations. This recent rainfall and 28-day stream flows close to average support the improving conditions. However, abnormal dryness (D0) continues across parts of the Piedmont of South Carolina where rainfall has been erratic during the past two months. The abnormal dryness (D0) coverage generally coincides with where 60-day precipitation deficits exist. Moderate to severe drought (D1-D2) continues across the Pee Dee region of South Carolina, southeast North Carolina, and Alabama and Georgia which largely missed the beneficial rainfall. Low 28-day stream flows are currently observed along the Satilla, Suwannee, and St. Mary’s Rivers in southeast Georgia. Severe drought was maintained in southeast Alabama since the 28-day stream flows along the Choctawhatchee River near Newton, Alabama remains below the 10th percentile. The year-to-date precipitation deficit at Dothan, Alabama is 11.50 inches, as of June 25. The coverage of abnormal dryness (D0) was extended west towards Mobile Bay due to insufficient rainfall and recent heat. The abnormal dryness (D0) and moderate drought (D1) areas extend slightly south into the Florida Panhandle and northeast Florida, although the southward extent has decreased the past two weeks. As of June 25, the year-to-date precipitation deficit at Tallahassee, Florida is 11.67 inches.
South
Frequent thunderstorms resulted in widespread, heavy rainfall (2 to 4 inches, locally more) throughout the Tennessee Valley during the past week (June 18 to 24). Due to the recent heavy rainfall, the coverage of abnormal dryness (D0) was reduced across Tennessee and northern Alabama. In addition to the heavy rainfall, numerous severe weather reports (mostly wind damage) were recorded on June 19 and 21. The Vegetative Health Index (VHI) reflects moist conditions throughout much of the region. According to the Oklahoma Mesonet network, the northeast quarter of Oklahoma has received 20 to 33 inches of rainfall during the past 60 days. Increasing 30 to 60-day precipitation deficits along with slightly above normal temperatures since mid-June led to the addition of abnormal dryness (D0) to Lafourche and Terrebonne Parishes in southeast Louisiana. Heavy rainfall (localized max of 10 inches) eliminated abnormal dryness in parts of southern Texas. However, the core drought areas in the Rio Grande Valley missed this recent rainfall thus leading to a slight increase in D1 (moderate drought) and the addition of D2 (severe drought) in Duval County.
Midwest
Excessively wet conditions persist across the middle Mississippi Valley, Ohio Valley, and much of the Corn Belt, with precipitation averaging 150 to 200 percent of normal dating back 180 days. According to the National Centers for Environmental Information, the meteorological spring of 2019 ranked in the top-ten for wetness in the following states: Illinois, Indiana, Iowa, Missouri, and Wisconsin. Due to the wet winter and spring, soil moisture remains above the 99th percentile across much of the Corn Belt. According to the USDA Weekly Weather and Crop Bulletin (valid on June 23), corn emergence was behind average by 20 percentage points or more in Michigan and Ohio. Only 67 percent of the soybeans in Illinois had emerged by June 23 which is 26 percentage points behind average. Moderate flooding continues along the middle Mississippi River. Farther to the north, abnormal dryness (D0) was depicted for parts of northern Minnesota due to an increasing short-term precipitation deficit.
High Plains
An increase in rainfall (1.5 to 3 inches) this past week (June 18 to 24) resulted in a slight reduction of D1 to D2 (moderate to severe drought) across North Dakota. In addition, 7-day maximum temperatures averaged 4 to 8 degrees F below normal throughout the northern Great Plains. Maximum temperatures remained below 80 degrees F from June 15 to 24 at Minot, North Dakota. Large variations in soil moisture continue with excessively wet conditions (above the 99th percentile) across Kansas, Nebraska, and South Dakota, while soil moisture falls below the 20th percentile across northern North Dakota. According to the National Centers for Environmental Information, Kansas had its wettest meteorological spring (March to May 2019) on record.
West
Following a dry spring across northeast Montana, more frequent rainfall occurred this past week (June 18 to 24) with 7-day rainfall amounts mostly above 2 inches. Due to this wet week and increase in topsoil moisture, an elimination of moderate drought (D1) was warranted. Moderate drought (D1) was expanded south across northern Idaho due to increasing 30 to 90-day precipitation deficits. Since 28-day stream flows have fallen below the 10th percentile, severe drought (D2) was introduced to parts of northern Idaho and adjacent areas of northwest Montana and northeast Washington. Also, 90-day SPI values generally support the expansion of moderate drought and addition of severe drought. Based on the Vegetative Health Index, the long-term drought (D1) area was reduced across western New Mexico. Following notable changes in the spatial extent and severity of drought conditions in the Pacific Northwest the previous week, no changes were necessary this week due in part to much cooler temperatures. Severe drought (D2) remains over parts of Washington which experienced its 13th driest March to May on record.
Alaska, Hawaii, and Puerto Rico
The southern Alaska Panhandle had its driest June 2018 through May 2019 period on record, which supports the ongoing extreme drought (D3). Although parts of drought-stricken areas of Alaska have received beneficial rainfall, long-term deficits persist. 28-day stream flows remain low along multiple rivers in the Alaska Panhandle and also along the Yukon River in eastern mainland Alaska. Although no changes were made to Hawaii this week, the Normalized Difference Vegetation Index) reflects slight improvement to the current D3 area depicted on the Big Island. On June 25, an unusual low pressure system for this time of year brought heavy rainfall to the western Hawaiian Islands, including a daily record of 4.20 inches at Honolulu. The effects of this heavy rainfall on the drought status in Hawaii will be reassessed next week. Suppressed rainfall persisted across much of Puerto Rico into late June. As of June 25, the year-to-date precipitation deficit at San Juan, Puerto Rico is 9.45 inches. After the previous week’s expansion of D0 and D1, no changes were made this week to the drought status for Puerto Rico.
Pacific Islands
The weather pattern during this USDM week (6/19/19-6/25/19) consisted of dry easterly trade winds across portions of northern Micronesia and Inter-Tropical Convergence Zone (ITCZ) convection across the southern and western portions, while upper-level lows north of Micronesia teased northern portions but didn't deliver much rain. The ITCZ convection consisted of surface troughs, weak circulations/tropical disturbances, and (in the east) converging or surging trade winds. One circulation (Invest 94W) moved across Yap State early in the week, then turned northwest to move across Palau and into the Philippine Sea. Other circulations developed over central and eastern Micronesia and slowly moved westward later in the week. South of the equator, high pressure dominated the weather over American Samoa, keeping a surface trough just north of the Samoan Islands for much of the week. The trough eventually sank southward, bringing rain to American Samoa later in the week. Satellite-based estimates of 7-day precipitation (QPE) for June 25 were not available, but the 7-day QPE for June 24 showed a large band of 2+ inches of rain across Palau and the Federated States of Micronesia (FSM), with patchy areas of 2+ inches of rain over the Republic of the Marshall Islands (RMI). Large areas of 4+ inches were embedded within the 2+ inch region over Palau and the FSM. Little to no rain was indicated across the Marianas or most of the northern RMI. An elongated band of 2+ inches of rain was indicated on the QPE north of the Samoan Islands, with little to no rain shown over American Samoa. In the Marianas, Guam was wet this week (1.26 inches of rain). But the last 3 weeks were dry, June is still dry for the month, and the last 4 months have been dry, so D3-S continued for Guam. The week was dry (less than the 1-inch weekly minimum) at both Rota (0.82 inch) and Saipan (0.61 inch), so D3 continued. With each of the last 4 weeks dry, and June dry so far, short-term dryness returned to Saipan, giving it a status of D3-SL, while Rota continued at D3-S. It was wet (more than the 2-inch weekly minimum needed to meet most water needs) at most stations in the FSM. On the wet side, rainfall reports ranged from 2.26 inches at Woleai (based on 3 days of data) to 9.92 inches at Pohnpei. On the dry side, Rumung reported 1.48 inches (with 3 days missing). This is the third consecutive wet week at Chuuk, and June so far is wet (12.04 inches). Woleai has been wet for the last 4 weeks, and has 16.14 inches for June so far. Yap (3.34 inches, with 2 days missing) and Fananu (3.03 inches with 1 day missing) were both wet this week and have nearly reached the monthly minimum for June. A 1-category improvement was made at Yap and Fananu (to D1-S), Chuuk (to D0-S), and Woleai (to D-Nothing). No data was received from Ulithi, so they were plotted as missing. D-Nothing continued at the remaining FSM stations. In Palau, Koror had 2.05 inches of rain, which is barely at the 2-inch minimum. June has been wet (12.25 inches so far), but the status continued at D1-S to reflect the dryness of the previous 5 months. In American Samoa, the last 2 weeks have been dry at Pago Pago, with 0.62 inch of rain recorded for the week and 5.54 inches so far for June. The automated station at Siufaga Ridge recorded 0.60 inch for the week and 4.32 inches so far in June, while the automated station at Toa Ridge recorded 0.41 inch for the week and 3.49 inches for June. But the previous 10+ months have been wet, so D-Nothing continued. In the RMI, Jaluit and Utirik were dry this week, so their status remained unchanged. Kwajalein had 2.21 inches of rain, but the previous 3 weeks were dry and June so far was still dry (4.43 inches), so D1-S continued. Wotje had some much-needed rain, 2.77 inches (with 1 day missing). But the month was still dry (3.22 inches) and it’s been so dry for so long, the status remained unchanged at D4-SL. Mili’s 4.07 inches of rain this week continued wet conditions (D-Nothing). Majuro reported 5.05 inches of rain this week, which brought the monthly total for June over the 8-inch threshold. Both May and June were wet, and the rains have helped raise the reservoir level, with 30.95 million gallons in the Majuro reservoirs. This is 98.26% full (from an operational perspective) and 86% of maximum capacity. But water rationing is still in effect, with water days still at 3 times per week, now 4 hours each day for the whole island instead of sectioning to 3 parts of the island. D0-S was continued at Majuro to reflect the continued rationing of reservoir water. Ailinglapalap had 4.55 inches of rain, which brought the June total to 8.99 inches. With the last 2 weeks wet, and the last 2 months wet (above minimum thresholds), the USDM status at Ailinglapalap was improved to D-Nothing.
Virgin Islands
The weather pattern during this USDM week (6/19/19-6/25/19) was dominated by high pressure (North Atlantic High/Bermuda High) which generated a dry easterly trade-wind flow across the U.S. Virgin Islands (USVI), Saharan dust which enhanced dry hazy conditions, and an upper-level trough over the western Caribbean which enhanced precipitation over western Puerto Rico but not over the USVI. A weak tropical wave moved into the region at the end of the week, bringing increased low level moisture but limited showers to the USVI. Periods of moderate to heavy rains were reported across portions of the USVI, but Tuesday morning radar estimates showed the rains (0.5-2.0 inches) limited mostly to St. John Island with little to none falling over St. Croix or St. Thomas. Only a trace of rain fell at the Henry Rohlsen Airport on St. Croix this week, leaving 0.16 inch for the month, which is 1.80 inches below normal or 8.2% of normal. Of the last 9 months, January and February 2019 had a lot of missing data, but not counting those months, 5 out of 7 were drier than normal. The year to date for 2019 is drier than normal at 57.0%. The Standardized Precipitation Index (SPI) is at D1-D3 levels for the last 6 to 12 months. With no substantial rain this week, and only 0.16 inch so far this month, the USDM status was changed from D0-L to D1-SL. Only a trace of rain has fallen at Cyril E King Airport on St. Thomas this week, leaving 0.44 inch for the month, which is 1.66 inches below normal or 21.0% of normal. Seven of the last 9 months have been drier than normal. The year to date for 2019 is drier than normal at 67.0%. SPI is at D1-D2 levels for the last 3 to 12 months. With no significant rain this week and the month so dry, the status was worsened to D1-SL. St. John was not analyzed this week due to the lack of precipitation data from the island.
Looking Ahead
During the next 5 days (June 27-July 1, 2019), an area of upper-level high pressure is likely to strengthen over the north-central U.S., resulting in a major warming trend across the Great Plains, Corn Belt, and Midwest. Maximum temperatures are forecast to peak in the middle 90s to near 100 (degrees F) across the central Plains and western Corn Belt. Due to the strengthening ridge aloft, the axis of heaviest rainfall (locally more than 1 inch) is expected to become focused from the northern Great Plains east to the upper Mississippi Valley and Great Lakes. An easterly wave of low pressure is forecast to shift west from the Gulf of Mexico and enhance scattered thundershowers with locally heavy rainfall across the western Gulf Coast. Scattered showers and below-normal temperatures are forecast across drought-stricken areas of the Pacific Northwest through June 28. Much above-normal temperatures along with below-average precipitation is forecast throughout much of Alaska. Ongoing heavy rainfall is expected to gradually ease across the western Hawaiian Islands. Below-average rainfall is likely to continue for Puerto Rico into the beginning of July.
The CPC 6-10 day outlook (July 2-6, 2019) favors above-normal temperatures across the north-central and eastern U.S. with the highest odds over the Southeast. Near to below-normal temperatures are most likely across the western U.S. Elevated chances for above-normal precipitation were forecast for much of the central and eastern U.S. although near to below-normal precipitation is favored across the Southeast. Increased chances for below-normal precipitation is forecast for the desert Southwest to begin July. A relatively warm and dry pattern is likely to persist across the Alaska Panhandle and southern mainland Alaska.
Author(s):
Brad Pugh, NOAA/CPC
Richard Heim, NOAA/NCEI
Dryness Categories
D0 Abnormally Dry—used for areas showing dryness but not yet in drought, or for areas recovering from drought.
Drought Intensity Categories
D1 Moderate Drought
D2 Severe Drought
D3 Extreme Drought
D4 Exceptional Drought
Drought or Dryness Types
S Short-Term, typically less than 6 months (e.g. agricultural, grasslands)
L Long-Term, typically greater than 6 months (e.g. hydrologic, ecologic)
Source: National Drought Mitigation Center

