


Credit: CAL FIRE
July 10, 2019 - CAL FIRE: Current Year Statistics as of July 7, 2019; The below statistics are tracked on a weekly basis and provide a snapshot of the number of fires and acres burned. These are preliminary numbers taken from our Computer Aided Dispatch (CAD) system, and will likely change as dispatched wildfires may end up being other types of fires or false alarms. These numbers are subject to change until the final fire season reports are completed and tabulated.
NUMBER OF FIRES AND ACRES:
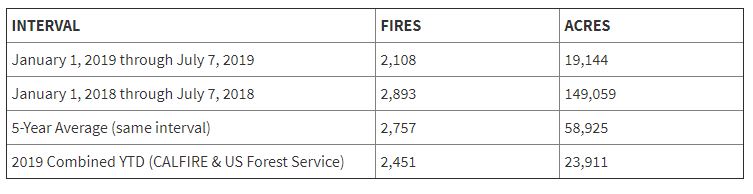
(Statistics include all wildfires responded to by CAL FIRE in both the State Responsibility Area, as well as the Local Responsibility Area under contract with the department. Statistics may not include wildfires in State Responsibility Area protected by CAL FIRE’s contract counties. Final numbers will be provided in the annual Wildfire Activity Statistics Report (Redbook) once it’s published.)
2018 Statistics and Events
The below statistics are tracked on a weekly basis and provide a snapshot of the number of fires and acres burned. These are preliminary numbers taken from our Computer Aided Dispatch (CAD) system, and will likely change as dispatched wildfires may end up being other types of fires or false alarms. These numbers are subject to change until the final fire season reports are completed and tabulated.
-
NUMBER OF FIRES AND ACRES:
Interval Fires Acres January 1, 2018 through December 30, 2018 6,284 876,147 January 1, 2017 through December 30, 2017 7,117 505,956 5 year average (same interval) 5,756 233,483 2018 Combined YTD (CALFIRE & US Forest Service) 7,571 1,671,203
(Statistics include all wildfires responded to by CAL FIRE in both the State Responsibility Area, as well as the Local Responsibility Area under contract with the department. Statistics may not include wildfires in State Responsibility Area protected by CAL FIRE’s contract counties. Final numbers will be provided in the annual Wildfire Activity Statistics Report (Redbook) once it’s published.)

