


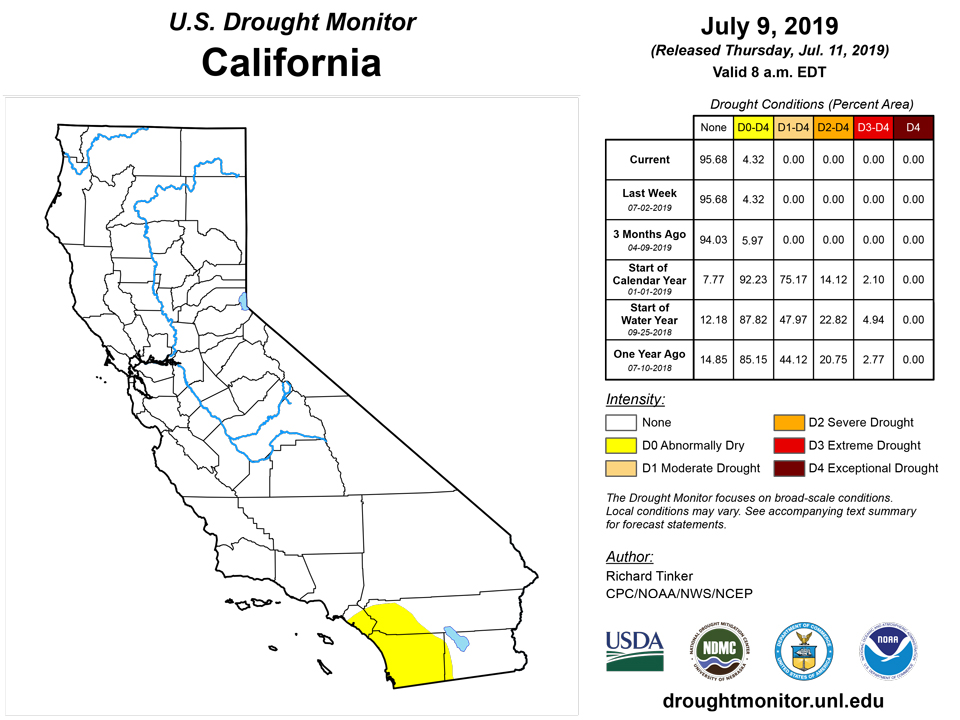
California and National Drought Summary for July 9, 2019
Summary
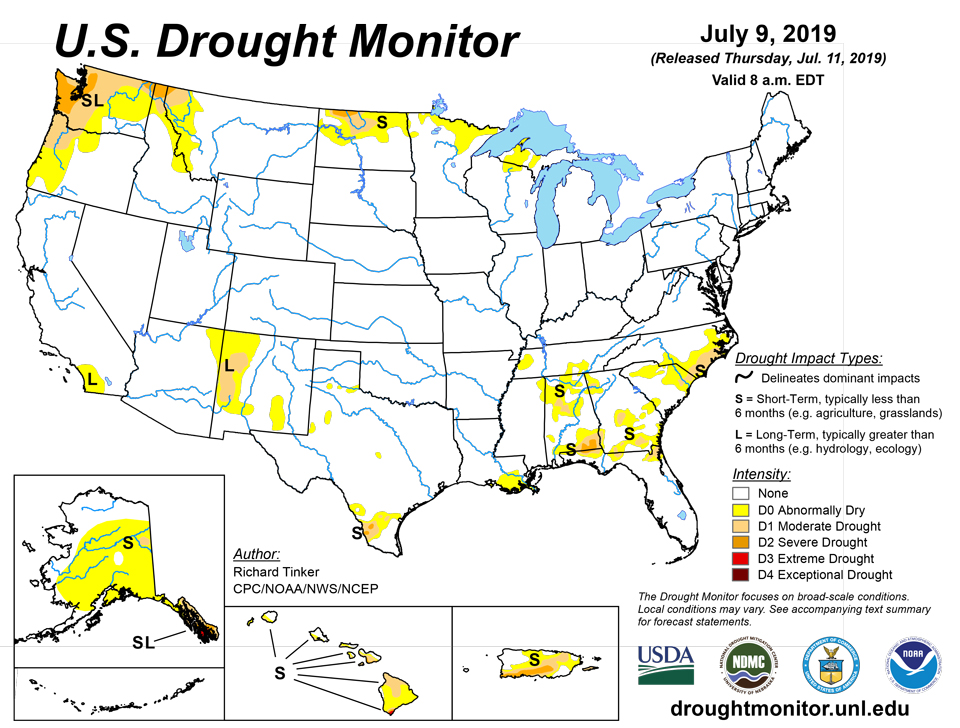
July 11, 2019 - A broken, highly-variable rainfall pattern predominated across the Country. Most areas where conditions are often dry during the summer followed this pattern, with little or no precipitation falling across the Far West and the northern Intermountain West. Other areas receiving subnormal precipitation – generally only a few tenths of an inch – included north-central North Dakota, most of northeastern Minnesota, part of the Upper Peninsula of Michigan and adjacent Wisconsin, central and southern Texas, and many areas across Louisiana and Mississippi. Farther east, rainfall was highly variable across the Southeast from Alabama through the Carolinas. Most of this area recorded at least a few tenths of an inch of rain, and roughly half received at least an inch. The heaviest amounts (2 to locally 6 inches) were concentrated along the Georgia/Florida border and the coastal Carolinas while totals on the low side were somewhat more common in south-central and northeastern Alabama, northwestern and east-central Georgia, upstate South Carolina, and a stripe across interior western North Carolina.
Northeast
Somewhat below-normal precipitation was observed across interior southern New England and a few other nearby areas for roughly the past 2 months, but an extended period of surplus precipitation preceded this, and no dryness or drought was discerned in the region.
Southeast
Not surprisingly, the highly variable rainfall pattern led to deterioration in some areas and improvement in others, amounting to regional adjustments (as opposed to broad-scale changes) in the areas identified in dryness and drought. Moderate to severe drought expanded westward in southern Alabama, and moderate drought coverage also increased in central Alabama. Meanwhile, abnormal dryness was expanded in northeast Alabama and adjacent sections of Georgia and Tennessee, and through much of the central Carolinas. D0 and D1 coverage was reduced in parts of the eastern Carolinas, southern and eastern Georgia, and northern Florida. The analysis was primarily based on rainfall deficits in the 60- to 120-day time frame.
South
Similar to the Southeast Region, a variable rainfall pattern led essentially to regional adjustments. Dryness and drought in upper South Texas improved, but conditions persisted or worsened slightly off to the south and west. Patchy abnormal dryness was again assessed farther north in Texas, with some adjustments from the previous week resulting in approximately the same amount of coverage. Abnormal dryness was contracted from part of interior western Tennessee, but expanded farther east in southeastern Tennessee and adjacent parts of Georgia and Alabama.
Midwest
Up to 2 inches of rain in much of northwestern Minnesota ended abnormal dryness there, but D0 persisted along the rest of the state’s northern tier. To the east, abnormal dryness was introduced in much of the central and western Michigan Upper Peninsula and north-central Wisconsin, where most areas received 40 to 70 percent of normal rainfall during the past month and mild deficits date back 60 and 75 days. Some short-term rainfall deficits have begun to show up farther south, particularly in several areas from Iowa through northern Indiana, but given long-term precipitation surpluses, no D0 introduction seemed warranted at this time.
High Plains
Little or no rain fell on north-central North Dakota, and moderate to heavy amounts (isolated totals of 1.5 to 2.0 inches) were generally restricted to the fringes of the abnormally dry region. Conditions remained essentially unchanged, though there was some limited southwestern expansion of moderate drought. Subnormal short-term rainfall has been observed in a few areas across central and western Kansas and eastern portions of Nebraska, but D0 introduction was not yet warranted.
West
Light precipitation dampened western Montana, and little or none was observed farther west. As a result, conditions remained unchanged or deteriorated. Abnormal dryness expanded into parts of west-central and southwestern Montana, and adjacent portions of eastern Idaho. Abnormal dryness was also extended southward in eastern Washington, and brought into more of central and southern Oregon, particularly near the southwest coast. The continued slow drying trend also prompted some southeastward D1 expansion in central and northern Oregon, plus a small northward push of extreme drought in northwestern Washington.
Alaska, Hawaii, and Puerto Rico
Exceptionally hot and dry weather across interior Alaska for roughly the past month has dried out surface moisture and created ideal conditions for the rapid development and spread of wildfires. D0 was broadly expanded to cover most of the state outside the western and northern tiers, and some moderate drought was introduced in part of the Yukon Flats, with the most extreme fire danger noted in this general area. Outside the climatologically-wetter areas of southern and southeastern Alaska, 3-month precipitation totals generally range from 2 to 4 inches, though only 0.5 to 2.0 inches fell on Yukon Flats. Over 300,000 acres were scorched across Alaska during Sunday & Monday, bringing the year-to-date total to about 1.1 million acres, a total area 40 percent larger than the state of Rhode Island. Anchorage, AK reached 90°F for the first time in recorded history in early July, and highs climbed into the upper 90’s in part of the interior. Many locations had to cancel Fourth-of-July fireworks, including many sites in and around Anchorage. Farther southeast, fire danger is low in the temperature rainforests of the southeast Alaska Panhandle, but a protracted stretch of subnormal precipitation – dating back multiple years at many locations-- has led to problems generating hydroelectric power plus growing water supply concerns in some areas, including some in and near the cities of Juneau, Wrangell, and Haines. Ketchikan, in the southern Panhandle, has accumulated a precipitation deficit of over 50 inches through the past three years.
In Puerto Rico, 0.5 to 2.0 inches fell on central parts of the Commonwealth while only a few tenths of an inch were measured near the southwestern coastline and in north-central areas. This led to an increase in severe drought coverage from central to southwestern Puerto Rico, where 60-day rainfall totaled about half of normal at best. Farther north, some northward expansion of D1 occurred in central Puerto Rico, and abnormal dryness was introduced in north-central parts of the Island.
A few inches of rain improved dry conditions on parts of the central and eastern Big Island, but increasing reports of poor pastureland and dried-out vegetation and crops led to the introduction of moderate drought across northern sections of the Big Island, with drought severities remaining intact elsewhere.
Pacific Islands
A dry trade-wind regime dominated the weather pattern during this USDM week (7/03/19-7/09/19) across northern portions of Micronesia while areas of convection associated with various features of the Inter-Tropical Convergence Zone (ITCZ) brought rain to southern parts. The ITCZ features included surface troughs, weak circulations, and converging winds. Upper-level troughs and lows were also present, with TUTT (Tropical Upper-Tropospheric Trough) cells in the north, and their associated upper-level divergence enhanced showers in some areas. Precipitation from the TUTTs in the north, especially over the Marianas, was limited due to the lack of deep layer moisture. South of the equator, a high pressure ridge generated strong trade winds across American Samoa and kept a surface trough, with its heavier convection, to the north and west of the islands during most of the week.
Satellite-based estimates of 7-day precipitation (QPE) showed a large area of 2+ inches of rain across southeastern portions of the Federated States of Micronesia (FSM), and some 2+ inch areas just west of Palau and Yap State, just east of the Republic of the Marshall Islands (RMI), and north of 10 degrees North latitude, with less than an inch of precipitation indicated between these areas. The northern rain areas were associated with upper-level troughs and lows, while the southern areas were caused by ITCZ convection. The southeastern FSM rain area extended south of the equator, southeastward toward the Samoan Islands. The QPE maps showed a sharp gradient of precipitation in the Samoan area, with 4+ inches over the western Samoan Islands to less than half an inch east and south of American Samoa.
After a wet week, dry conditions returned to Palau, receiving only 0.97 inch of rain this week. Since this is less than the weekly minimum of 2 inches, abnormally dry (D0-S) conditions continued to affect Palau this week.
Dry conditions were present this week in the Marianas, with two of the three stations analyzed receiving less than half their weekly minimum of 1 inch. The station with the least rain was Saipan, receiving only 0.23 inch of rain. Guam followed with a rainfall total of 0.28 inch. Rota had the most rainfall at 0.95 inch of rain for the week. All three stations continued to be in extreme drought (D3-S).
Six (Chuuk, Pohnpei, Kosrae, Nukuoro, Lukunoch, and Pingelap) of 11 stations analyzed had precipitation totals that equaled or surpassed the 2 inch minimum threshold to meet most water needs. The station with the most precipitation was Nukuoro at 4.46 inches of rain for the week. Chuuk, Pohnpei, Kosrae, Nukuoro, Lukunoch, and Pingelap continued to be drought free (D-Nothing) this week.
However, Yap, Fananu, Kapingamarangi, and Woleai had a dry week. The station with the least precipitation was Fananu (0.15 inch; with 1 day of missing data). Although Fananu had 8 inches of rain for the month of June, the last two weeks have been extremely dry, with less than half of an inch of rain for the two weeks combined. For this reason moderate drought (D1-S) persists once again this week. This week Yap’s precipitation total of 1.88 inches was only 0.12 inch shy of reaching its 2 inches weekly minimum, helping maintain its drought classification of abnormally dry (D0-S). Kapingamarangi and Woleai remained drought free (D-Nothing) since this week marks the first or second consecutive week of dry conditions for these locations.
No data was available for Ulithi and thus was set to missing.
All of the stations analyzed in the Marshall Islands had little rain during the week, with Wotje reporting no rain. Jaluit and Ailinglapalap were the other two stations with the least precipitation totals at 0.20 inch and 0.30 inch, respectively. Jaluit’s drought classification of moderate drought (D1-S) continued this week as dry conditions affected the area since April 2019. Since this was Ailinglapalap and Mili’s first or second consecutive dry week and the month of June surpassed the 8-inches threshold to meet most water needs, drought free (D-Nothing) conditions persisted for both locations.
Kwajalein had a total of 0.85 inch of rain for the week, which is 1.15 inches of rain less than the weekly minimum of 2 inches. As dry conditions continued, Kwajalein remained in moderate drought (D1-S). The last two weeks have been very dry in Majuro, with precipitation totals less than 1 inch of rain and reservoir levels dropping. As of July 3, reservoir levels were at 77% of the maximum capacity of 36 million gallons and below the critical 80% threshold. Abnormally dry (D0-S) drought classification was unchanged this week.
Exceptional drought (D4-SL) continued to affect Wotje and Utirik since dry conditions have persisted since the end of 2018.
Pago Pago had its third consecutive dry week, with precipitation totals less than 1 inch and the month of June had less than 8 inches required to meet most water needs. For this reason, abnormal dryness (D0-S) was introduced to Pago Pago.
Virgin Islands
During this drought week, only 0.06 inch and 0.08 inch of rain fell at Cyril E. King Airport and Henry Rohlsen Airport, respectively. These values are also the month-to-date (July 1-9) values, which is 9.4 of normal for St. Thomas and 14.3% of normal for St. Croix. Meanwhile, the year-to-date precipitation totals were 63.4% of normal for St. Thomas and 56.3% for St. Croix. The SPI values for the 6-month period ranges between -1.0 to -1.5 for both stations, which is consistent with severe drought conditions (D2-S). The 9 and 12-month SPI were also -1.0 to -1.5 for St. Thomas, while it was -1.5 to -2.0 for St. Croix, which is consistent with severe to extreme drought. Given the low precipitation totals and the SPI values drought classification for both stations were downgraded to severe drought (D2-S). After a wet June (159.1% of normal), the month of July had a dry start at St. John. For this drought week ending on July 9, 2019, St. John received only 0.24 inch of rain and only 0.25 inch for the month-to-date, according to data provided by a volunteer observer. St. John remained in abnormally dry (D0-S) conditions.
Looking Ahead
During the next 5 days (July 11 - 15, 2019) a developing tropical system in the Gulf of Mexico is forecast to spread heavy rain from the lower Mississippi Valley eastward through northern and western Georgia, where totals exceeding 1.5 inch should be widespread. Between 7 and 15 inches of rain are forecast for the southeastern half of Louisiana, and 3 to 7 inches are anticipated through most of the rest of Louisiana, the southern half of Mississippi, and the southwestern quarter of Alabama. In other areas of drought, the precipitation pattern isn’t expected to bring any dramatic relief. Moderate rains of 0.5 to 1.0 inch are expected in central and eastern Tennessee, central and eastern Georgia, parts of the Carolinas, the most orographically-favored areas in northwestern Washington, and northwestern Minnesota. Only a few tenths of an inch at best are forecast in other areas of dryness and drought across the contiguous states. Meanwhile, abnormally high temperatures [daytime highs averaging 3°F to 7°F above normal] are expected in the central High Plains and the Intermountain West, and cooler than normal conditions – at least partially in association with heavy rains from the developing tropical system – should occur from the southeastern Great Plains eastward through the lower half of the Mississippi Valley into much of Alabama and Tennessee.
The CPC 6-10 day outlook (July 16-20, 2019) favors wetter-than-normal weather in the Mississippi Valley, upper Southeast, the northern Plains, the Northwest, and the eastern two-thirds of Alaska. Odds favor less rain than normal in central and western Texas, the immediate Southeast coastline, and northern Florida. Enhanced chances for above-normal temperatures cover Alaska and most of the Nation from the Rockies eastward. Only in the Northwest do odds slightly favor below-normal temperatures.
Author(s):
Richard Tinker, NOAA/NWS/NCEP/CPC
Ahira Sanchez-Lugo, NOAA/NCEI
Dryness Categories
D0 Abnormally Dry—used for areas showing dryness but not yet in drought, or for areas recovering from drought.
Drought Intensity Categories
D1 Moderate Drought
D2 Severe Drought
D3 Extreme Drought
D4 Exceptional Drought
Drought or Dryness Types
S Short-Term, typically less than 6 months (e.g. agricultural, grasslands)
L Long-Term, typically greater than 6 months (e.g. hydrologic, ecologic)
Source: National Drought Mitigation Center

