


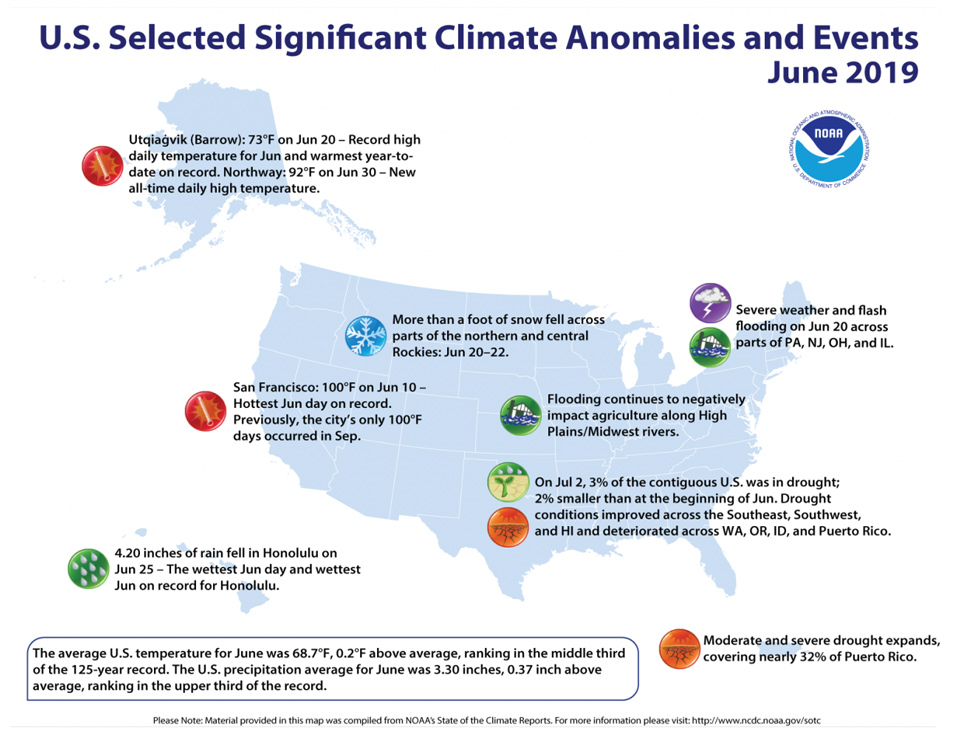
July 11, 2019 - The June contiguous U.S. temperature was 68.7°F, 0.2°F above the 20th century average, ranking in the middle third of the 125-year record. The first half of 2019 was marked by large regional differences in temperature, but when averaged, the contiguous U.S. temperature was 47.6°F, 0.1°F above the 20th century average, and ranked in the middle third of the January–June record.
The June precipitation total for the contiguous U.S. was 3.30 inches, 0.37 inch above average, and ranked in the upper third of the 125-year period of record. For the year-to-date, the precipitation total was 19.05 inches, 3.74 inches above average, and the wettest such period in the 125-year record. Average precipitation across the contiguous U.S. for July 2018–June 2019 was 37.86 inches, 7.90 inches above average, and broke a record, exceeding the previous all-time 12-month period on record set at the end of May. The previous all-time 12-month record was 37.72 inches and occurred from June 2018–May 2019. Prior to that record, the all-time 12-month record was 36.31 during May 2018–April 2019. The previous July–June record was 35.11 inches and occurred from July 1982–June 1983.
This monthly summary from NOAA National Centers for Environmental Information is part of the suite of climate services NOAA provides to government, business, academia and the public to support informed decision-making.
See all June 2019 U.S. temperature and precipitation maps.
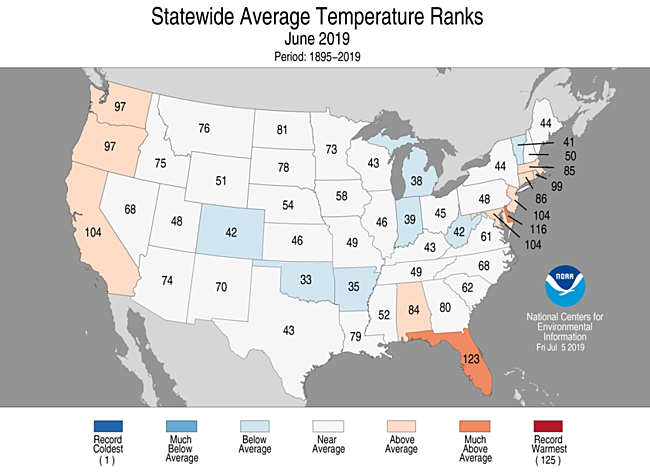
June Temperature
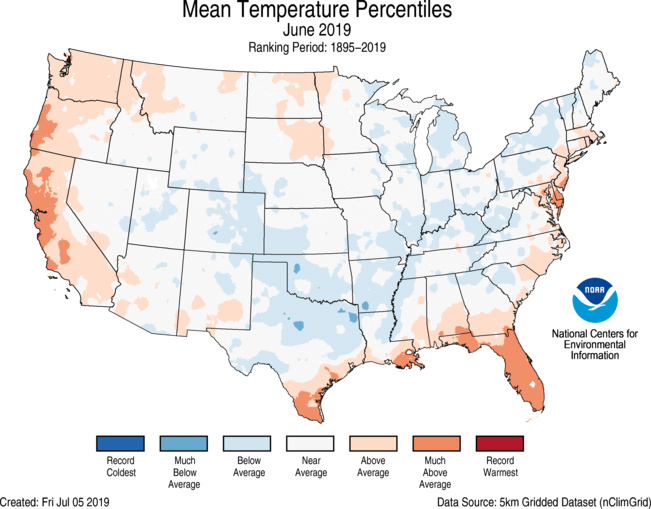
- Above- to much-above-average June temperatures were observed across 11 states, along the Pacific Coast, the Gulf Coast and the mid-Atlantic and New England coast, with Florida experiencing its third warmest June on record.
-
Below-average June temperatures were scattered across the central Rockies and central to southern Plains, the Ohio Valley to Great Lakes and into parts of the Northeast.
-
The Alaska average June temperature was 54.0°F, 4.8°F above the long-term mean and the second warmest June on record for the state. Kotzebue, Anchorage, Talkeetna and Yakutat each had their warmest June on record. On June 30, Northway reported a high temperature of 92°F, eclipsing the 50-year-old all-time record high temperature of 91°F, which occurred on June 15, 1969. The high temperature at Utqiaġvik (Barrow) on June 20 was 73°F, which is a record for the month of June.
-
Extremely warm sea surface temperatures across the Bering and Chukchi seas contributed to the lowest mean ice extent on record for June.
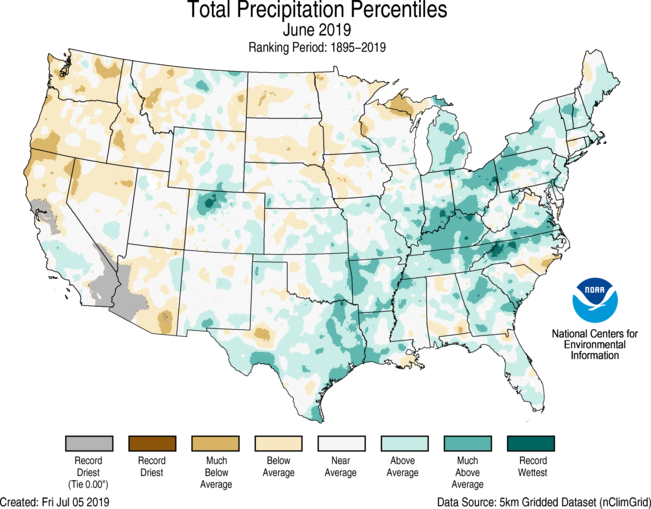
June Precipitation
-
Above- to much-above-average precipitation was observed from the Deep South, through the Mississippi and Ohio valleys and along much of the East Coast. Kentuckyranked third wettest, Ohio was fifth wettest and Tennessee ranked eighth wettest for June.
-
Flooding persisted along many of the major river systems and their tributaries across the central U.S. including the central and lower Mississippi River, the Missouri River, as well as the Illinois River.
-
As astronomical spring transitioned into summer in the Northern Hemisphere on June 21, an intense low pressure system brought more than a foot of snow to parts of the northern and central Rockies.
-
-
Below-average precipitation was observed across six states in the West as well as North and South Dakota.
-
According to the July 2 U.S. Drought Monitor report, 3.2 percent of the contiguous U.S. was in drought, down from 5.3 percent at the beginning of June. Drought conditions worsened across parts of the Pacific Northwest and Puerto Rico. Many large wildfires impacted portions of interior Alaska during June, where recent dry conditions contributed to an abundance of wildfire fuels. Drought conditions improved across much of the Southeast, parts of the Southwest, as well as across Hawaii.
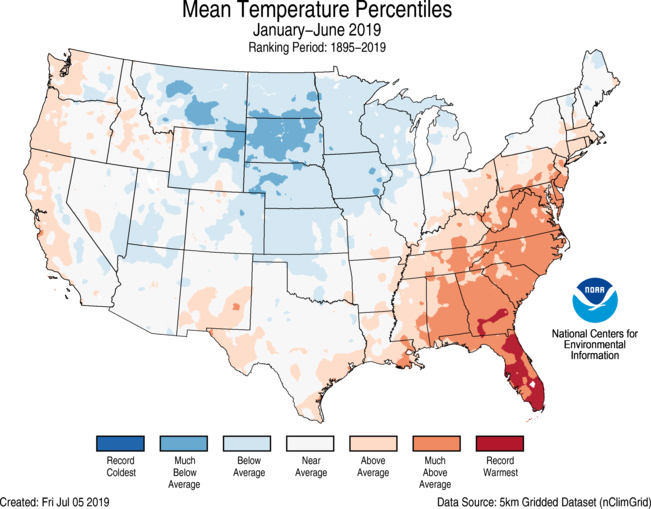
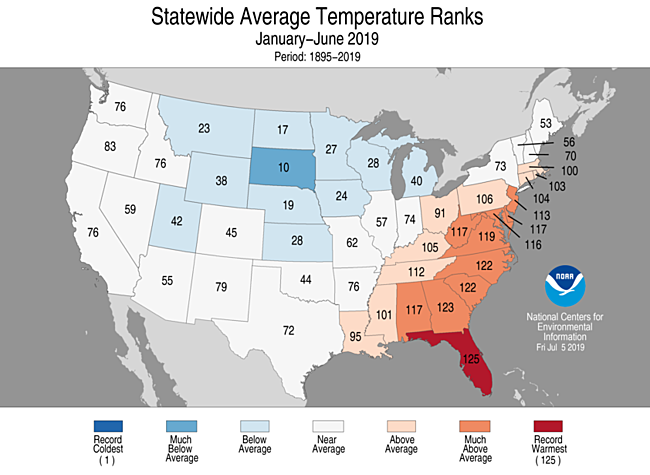
Year-to-date (January–June) Temperature
-
Above- to much-above-average January–June temperatures were observed from Louisiana to New England. Nine states across the Southeast and mid-Atlantic had a top 10 warmest year-to-date period with Florida ranking warmest on record. Below-average temperatures were observed from the Rocky Mountains to the Great Lakes with South Dakota ranking 10th coolest for January–June.
-
The Alaska statewide average temperature for the year-to-date period was 29.2°F, 7.9°F above average, and ranked as the second warmest on record. Record warm temperatures were observed across western and northern areas of the state, with above- to much-above-average temperatures across the interior and southeastern portion of Alaska. Through June, Utqiaġvik (Barrow) has experienced its warmest year-to-date on record.
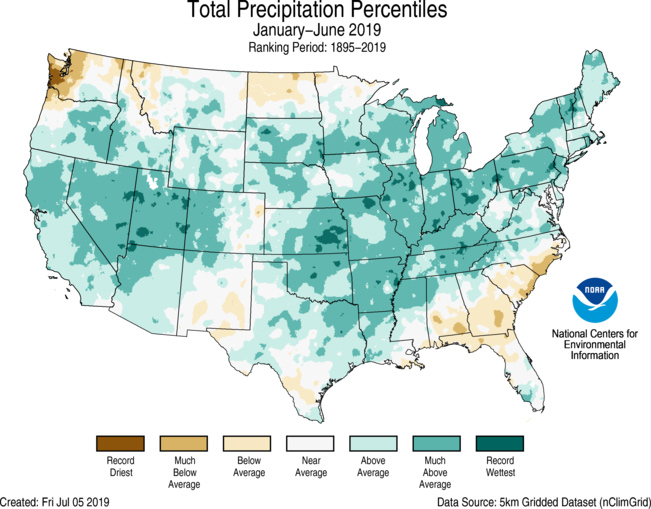
Year-to-date (January–June) Precipitation
-
Above-average precipitation blanketed much of the contiguous U.S. during this year-to-date period. Illinois ranked wettest, while 11 additional states had a top five January–June.
-
Below-average precipitation was observed in Washington state, which ranked eighth driest, South Carolina and North Dakota.
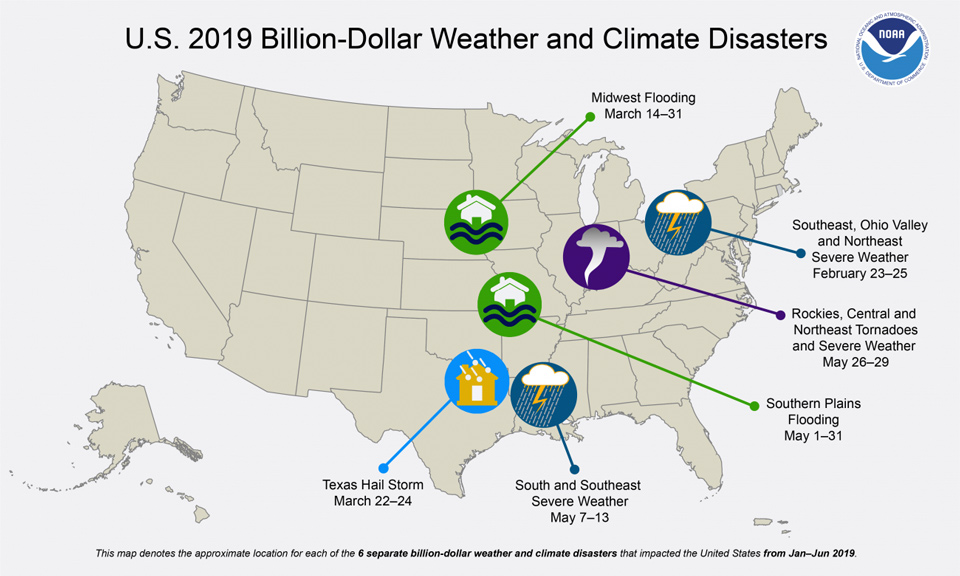
Billion-Dollar Weather and Climate Disasters
-
Through the end of June, six weather and climate disaster events have been identified to date, with losses exceeding $1 billion each across the U.S. during 2019. These events included four severe storm events and two flooding events.
-
Since these records began in 1980, the U.S. has sustained 250 separate weather and climate disasters where overall damages/costs reached or exceeded $1 billion (based on the CPI adjustment to 2019) per event. The total cost of these 250 events exceeds $1.7 trillion.
Source: NOAA
