


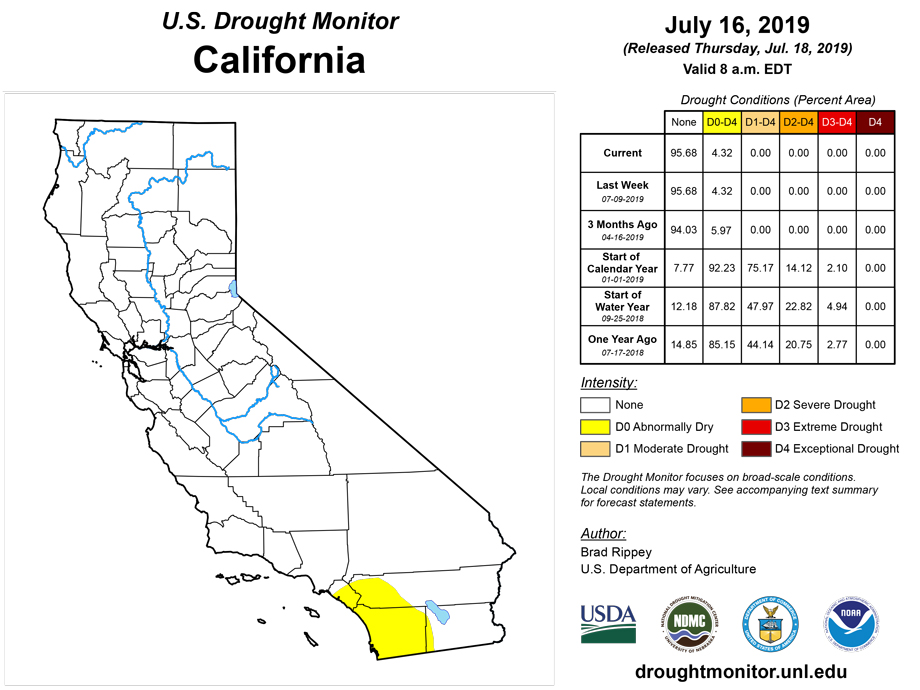
California and National Drought Summary for July 16, 2019
Summary
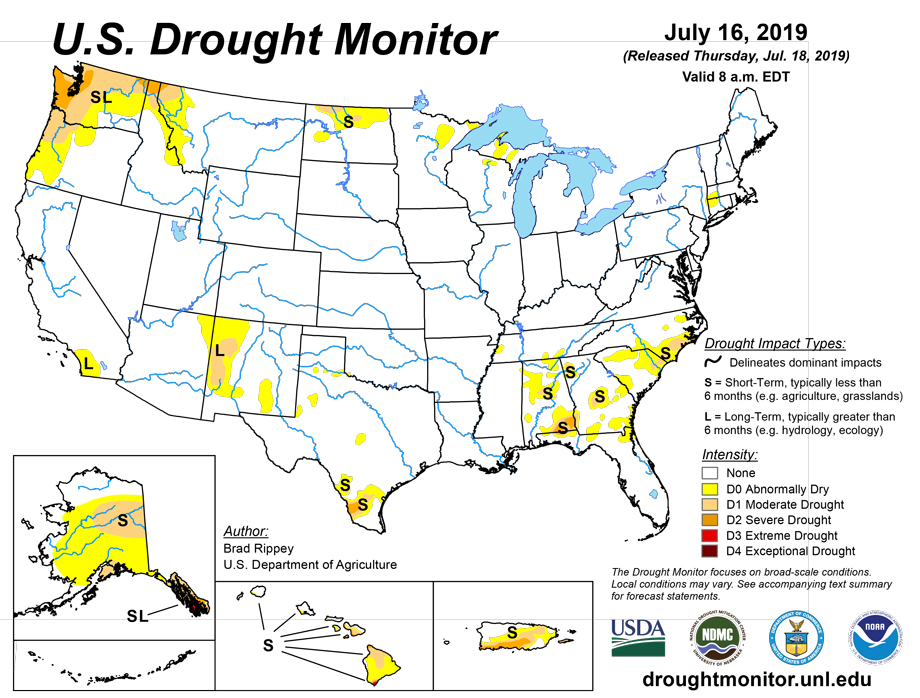
July 18, 2019 - Hurricane Barry made landfall in southern Louisiana on July 13, delivering locally heavy showers and a modest storm surge but largely sparing crops and communities in the path of the poorly organized storm. Once inland, Barry drifted northward and was quickly downgraded to a tropical storm and—by July 14—a tropical depression. Outside of Barry’s sphere of influence, locally heavy showers dotted the Southeastern and Mid-Atlantic States, sparking local flooding. Locally heavy rain also soaked portions of the North, with some of the highest totals reported across the northern half of the Plains and the upper Midwest. Many other areas of the country, including a large expanse of the West and parts of the southern Plains and the Midwest, experienced warm, dry weather. In fact, near- or above-normal temperatures dominated the country, as mid-summer heat began to build. Areas affected by Barry’s remnants, including the mid-South, remained somewhat cooler due to cloudy, showery weather. In part due to mid-July heat, short-term dryness was of great concern across the lower Midwest, where compaction, crusting, and dryness was reported in previously saturated topsoils.
Northeast
Abnormal dryness (D0) has begun to develop in parts of southern New England and environs. On July 14, the U.S. Department of Agriculture (USDA) reported topsoil moisture 95% short in Connecticut. Based on short-term precipitation deficits and low streamflow values, a spot of D0 was introduced in western sections of Connecticut and Massachusetts, as well as a tiny sliver of eastern New York. From June 1 – July 16, rainfall in Hartford, Connecticut, totaled just 2.71 inches (43% of normal). During the same 46-day period, Poughkeepsie, New York, received 3.85 inches (58% of normal).
Southeast
Pockets of dryness (D0) and moderate drought (D1) persisted from the Carolinas southward, with some areas receiving heavy showers and other remaining mostly dry. A couple of small areas of severe drought (D2) stretched from northwestern Florida to southwestern Georgia, including portions of southeastern Alabama. Showers associated with the remnants of Hurricane Barry were heaviest across western Alabama. In southeastern Alabama, however, Dothan’s rainfall from June 1 – July 16 totaled 4.83 inches (55% of normal). On July 14, USDA reported that topsoil moisture was 41% very short to short in Georgia and 30% very short to short in Alabama. On the same date in North Carolina, 30% of the corn for grain was rated in very poor to poor condition.
South
Hurricane Barry erased dryness (D0) from Louisiana and nearly so from Mississippi. There was also a reduction in D0 coverage in Tennessee. Meanwhile, hot, dry weather covered much of southern Texas, leading to expansion of dryness (D0) and moderate to severe drought (D1 to D2). July 11 featured a daily-record high in Brownsville, Texas (100°F). Elsewhere in Texas, Corpus Christi posted three consecutive daily-record highs (101, 101, and 103°F) from July 11-13. Brownsville noted another daily-record high, 102°F, on July 13.
Midwest
The Midwest remained free of drought, but several areas were being watched for possible future introduction of abnormal dryness (D0). By July 14, USDA reported that topsoil moisture ranged from 19 to 26% very short to short in Illinois, Indiana, Michigan, Missouri, and Ohio. Due to antecedent wetness resulting in soil compaction, as well as late-planted crops such as corn and soybeans exhibiting poor root development, drought-related impacts could develop very quickly during the summer of 2019. During the last 2 weeks, mostly dry weather has prevailed in a broad area centered on northern Missouri and southern Iowa; this area and other dry Midwestern pockets will be closely monitored. Meanwhile, upper reaches of the Midwest received heavy showers and thunderstorms, which resulted in a reduction in the coverage of abnormal dryness (D0) across northern sections of Michigan, Minnesota, and Wisconsin.
High Plains
Heavy showers and thunderstorms sweeping across North Dakota eradicated severe drought (D2) and reduced the coverage of moderate drought (D1) and abnormal dryness (D0). In the Dakotas, daily-record amounts for July 9 totaled 3.12 inches in Williston, North Dakota, and 1.29 inches in Watertown, South Dakota. The remainder of the High Plains remained free of dryness and drought.
West
Minimal changes were made, although generally cool weather in the Northwest contrasted with hot conditions in the Southwest. A few monsoon-related showers developed in the Four Corners States—the official monsoon start date in Tucson, Arizona, based on average dewpoint temperature, was July 13, the latest onset in that location since 2005. Meanwhile in eastern Washington, moderate drought (D1) was expanded due to an evaluation of water year-to-date precipitation totals; low reservoir levels; and soil moisture shortages. On July 14, USDA rated topsoil moisture 62% very short to short in Oregon and 39% very short to short in Washington.
Alaska, Hawaii, and Puerto Rico
By mid-July, more than 50 active Alaskan wildfires had collectively scorched well over 1.2 million acres of vegetation. In addition, record-setting heat continued to bake parts of Alaska. From July 8-10, McGrath reported a trio of daily-record highs (89, 84, and 85°F). On July 9, daily-record highs were also set in locations such as Fairbanks (87°F) and Nome (83°F). For Nome, it was the highest reading since July 7, 2014, when the temperature had reached 84°F. Given the heat and short-term dryness, abnormal dryness (D0) was broadly expanded across the Alaskan interior. In addition, moderate drought (D1) greatly increased in coverage across east-central Alaska and was introduced on the Kenai Peninsula. Meanwhile, moderate to extreme drought (D1 to D3) persisted or expanded slightly across southeastern Alaska, where a variety of impacts ranging from reduced hydroelectric power generation to fish mortality have been reported. Farther south, parts of Hawaii continued to benefit from earlier rainfall, resulting in the elimination of moderate drought (D1) from Kauai, Oahu, and Molokai. However, some severe drought (D2) was added across the northern part of the Big Island. In addition, all of Hawaii continues to deal with elevated temperatures due to unusually warm water surrounding the islands. On Maui, Kahului’s high temperatures reached or exceeded 90°F each day from June 21 to July 16. Elsewhere, there were only slight changes made to the drought depiction in Puerto Rico—the removal of abnormal dryness (D0) along part of the northern coast and a slight increase in moderate to severe drought (D1 to D2) along the south-central coast. In San Juan, Puerto Rico, significant rainfall deficits exist at many time scales. For example, San Juan received 4.46 inches (63% of normal) from June 1 – July 16 and through the 16th had a year-to-date total of 14.78 inches (57% of normal).
Pacific Islands
The weather pattern during this USDM week (7/10/19-7/16/19) consisted of several features which generated rain across a large part of Micronesia. A monsoon trough developed this week across Palau, the Marianas, and the Federated States of Micronesia (FSM), eventually extending to the Marshall Islands (RMI) by the end of the week. Weak circulations were embedded within the trough. Divergent flow aloft, associated with upper-level troughs, aided convection generated by the monsoon trough and its circulations. Rain over Kosrae State and the RMI was associated with interactions between tropical disturbances/weak circulations, a surface trough, and an upper-level trough. South of the equator, high pressure with dry and stable air dominated American Samoa for most of the week. A surface trough, which stayed north of the islands for most of the week, shifted southward and brought rain later in the week.
Satellite-based estimates of 7-day precipitation (QPE) showed a large area of 4+ inches of rain across western to southeastern Micronesia associated with the monsoon trough, with areas of 2+ inches stretching into the southern Marianas and northern RMI. Less than half an inch was indicated for the southern RMI and far northern Marianas. The QPE indicated most of the rain occurred north and east of the Samoan Islands, but some areas of 1 to 3 inches were indicated brushing the islands of American Samoa.
In the Republic of Palau, the monsoon trough dropped 7.76 inches of rain at the Palau International Airport this week. This brought the July total to 9.60 inches, which is above the 8-inch monthly minimum needed for most water needs. July marks the second wet (more than 8 inches) month, so D0-S was changed to D-Nothing.
The monsoon trough also spread rain into the southern Marianas. Based on data received so far, rainfall totals were well above the 1-inch weekly minimum at Rota (where 4.65 inches was recorded), Agat (3.87), Dededo (2.79), and Guam (1.97). These amounts bring the July monthly totals to 6.62 inches at Rota and 2.29 inches at Guam, which are above the monthly minimums for halfway through the month. Saipan recorded 0.75 inch for the week (with one day missing). While this is below the weekly minimum, rain has been falling on every day and vegetation has greened up significantly on Saipan. As a result of these conditions, the USDM status at Guam and Rota was improved to D2-S and at Saipan to D2-SL.
In the FSM, based on data received so far, weekly rainfall totals for the analyzed stations ranged from 1.99 inches at Kosrae to 6.22 inches at Kapingamarangi. With 5.71 inches for the week, 8.02 inches for July, and 13.14 inches for June, the status at Yap was improved from D0-S to D-Nothing. Fananu’s status was improved from D1-S to D0-S based on 4.22 inches for the week, 4.43 inches for July, and 8.00 inches in June. No data was received from Ulithi, so an analysis could not be made there. All other stations continued at D-Nothing.
In the RMI, Wotje received 3.26 inches of rain for the week and was the only wet station (more than the 2-inch weekly minimum). Weekly rainfall totals for the other stations ranged from 0.14 inch at Mili to 1.73 inches at Majuro. The July 1-16 total at Wotje is 3.26 inches. If no more rain fell at Wotje this month, July 2019 would rank as the 7th driest July out of 36 years, which is at the 19th percentile; January-July would rank 5th driest out of 33 years, which is at the 14th percentile. Considering these ranking percentiles and the rain that fell this week, the USDM status at Wotje was improved from D4-SL to D3-SL. This week marked the third consecutive dry (less than the 2-inch minimum) week at Mili (with 0.14 inch of rain this week) and Ailinglapalap (0.80 inch), and the monthly total for July so far was 0.84 inch at Mili and 1.10 inches at Ailinglapalap, so the status at these two stations was worsened from D-Nothing to D0-S. Kwajalein has received rain on several days this week and several days this month, which has been enough to green up the vegetation. But the week was dry (1.30 inches) and the month so far has been dry (2.27 inches for July 1-16), and June was dry (4.76 inches). June 2019 ranked as the 8th driest June out of 68 years, which translates to the 12th percentile which is well within the D1 range, so D1-S continued at Kwajalein. This week (1.73 inches) and month (2.71 inches) have been dry at Majuro. The reservoirs storage at Majuro has steadily declined during July, standing at 25.6 million gallons on July 16, which is 71% of the maximum, well below the 80% threshold for concern, so D0-S continued. D4-SL continued at Utirik, which recorded 0.88 inch for the week (with one day missing) and only 1.84 inches for July so far, and D1-S continued at Jaluit, which reported 0.94 inch for the week and 1.14 inches for July so far.
It was another dry week in American Samoa. The airport station at Pago Pago reported 1.65 inches of rain, and the automated stations at Siufaga Ridge and Toa Ridge recorded 1.72 inches and 0.72 inch, respectively. These are below the 2-inch weekly minimum. Monthly totals for June and so far in July are also below the monthly minimum, so D0-S continued for Tutuila.
Virgin Islands
The weather pattern during this USDM week (7/10/19-7/16/19) consisted of tropical waves alternating with drier, stable, dust-laden, Saharan air masses moving across the region in the easterly flow created by the Bermuda High. A TUTT (Tropical Upper-Tropospheric Trough) pattern aloft moved across the Caribbean waters early in the week. Radar estimates of precipitation for the week showed a couple east-west streamers of rainfall across the U.S. Virgin Islands (USVI), one clipping a corner of St. Thomas and another passing over St. Croix. Showers were generally light, although a record daily rainfall occurred over St. Croix.
Three-fourths of an inch (0.73 inch) of rain was recorded at the Henry Rohlsen Airport on St. Croix this week, and 0.48 inch of it fell on Thursday which was a daily record for July 11, besting the old record of only 0.23 inch set in 1960. This brings the monthly total for July 2019 to 0.95 inch, which is still 0.47 inch below normal, or 66.9% of normal, and the year-to-date total is still well below normal (58.8%, or 6.33 inches below normal). The Standardized Precipitation Index (SPI) for Christiansted Hamilton Field (Henry Rohlsen Airport) was at D1 levels for the last month and last 6 months, D2 levels for the last 9 months, and D3 levels at the 12-month time scale. According to government reports, the drought has reduced water table levels and arable farming and grazing lands, making it exceedingly difficult for territory livestock farmers to feed and water their animals. So the USDM status continued at D2-S on St. Croix.
A fourth of an inch (0.23 inch) of rain fell at the Cyril E. King Airport on St. Thomas this week. This brings the monthly total to 0.32 inch, which is 1.13 inches below normal or 22.1% of normal. The year-to-date total is 5.75 inches below normal, or 61.7% of normal. The SPI for the Charlotte Amalie Cyril E. King Airport was at D1 levels for the 1-, 6-, and 9-month time scales, D2 levels for the last 12 months, and D3 levels for the last 3 months. The CoCoRaHS observer near Anna’s Retreat on St. Thomas reported only 0.23 inch for July 1-14. D2-S continued for St. Thomas.
A tenth of an inch (0.09 inch) was reported by a volunteer observer on St. John. This brings the monthly total to 0.35 inch through July 16. July data were not yet available for the East End station on St. John, but the SPI for the previous 3 months and 12-month time scales was at D0 levels, the SPI was at D1 levels for the 6-month time scale, and at D2 levels for the 9-month time scale. D0-L continued on St. John for this week, but D1-SL may be considered in the weeks ahead if the dry conditions continue.
Looking Ahead
Heat and high humidity levels will dominate the central and eastern U.S. through week’s end, except on the northern Plains. By early next week, however, markedly cooler, drier air will arrive across the Plains and Midwest. Meanwhile, the post-tropical remnants of Hurricane Barry will spark showers in the East through Thursday, while scattered showers and thunderstorms will affect parts of the nation’s northern tier. Five-day rainfall totals could reach 2 to 4 inches in the upper Midwest and locally 1 to 3 inches east of the Mississippi River. In contrast, dry weather will prevail in the south-central U.S. and from California to the Intermountain West.
The NWS 6- to 10-day outlook for July 23 – 27 calls for the likelihood of below-normal temperatures from the central and southern Plains to the Atlantic Seaboard, excluding southern Florida, while hotter-than-normal conditions will dominate the West and the northern High Plains. Meanwhile, below-normal rainfall in the Midwest and along the northern Pacific Coast should contrast with wetter-than-normal weather along the Atlantic Coast, in the Deep South, and across the Intermountain West.
Author(s):
Brad Rippey, U.S. Department of Agriculture
Richard Heim, NOAA/NCEI
Dryness Categories
D0 Abnormally Dry—used for areas showing dryness but not yet in drought, or for areas recovering from drought.
Drought Intensity Categories
D1 Moderate Drought
D2 Severe Drought
D3 Extreme Drought
D4 Exceptional Drought
Drought or Dryness Types
S Short-Term, typically less than 6 months (e.g. agricultural, grasslands)
L Long-Term, typically greater than 6 months (e.g. hydrologic, ecologic)
Source: National Drought Mitigation Center

