


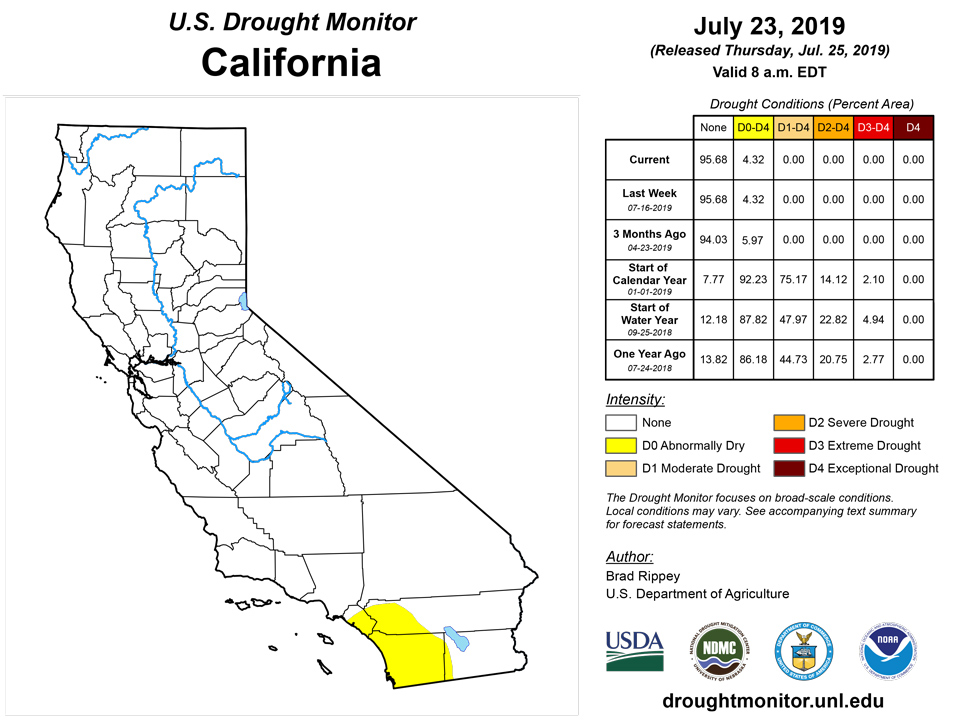
California and National Drought Summary for July 23, 2019
Summary
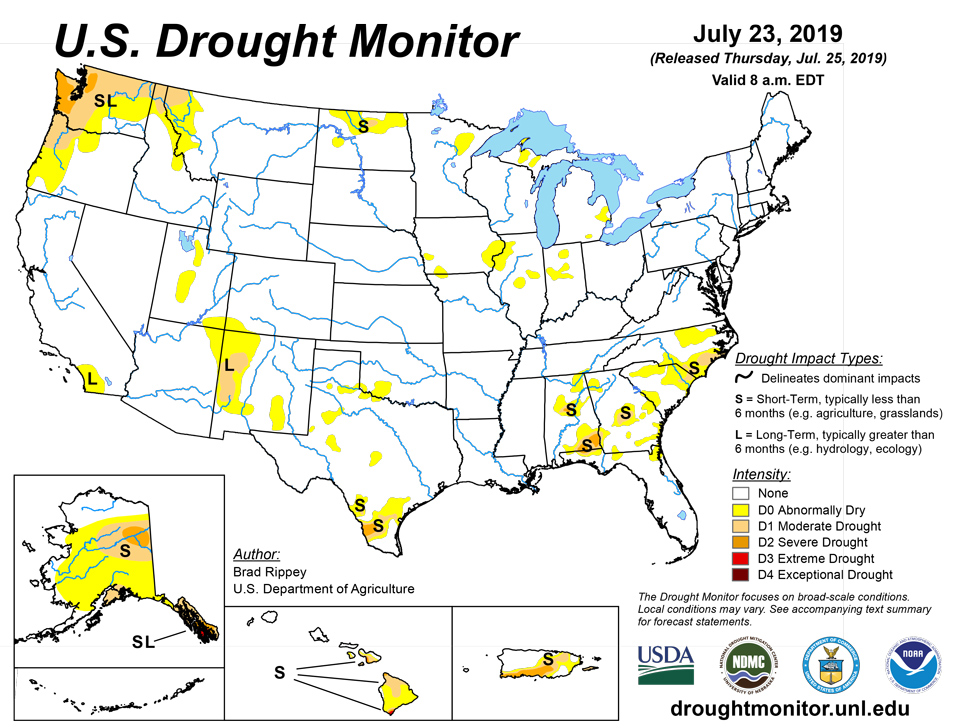
July 25, 2019 - The remnants of Hurricane Barry drifted northward into the Ohio Valley, delivering widespread rainfall that mostly benefited summer crops but also sparked some flash flooding. Some of the heaviest rain, locally 4 to 8 inches or more, fell in portions of the Mississippi Delta States. Meanwhile, several cold fronts crossed the North, generating showers and locally severe thunderstorms from the northern Plains into the Northeast. Some of the highest totals, as much as 2 to 4 inches or more, fell from South Dakota into Michigan, locally accompanied by high winds, large hail, and isolated tornadoes. Meanwhile, much of the central and eastern U.S. experienced a brief period of heat and high humidity levels, followed by cooler weather and scattered to widespread showers and thunderstorms. Late-planted and poorly rooted Midwestern corn and soybeans were particularly susceptible to heat stress in areas that have recently dried out, following excessive spring wetness and acute planting delays. Temperatures soared to 90°F or higher east of the Rockies, except in parts of the Appalachians and across the nation’s northern tier. Readings topped 100°F throughout the central and southern High Plains. Elsewhere, dry weather covered large sections of the West and the southern half of the Plains. However, cold fronts delivered some light precipitation to the northernmost Rockies and Pacific Northwest, while showers associated with the monsoon circulation dotted the central and southern Rockies and the Desert Southwest.
Northeast
Heavy rain late in the drought-monitoring period eliminated the abnormal dryness (D0) that had recently developed over southwestern New England and a neighboring sliver of eastern New York. July 17-23 rainfall in Hartford, Connecticut, totaled exactly 2 inches, helping to boost its total since June 1 from 2.71 to 4.71 inches—an improvement from 43 to 64% of normal. During the 7-day period ending July 23, Poughkeepsie, New York, received rainfall totaling 2.26 inches.
Southeast
Spotty showers were heaviest across parts of Florida and from the southern Appalachians westward. As a result, there was a general slight increase in the coverage of dryness (D0) and moderate drought (D1) in the southern Atlantic States from Georgia northward. A couple of pockets of severe drought (D2) persisted in an area centered across southeastern Alabama, where Dothan’s June 1 – July 23 rainfall totaled just 5.49 inches (55% of normal). According to the U.S. Department of Agriculture, topsoil moisture on July 21 was rated at least 40% very short to short in Georgia, Virginia, and the Carolina. On the same date in North Carolina, 30% of the corn for grain was rated in very poor to poor condition.
South
The remnants of Hurricane Barry continued to produce heavy rain early in the drought-monitoring period in Arkansas and environs. On July 16, daily-record rainfall amounts reached 4.09 inches in Pine Bluff, Arkansas, and 2.28 inches in Memphis, Tennessee. From July 14-16, Pine Bluff received 7.02 inches. Other July 14-16 totals included 5.35 inches in Greenwood, Mississippi, and 5.12 inches in Memphis. Storm totals topped 10 inches in parts of Arkansas and Louisiana. A state 24-hour rainfall record was established in Arkansas, where 16.17 inches fell at Dierks, in Howard County, on July 15-16. Arkansas’ previous record of 14.06 inches had been established on December 3, 1982, at a weather station near Big Fork, in Polk County. An Arkansas state record was also broken for rainfall received during a tropical event; the 16.59-inch sum in Dierks eclipsed the previous standard of 13.91 inches set in Portland, Ashley County, during Tropical Storm Allison from June 28 – July 2, 1989. Outside of Barry’s sphere of influence, slight expansion of abnormal dryness (D0) was noted in parts of Oklahoma and Texas, where very hot weather prevailed until recently. Dalhart, Texas, tallied a trio of daily-record highs (105, 108, and 107°F) from July 18-20. Elsewhere, moderate drought (D1) further expanded in portions of southern Texas. During the week ending July 21, topsoil moisture rated very short to short as reported by USDA increased from 21 to 43% in Oklahoma and from 42 to 55% in Texas.
Midwest
A sharp but short-lived heat wave affected the Midwest for several days but wound down before the drought-monitoring period ended. On July 19, daily-record highs rose to 97°F in La Crosse, Wisconsin, and 95°F in Alpena, Michigan. In addition, short-term dryness (D0) has begun to adversely affect some Midwestern corn and soybeans, with impacts exacerbated by late planting, poorly developed root systems, and soil compaction. From July 1-23, rainfall totaled less than one-half inch in Illinois locations such as Lincoln (0.46 inch, or 12% of normal) and Springfield (0.23 inch, or 8%). Iowa City, Iowa, reported a July 1-23 total of 0.85 inch (21% of normal). On July 21, topsoil moisture—as reported by USDA—was 20 to 29% very short to short in Illinois, Indiana, and Michigan, and 16% very short to short in Iowa and Missouri.
High Plains
Rainfall across the High Plains has been heavy at times in recent weeks, and most rangeland and pastures are in good shape. According to USDA on July 21, rangeland and pastures were rated at least 70% good to excellent in each of the region’s six states (CO, KS, NE, ND, SD, and WY). Although a few areas of dryness (D0) and moderate drought (D1) linger in North Dakota, drought effects have generally diminished. On July 21, more than three-quarters (76%) of the U.S. spring wheat crop was rated in good to excellent condition.
West
A sluggish start to the Southwestern monsoon season, particularly in Arizona, Utah, and southwestern Colorado, led to some modest expansion of abnormal dryness (D0). Locations in or near the new D0 areas that received only a trace of rain during the first 23 days of July included Cortez, Colorado (0.69 inch below normal), and Cedar City, Utah (0.54 inch below normal). Farther north, some reassessment of conditions near the Canadian border led to the removal of severe drought (D2) from northeastern Washington into northwestern Montana, based on recent precipitation trends, streamflow, and other drought indicators. Similarly, a small lobe of D0 was removed from southwestern Montana. Closer to the Pacific Coast, enough precipitation has recently fallen in western Washington to result in a slight reduction in the coverage of D2. Still, some significant topsoil moisture shortages exist in parts of the Pacific Northwest. On July 21, USDA rated topsoil moisture 64% very short to short in Oregon and 57% in very short to short in Washington.
Alaska, Hawaii, and Puerto Rico
By July 23, more than six dozen active Alaskan wildfires had cumulatively burned well over 1.8 million acres of vegetation. The largest wildfire, the 473,451-acre Chalkyitsik Complex, was burning in the Yukon Flats about 15 miles east of the community of Chalkyitsik. East-central Alaska’s driest locations, some of which have received less than an inch of rain since late May, experienced a change from moderate to severe drought (from D1 to D2). During the drought-monitoring period, an explosive thunderstorm outbreak on July 18-19 resulted in more than 24,000 lightning strikes in a 24-hour period across Alaska and the neighboring Yukon Territory of Canada. Meanwhile, moderate to extreme drought (D1 to D3) persisted across southeastern Alaska, where impacts ranging from reduced hydroelectric power generation and municipal water restrictions to low streamflow for fish migration have been reported. Farther south, roughly the western half of Hawaii continued to benefit from earlier rainfall, resulting in the elimination of abnormal dryness (D0) from Kauai, Oahu, and Molokai. However, some extreme drought (D3) was added on Maui, across the lower leeward slopes of Haleakala, due to significant agricultural drought impacts. The drought depiction for the Big Island remained unchanged. Elsewhere, heavy rain across west-central Puerto Rico resulted in some reduction in the coverage of moderate to severe drought (D1 to D2). The remainder of Puerto Rico experienced little or no change in the depiction. In San Juan, Puerto Rico, similar rainfall deficits existed at different time scales. For example, San Juan received 5.46 inches (67% of normal) from June 1 – July 23 and through that date had a year-to-date total of 15.78 inches (59% of normal).
Pacific Islands
The Republic of Palau had a dry conditions with only 0.55 inches of rain for this drought week. This is 1.45 inches less than their weekly minimum of 2 inches to meet most water needs. However, last week was extremely wet for Palau, receiving nearly 8 inches of rain. For this reason, drought free (D-Nothing) conditions persist in the Republic of Palau.
Two of the three stations analyzed in the Marianas Islands had precipitation totals above their minimum of 1 inch. Saipan had the highest precipitation total at 2.31 inches followed by Rota (1.24 inches). Guam had only 0.62 inch of rain for the week, which is a little over half its weekly minimum precipitation total. Rota and Saipan’s monthly precipitation total for July surpassed their monthly minimum of 4 inches, with Rota having almost twice its monthly minimum. Also, according to input from locals, vegetation is recovering across all three locations. For these reasons drought conditions were once again improved from severe drought (D2-S for Rota and Guam; D2-SL for Saipan) to moderate drought (D1-S for Rota and Guam; D1-SL for Saipan) for all three locations.
Weekly precipitation totals for most stations analyzed in the FSM were less than their weekly minimum of 2 inches. The stations with the least rainfall were Lukunoch (0.29 inch; 2 days of missing data), followed by Woleai (0.66 inch) and Chuuk (0.70 inch; 1 day of missing data). For Chuuk Lagoon, this week marked the first dry week after six consecutive weeks of wet conditions. Lukunoch, Chuuk Lagoon, and Woleai’s drought classification remained as drought free (D-Nothing) this week. Kosrae’s rainfall total for the week was 1.88 inches, slightly less than the 2-inches mark. However, drought free (D-Nothing) status was also unchanged for Kosrae. Even though Yap (1.12 inches), Pingelap (1.60 inches), Kapingamarangi (1.20 inches) and Nukuoro (0.93 inch) had less than their weekly minimum of 2-inches, these stations’ monthly rainfall totals are close to or surpassed the 8 inches threshold and thus drought free classification was unchanged. Fananu was remained in abnormally dry conditions (D0-S) as dry conditions continued this week. Pohnpei was the only station in the FSM to have a wet week, with 2.01 inches of rain for this drought week. Pohnpe has been very wet the last three weeks and its monthly precipitation total reached the 8-inches threshold. Drought free conditions remain in Pohnpei. No data was received from Ulithi, so an analysis could not be made and was set to missing.
Most stations across the Marshall Islands had less than 1 inch of rainfall during this week. Mili was the only station within the Marshall Islands that had a wet week with 3.76 inches of rain, which is nearly double their weekly minimum of 2 inches. With a very wet week, Mili’s drought status was improved from abnormally dry (D0-S) to drought free (D-Nothing). Kwajalein and Jaluit had the least rainfall totals at 0.23 inch and 0.33 inch, respectively. Both of these stations remain in moderate drought (D1-S). This week marked another dry week for Ailinglapalap and Majuro, receiving only 0.50 inch and 0.57 inch, respectively. This week Ailinglapalap remained in abnormally dry (D0-S) conditions, however moderate drought (D1-S) conditions will be considered if dry conditions persist next week. This was Majuro’s fourth consecutive week with precipitation totals below the 2 inches mark, with three of those four weeks receiving less than 1 inch. Reservoir levels in Majuro have been dropping. As of July 23, the levels were 66% of the maximum capacity of 36 million gallons and below the critical 80% threshold. For this reason, Majuro’s drought classification was changed from abnormally dry (D0-S) to moderate drought (D1-S). Utirik (0.84 inch) and Wotje (0.56 inch) also remained in exceptional (D4-SL) and extreme drought (D3-SL) as dry conditions continued this week.
Tutuila had a very wet week with 8.36 inches of rain, which is four times its weekly minimum of 2 inches to meet most water needs and surpassed the monthly minimum of 8 inches. Because of the extremely wet conditions this week, Tutuila drought status was changed from abnormally dry (D0-S) to drought free (D-Nothing) status.
Virgin Islands
Rainfall totals at Cyril E King Airport during this drought week was 1.13 inch. So far the month-to-date value for this locations in 1.45 inches, which is 0.55 inches below the 2 inches normal value or 72.5% of normal rainfall. The precipitation total for King Airport for January-July as of July 23, 2019 was 10.39 inches or 66.8% of normal. The SPI for the last six months was -1.23 and -1.44 for the 9-month period, which is consistent with moderate to severe drought conditions. Severe drought (D2-SL) remains unchanged this week for St. Thomas.
St. Croix was also dry this week. Total precipitation for the drought week ending July 23 at Henry Rohlsen Airport was only 0.39 inch. The month of July had a total of 1.34 inches of rain (as of July 23), which is 0.72 inches less than the monthly average of 2.06 or 65% of normal. For the year-to-date, the Rohlsen Airport had 9.42 inches of rain, which is 6.58 inches less than normal or 59% of normal precipitation. The SPI for the last six months at Rohlsen Airport was -0.77 and -1.52 for the 9-month period, which is also consistent with moderate to severe drought conditions. The 12-month SPI was -1.62, consistent with extreme drought conditions. This week severe drought (D2-SL) remains unchanged for St. Croix.
According to data provided by a volunteer observer, St. John’s weekly precipitation total for this drought week was 0.62 inches. The month-to-date precipitation (as of July 23) total was 0.97 inch, which is 2.44 inches less than normal or 28.4% of normal rainfall. Meanwhile, the year-to-date rainfall totals as of July 23 was 12.85 inches, which is 7.66 inches below normal or 62.6% of normal. Since this marked the third consecutive week with dry conditions, drought was downgraded from abnormally dry (D0-L) conditions to moderate drought (D1-S).
Looking Ahead
Showers and thunderstorms will linger for the next few days in the Deep South, primarily across Florida and along the Gulf Coast. Meanwhile, a pair of slow-moving cold fronts crossing the northern U.S. will entrain moisture from the monsoon circulation, leading to spotty showers from the Southwest to the northern Plains and upper Midwest. Dry weather and near- or below-normal temperatures will prevail between the two primary areas of showery weather. Elsewhere, hot weather will dominate the Intermountain West.
The NWS 6- to 10-day outlook for July 30 – August 3 calls for near- or above-normal temperatures nationwide, except for cooler-than-normal conditions in northern Washington and the lower Mississippi Valley. Meanwhile, near- or below-normal rainfall across much of the Plains and Northwest should contrast with wetter-than-normal weather in the Southwest and a broad area covering the mid-South, Ohio and Tennessee Valleys, the lower Great Lakes region, and the Northeast.
Author(s):
Brad Rippey, U.S. Department of Agriculture
Ahira Sanchez-Lugo, NOAA/NCEI
Dryness Categories
D0 Abnormally Dry—used for areas showing dryness but not yet in drought, or for areas recovering from drought.
Drought Intensity Categories
D1 Moderate Drought
D2 Severe Drought
D3 Extreme Drought
D4 Exceptional Drought
Drought or Dryness Types
S Short-Term, typically less than 6 months (e.g. agricultural, grasslands)
L Long-Term, typically greater than 6 months (e.g. hydrologic, ecologic)
Source: National Drought Mitigation Center

