


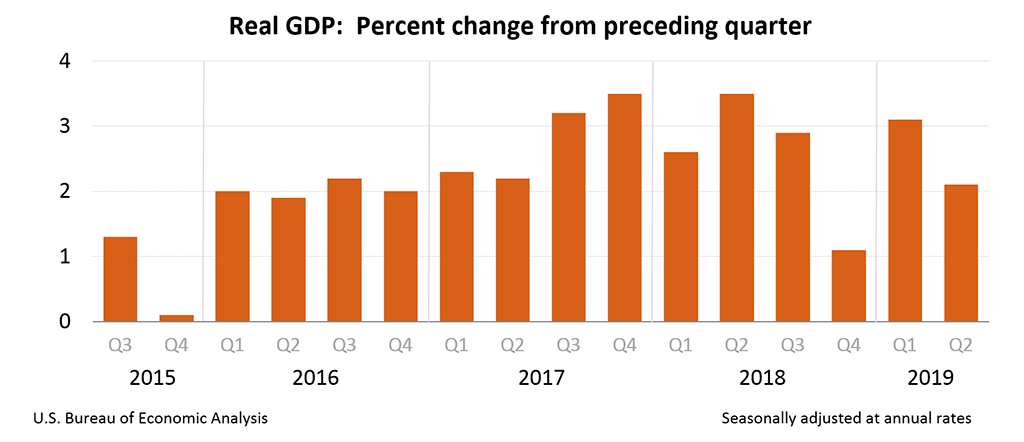
July 28, 2019 - On Friday, the Department of Commerce’s Bureau of Economic Analysis (BEA) released the second quarter gross domestic product (GDP) numbers, finding that the real gross domestic product increased at an annual rate of 2.1% percent in the second quarter.
“The Trump economy is growing strong and, on the heels of 3.1 percent growth in the first quarter, is poised to continue expanding,” said Secretary of Commerce Wilbur Ross. “President Trump’s ambitious agenda of deregulation, tax reform, and job creation is making the U.S. the premier place for business, and is restoring our position as an economic leader on the world stage.”
The Trump Administration’s policies have delivered repeated wins for American workers. In July, the current economic expansion became the largest in U.S. history – a testament to the strength of President Trump’s business-friendly policies.
In the second quarter, consumer spending, the engine of the U.S. economy, surged at a 4.3% annual rate, as spending on goods rose at the fastest rate since the first quarter of 2006.
The economy beat expectations again in June by adding 224,000 jobs, the last month of the second quarter, and averaging 129,000 jobs added per month over the past year. Since the President’s election, the country has added nearly 5 million jobs, while the manufacturing industry alone has added more than 500,000. The tight labor market benefitted American workers in another way in June as nominal average hourly earnings rose by 3.1 percent over the previous 12 months, meeting or surpassing 3.0 percent growth for the 11th month in a row. Before 2018, nominal average hourly wage gains had not reached 3.0 percent since 2009.
Source: Commerce.gov
BEA Release: Gross Domestic Product, Second Quarter 2019 (Advance Estimate) and Annual Update
Real gross domestic product (GDP) increased at an annual rate of 2.1 percent in the second quarter of 2019 (table 1), according to the "advance" estimate released by the Bureau of Economic Analysis. In the first quarter, real GDP increased 3.1 percent.
The Bureau's second-quarter advance estimate released today is based on source data that are incomplete or subject to further revision by the source agency (see "Source Data for the Advance Estimate" on page 2). The "second" estimate for the second quarter, based on more complete data, will be released on August 29, 2019.
The deceleration in real GDP in the second quarter reflected downturns in inventory investment, exports, and nonresidential fixed investment. These downturns were partly offset by accelerations in PCE and federal government spending.The increase in real GDP in the second quarter reflected positive contributions from personal consumption expenditures (PCE), federal government spending, and state and local government spending that were partly offset by negative contributions from private inventory investment, exports, nonresidential fixed investment and residential fixed investment. Imports, which are a subtraction in the calculation of GDP, increased (table 2).
Current-dollar GDP increased 4.6 percent, or $239.1 billion, in the second quarter to a level of $21.34 trillion. In the first quarter, current-dollar GDP increased 3.9 percent, or $201.0 billion (table 1 and table 3).
The price index for gross domestic purchases increased 2.2 percent in the second quarter, compared with an increase of 0.8 percent in the first quarter (table 4). The PCE price index increased 2.3 percent, compared with an increase of 0.4 percent. Excluding food and energy prices, the PCE price index increased 1.8 percent, compared with an increase of 1.1 percent.
Personal Income (table 8)
Current-dollar personal income increased $244.2 billion in the second quarter, compared with an increase of $269.8 billion in the first quarter. Decelerations in compensation and in personal current transfer receipts were partly offset by an upturn in personal income receipts on assets and a deceleration in contributions for government social insurance (a subtraction in the calculation of personal income).
Disposable personal income increased $193.4 billion, or 4.9 percent, in the second quarter, compared with an increase of $190.6 billion, or 4.8 percent, in the first quarter. Real disposable personal income increased 2.5 percent, compared with an increase of 4.4 percent.
Personal saving was $1.32 trillion in the second quarter, compared with $1.37 trillion in the first quarter. The personal saving rate -- personal saving as a percentage of disposable personal income -- was 8.1 percent in the second quarter, compared with 8.5 percent in the first quarter.
Source Data for the Advance Estimate
Information on the source data and key assumptions used for unavailable source data in the advance estimate is provided in a Technical Note that is posted with the news release on BEA's Web site. A detailed "Key Source Data and Assumptions" file is also posted for each release. For information on updates to GDP, see the "Additional Information" section that follows.
Annual Update of the National Income and Product Accounts
The estimates released today also reflect the results of the Annual Update of the National Income and Product Accounts (NIPAs). The update covers the first quarter of 2014 through the first quarter of 2019.
With today's release, most NIPA tables are available through BEA's Interactive Data application on the BEA Web site (www.bea.gov). See "Information on Updates to the National Income and Product Accounts" for the complete table release schedule and a summary of results for 2014 through 2018, which includes a discussion of methodology changes. A table showing the major current‑dollar revisions and their sources for each component of GDP, national income, and personal income is also provided. The August 2019 Survey of Current Business will contain an article describing the update in more detail.
Previously published estimates, which are superseded by today's release, are found in BEA's archives.
Updates for the first quarter of 2019
For the first quarter of 2019, real GDP is estimated to have increased 3.1 percent (table 1), the same as previously published. Downward revisions to exports, state and local government spending, and private inventory investment were offset by upward revisions to PCE and federal government spending.
For the period of expansion from the second quarter of 2009 to the first quarter of 2019, real GDP increased at an annual rate of 2.3 percent, the same as previously published.
Real GDI is now estimated to have increased 3.2 percent in the first quarter (table 1); in the previously published estimates, first-quarter GDI was estimated to have increased 1.0 percent.
| First Quarter 2019 | |||||
|---|---|---|---|---|---|
| Previous Estimate | Revised | ||||
| Percent change from preceding quarter | |||||
| Real GDP | 3.1 | 3.1 | |||
| Current-dollar GDP | 3.8 | 3.9 | |||
| Real GDI | 1.0 | 3.2 | |||
| Average of Real GDP and GDI | 2.1 | 3.1 | |||
| Gross domestic purchases price index | 0.8 | 0.8 | |||
| PCE price index | 0.5 | 0.4 | |||
Source: BEA

