


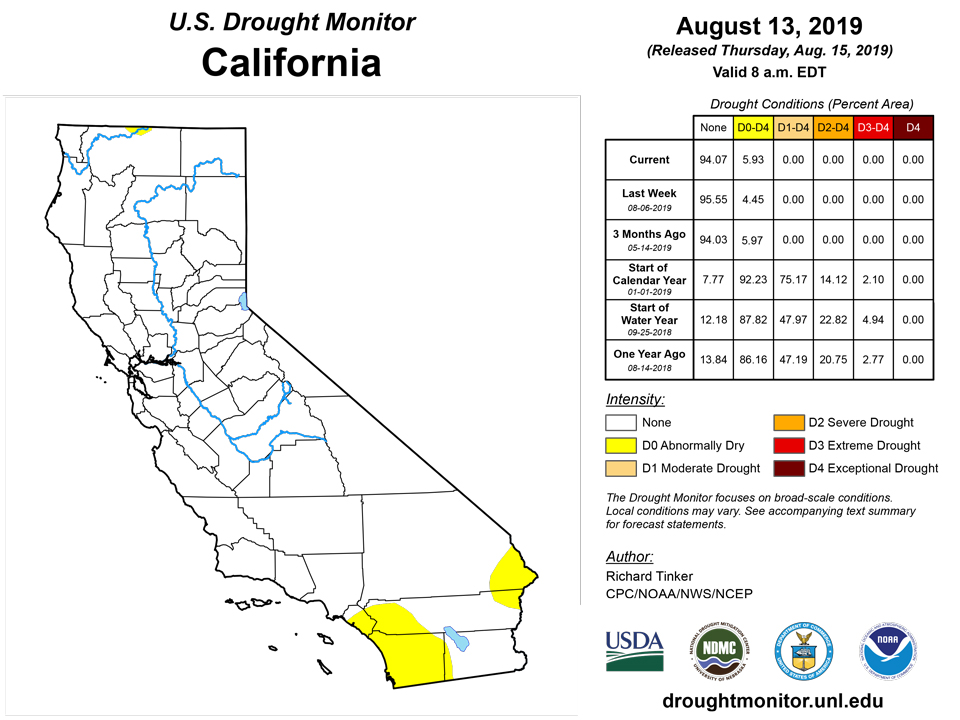
California and National Drought Summary for August 13, 2019
Summary
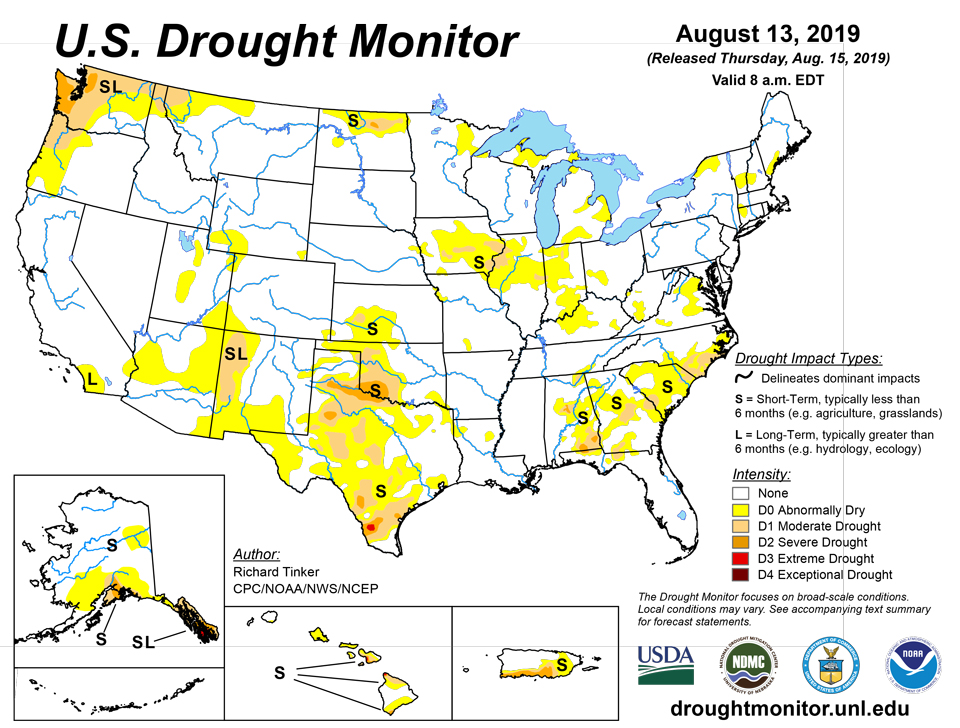
August 15, 2019 - Rainfall this week was highly variable across the eastern two-thirds of the country, which is not unusual during summer. Heavy rain was common in the High Plains, and from the Texas Panhandle and central Oklahoma northward in the Great Plains. Generally 2 to locally 5 inches of rain soaked the Plains from northern and eastern Kansas northward into the central Dakotas, and similar totals were spottier in central Montana, in the middle Mississippi Valley, across northern Minnesota, from the central Ohio Valley through the central Appalachians, over northern New England, and from the Florida Peninsula into southeastern Georgia. Scattered to isolated amounts of 2 to 3 inches were observed from the western half of Tennessee southward to the central Gulf Coast. Farther east, despite isolated moderate rains, only a few tenths of an inch fell on most of the upper Southeast, southern Appalachians, Carolinas, and middle Atlantic region. Several patches from northern California through the Pacific Northwest and northern Idaho recorded 0.5 to locally 2 inches, but most sites received light rain at best. The central and southern Sections of the Rockies and Intermountain West also observed generally light precipitation while no measurable rainfall was almost universal from the Red River to the Rio Grande in Texas, and in central and southern sections of California. The total area enduring abnormal dryness and drought increased, most noticeably in the Ohio Valley, the Midwest, and Texas. Widespread improvement was limited to a broad swath of Alaska from interior northeastern sections to near the Aleutians.
Northeast
Rainfall amounts varied considerably across the region. Most sites recorded 0.5 to 1.5 inches, but some areas reported more (up to 3 inches in northern New England and West Virginia) and others less (a few tenths in the southwestern quarter of Pennsylvania, northern and east-central New York, and the lower reaches of Vermont and New Hampshire). The region remained drought-free, but patches of abnormal dryness (D0) cover northwestern Connecticut and surrounds, northernmost New York, central Vermont and west-central New Hampshire, southern Maine, and southern West Virginia. Only 10 to 40 percent of normal rainfall covered northern New York and southern Maine over the past 30 days while 60-day totals were 50 to 75 percent of normal in central Vermont, west-central New Hampshire, northwestern Connecticut, and southern West Virginia.
Southeast
Showers and thunderstorms were hit-and-miss across the region, but only a few tenths of an inch of rain fell on most of the Carolinas (away from the immediate coast), central and northern Georgia, and the eastern half of Alabama. Rainfall was a little more abundant in western Alabama, Florida, and especially southeastern Georgia. At least a few tenths of an inch fell, and amounts of 1.5 to locally 3.5 inches covered nearly half of these areas. The heavier totals (over 1.5 inches) were more widespread in southeastern Georgia, with 4 to nearly 6 inches soaking a few patches near the Florida border. Dryness and drought improvement were noted in a few small areas where rainfall was heavier, but deterioration was much more common, especially from eastern Alabama through southeastern North Carolina. Most notably, abnormal dryness expanded broadly to cover most of central Georgia and South Carolina. Rainfall deficits of 6 to 9 inches since mid-May were observed in parts of southeastern Alabama and southeastern North Carolina while amounts 3 to 6 inches below normal covered central and southwestern Georgia and a few areas of non-coastal South Carolina.
South
No measurable rain fell on a large area from the Red River Valley southward through Texas east of the Big Bend, extending eastward into southwestern Arkansas and central Louisiana. In contrast, most of northeastern Oklahoma and northern Arkansas were doused by 2 to locally 6 inches of rain. Less remarkable rainfall amounts exceeding one-half inch were recorded in the Texas Panhandle, central and northern Oklahoma, southwestern Tennessee, and Mississippi, with heavy rains approaching 4 inches reported in a few scattered areas. Dryness and drought expanded and intensified, with some degree of dryness now covering northeastern Texas, part of northern Louisiana, central and western Oklahoma, and roughly the western two-thirds of Texas from the upper reaches of Deep South Texas northward to the central Panhandle and the Big Bend. Severe drought was noted in parts of southern Texas, west-central Texas, and in a strip from southwestern Oklahoma westward along the southern fringes of the Texas Panhandle. Parts of these D2 areas received 3 to 6 inches less rainfall than normal over the past 60 days, including most of southwestern Oklahoma and adjacent Texas. Dating back to mid-July, most of Oklahoma (outside the northeastern quarter) and Texas were at least an inch short of normal rainfall; 30-day rainfall totals below 0.5 inch fell on southwestern Oklahoma and a broad swath of central and southern Texas from the Red River and lower Panhandle southward to the lower Rio Grande Valley.
Midwest
Abnormal dryness continued the recent trend of expansion, and a few areas of moderate drought were introduced. Several patches were brought in to central and eastern Iowa, and adjacent Illinois, along with smaller, more-isolated regions in eastern Illinois and northern Indiana. Meanwhile, abnormal dryness stretched to cover most areas from central Iowa eastward to central Indiana and southwestern Michigan, plus portions of southwestern Ohio, southern Indiana and adjacent Kentucky, sections of northern and eastern Michigan, and northeastern Minnesota. The last 30 days brought only 0.5 to 2.0 inches of rain to the broad strip from central Iowa through western Indiana, in addition to east-central Michigan and the eastern half of the Upper Peninsula.
High Plains
Several inches of rain doused a broad area from eastern Kansas northwestward through South Dakota, western North Dakota, and the northern High Plains. Dryness and drought were confined to central and southern Kansas, east-central Nebraska, and northern North Dakota, where a small area of severe drought was introduced. In contrast to areas farther north, central and south-central Kansas recorded only 0.5 to locally 2.0 inches of rain since mid-July.
West
Periodic light to moderate rain has fallen for a few weeks now from central and southern Washington eastward through southwestern Montana, prompting improvement in some former D0 to D1 regions there, and in adjacent Oregon. Farther south, abnormal dryness persisted in several areas from southwestern Wyoming through Utah and western Colorado; D0 expanded northward a bit into areas north of the Four Corners near the Colorado/Utah border. Across the southern Rockies and southwestern deserts, deficient monsoon rains continued, and increasing moisture deficits prompted a broad expansion of abnormal dryness from southeasternmost California through eastern Arizona, and farther south from southeastern Arizona across southern New Mexico.
Alaska, Hawaii, and Puerto Rico
Heavy precipitation and cooler temperatures brought continued relief to much of Alaska. Abnormal dryness remained in the Yukon Flats, but all other dry areas across the interior were removed. In contrast, beneficial precipitation evaded much of southern Alaska for the second consecutive week. And abnormal dryness or drought still covers areas from interior southwestern Alaska through the southeastern Panhandle. South-central Alaska has been particularly parched recently. The last 3 months brought record to near-record low rainfall totals to part of the region, thus severe drought (D2) was introduced there.
A fairly typical summer week of scattered rainfall affected Puerto Rico. Dryness and drought essentially persisted, except for areas that missed much of the rain over the last few weeks. D2 was expanded eastward in south-central Puerto Rico, and the eastern D0 boundary was pushed eastward in eastern parts of the Commonwealth.
An unremarkable week of typical summer weather was also observed across Hawaii, leaving areas of dryness and drought unchanged.
Pacific Islands
The weather pattern during this USDM week (8/7/19-8/13/19) began with Tropical Storm Krosa bringing rain to the Marianas. The tropical storm strengthened to Typhoon Krosa but moved little in the following days; Krosa had moved out of the area by the end of the week. A monsoon trough extended through Krosa, across the Marianas, and into the central Federated States of Micronesia (FSM) for much of the week. A high pressure ridge to the south of Krosa dominated the weather all week over far western Micronesia (Palau and western Yap State). The Marshall Islands (RMI) and the eastern to central FSM were influenced, at various times, by surface troughs, trade-wind disturbances, trade-wind convergence, weak circulations, and upper-level divergence. The weather over American Samoa was dominated by a strong mid-level ridge.
Satellite-based estimates of 7-day precipitation (QPE) showed 4-10 inches of rain, and more, northwest of the Marianas associated with Krosa. Parts of central and especially northern Marianas were covered by the edge of this region, with 2-6 inches of rain indicated. Areas of 2-4 inches of rain extended in a band from the Marianas southeastward to the eastern FSM and parts of the RMI. Areas of 1-2 inches of rain extended east of this band over the rest of the RMI and to the west into Yap State. Little to no rain was indicated on the QPE over western Yap State to Palau. South of the equator, areas of 1+ inches of rain were indicated northwest of the Samoan Islands, but the QPE showed little to no rain over American Samoa.
Rainfall totals in the Marianas associated with Tropical Storm Krosa were highest on Saipan where 2.38 inches of rain was recorded this week. Rota saw 1.18 inches and Guam recorded 0.39 inch. Rainfall totals for the month of August are now over 11 inches for all three islands which is nearly three times the 4-inch monthly minimum needed to meet most water needs. Drought-free conditions remain on each island.
The Palau International Airport recorded only 0.25 inch of rain this week. However, this is the first dry week in a month and June (16.30 inches) and July (15.04 inches) were wet with rainfall each month nearly double the 8-inch monthly minimum needed to meet most water needs. Palau remains drought-free.
Despite it being a dry week for the western and central parts of the Federated States of Micronesia, the entire nation remained free of drought since July precipitation totals across the area were all above the 8-inch minimum, ranging from 10 to 19 inches. Yap (no rain), Woleai (0.57 inch), Chuuk Lagoon (0.56 inch; one day missing), and Lukunor (0.31 inch; one day missing) saw less than half the 2-inch weekly minimum needed to meet most water needs, while Kapingamarangi (1.16 inches) and Nukuoro (1.70 inches) were just below the 2-inch weekly threshold. Fananu (2.47 inches; two days missing), Pohnpei (2.98 inches; one day missing), Pingelap (7.88 inches; one day missing), and Kosrae (2.39 inches; one day missing) saw ample rainfall.
Jaluit was the driest of the Marshall Islands this week. Only 0.40 inch of rain was recorded this week which follows the driest July and June-July on record, and brings the August precipitation total to only 1.77 inches. Severe drought (D2-SL) remains for the island. Kwajalein saw rain every day this week which summed to 4.16 inches. Since this follows the 2.34 inches of rain last week, Kwajalein improved one category to moderate drought (D1-L). Ailinglapalap recorded 4.39 inches of rain this week which brings the rainfall total for the last three weeks to 10.44 inches. Abnormal dryness was removed from Ailinglapalap leaving D-nothing. Despite seeing a wet week, Majuro (3.99 inches) remains abnormally dry (D0-S) due to previously dry conditions and reservoir levels sitting around 28 million gallons, which is just below the critical 80% of capacity level. Wotje also met the 2-inch weekly threshold with 2.41 inches but remains in moderate drought (D1-SL) this week since it was improved one category last week. Utirik (2.43 inches) remains in severe drought (D2-SL). Mili saw 3.73 inches of rain this week and remains free of drought.
Dry conditions were found in American Samoa this week with Pago Pago reporting only 0.18 inch of rain. Other stations on the island reported closer to 0.40 inch. July, however, was wet with 17.54 inches of rain at Pago Pago, 11.70 inches for Siufaga Ridge, and 8.82 inches for Toa Ridge, so there are no concerns of dryness or drought at this time.
Virgin Islands
An upper-level high pressure system was present at the beginning of the USDM week on Aug. 7, leaving the USVI mostly dry. A weak surface trough moved into the area overnight on Aug. 7 followed by a tropical wave late on Aug. 8 and into Aug. 9, both of which increased moisture, instability, and shower activity. A drier air mass took over briefly on Aug. 11 before another tropical wave passed through the region on Aug. 12, again causing an increase in shower activity. Weather stations throughout the USVI picked up anywhere between 0.08 and 1.00 inch of rain over the course of the week.
On St. Croix, Rohlsen Airport saw 0.08 inch of rain this week. With the rain last week, the August total is already at 1.79 inches or 174% of the normal to date. The year-to-date total of 14.54 inches is 83% of normal. Christiansted Fort saw 0.94 inch of rain this week and sits at 194% of normal for August to date and 80% of normal for the year to date. SPI values for St. Croix on the one-, three-, and six-month scales (ranging from -0.38 to 1.62) indicate drought-free conditions, while values indicate abnormally dry (D0) conditions on the nine-month scale (-0.62), and moderate drought (D1) conditions on the 12-month scale (-0.96). With the continued rain showers this week and improvement in 9-month SPI, St. Croix was improved one category to abnormal dryness (D0-L), with the “L” denoting drier conditions on long-term scales.
St. Thomas’s King Airport recorded 0.28 inch of rain this week. This brings the August rainfall total to 1.64 inches or 141% of normal to date. This follows the wettest July on record. The year-to-date precipitation total amounts to 18.28 inches or 103% of normal. SPI values on one-, three-, six-, nine-, and 12-month time scales ranged between 2.1 and -0.49, all of which indicate drought-free conditions. St. Thomas was improved one category to abnormal dryness (D0-L) with lingering impacts from drier conditions on longer-term scales.
East End ended up with 3.72 inches of rain in July, or 122% of normal. The July rainfall brought the year-to-date total to 14.16 inches which is 83% of normal. A volunteer observer at Windswept Beach recorded 3.62 inches of precipitation in July, which was 106% of the long-term July average for that location. At the end of July, the year-to-date rainfall total of 15.50 inches was 76% of the long-term average. With 1 inch of rain this week, Windswept Beach has seen 1.98 inches of rain so far in August. This puts August 2019 on pace to finish close to the August long-term average of 4.65 inches. At the end of July, SPI values at East End indicated drought-free conditions on the one-, three- and 12-month scales (-0.2, -0.09, and -0.27, respectively), abnormal dryness (D0) on the six-month scale (-0.66), and moderate drought (D1) on the nine-month scale (-1.21). Windswept Beach SPI values from July indicate drought-free conditions on the three-, nine-, 12-month scales (0.02, -0.23 and -0.45), abnormally dry conditions (D0) on the one-month scale (-0.62), and moderate drought (D1) conditions on the six-month scale (-0.96) St. John was improved one category to abnormal dryness (D0-L) with the improved short-term SPI values and continued precipitation.
Looking Ahead
During the next 5 days (August 15 - 20, 2019) should bring heavy rains of at least 1.5 inches across the central Great Plains and much of the Midwest, with 3 to 5 inches forecast from northwestern Missouri and adjacent areas northward through central and eastern Iowa. Amounts exceeding 1.5 inches are also forecast for the Mississippi Delta and along the immediate Gulf and southern Atlantic Coasts. A few patches along the Atlantic Coast from southeastern Georgia through North Carolina should receive 3 to 4 inches. Moderate rains of 0.5 inch or more are anticipated in parts of upstate New York, northern New England, and inland areas near the central Gulf and southern Atlantic Coasts. Similar amounts are expected in most of the western Great Lakes, Midwest, Great Plains from Kansas into the central Dakotas, and upper Mississippi Valley. A few tenths of an inch should fall on the middle Atlantic region, the rest of the central and northern Great Plains and Mississippi Valley, and parts of central and northern Texas and adjacent Oklahoma. Little or no rain is expected in the rest of the 48 contiguous states, including the interior Southeast, the Ohio Valley, southern Texas, and most areas from the Rockies westward. Daytime high temperatures should average 3°F to 6°F below normal in the northern one-third of the Plains, and near 3°F below normal in north-central Florida. In contrast, daily highs are forecast to average around 3°F above normal in the middle Atlantic region, and 3°F to locally 9°F above normal from the southern half of the Great Plains westward through most of the Rockies, the Intermountain West, the Great Basin, and California away from the immediate coast.
The CPC 6-10 day outlook (August 21 -25, 2019) favors above-normal precipitation in the Alaskan Panhandle, parts of the Pacific Northwest, the northern Great Plains, the Mississippi Valley, southeast Texas, the Ohio Valley, the Southeast, and the middle Atlantic region. Meanwhile, enhanced chances for subnormal precipitation cover most of Alaska, although no tilt of the odds in either direction is indicated from the Kenai Peninsula westward through the Borough of Dillingham. Below normal precipitation chances are also elevated in upstate New York, most of New England, the central and southern Great Plains from central Texas through southwestern South Dakota, most of the High Plains, and the central Rockies. Neither precipitation extreme is favored elsewhere. Above-normal temperatures are favored across most of the country, with elevated chances for subnormal temperatures restricted to northwestern Montana, most of central and eastern Alaska, and the northern Alaska Peninsula. Neither positive nor negative temperature anomalies are favored in parts of the northern Rockies and in the lower Mississippi Valley.
Author(s):
Richard Tinker, NOAA/NWS/NCEP/CPC
Claire Shield, National Drought Mitigation Center
Dryness Categories
D0 Abnormally Dry—used for areas showing dryness but not yet in drought, or for areas recovering from drought.
Drought Intensity Categories
D1 Moderate Drought
D2 Severe Drought
D3 Extreme Drought
D4 Exceptional Drought
Drought or Dryness Types
S Short-Term, typically less than 6 months (e.g. agricultural, grasslands)
L Long-Term, typically greater than 6 months (e.g. hydrologic, ecologic)
Source: National Drought Mitigation Center

