


California and National Drought Summary for September 3, 2019
Summary
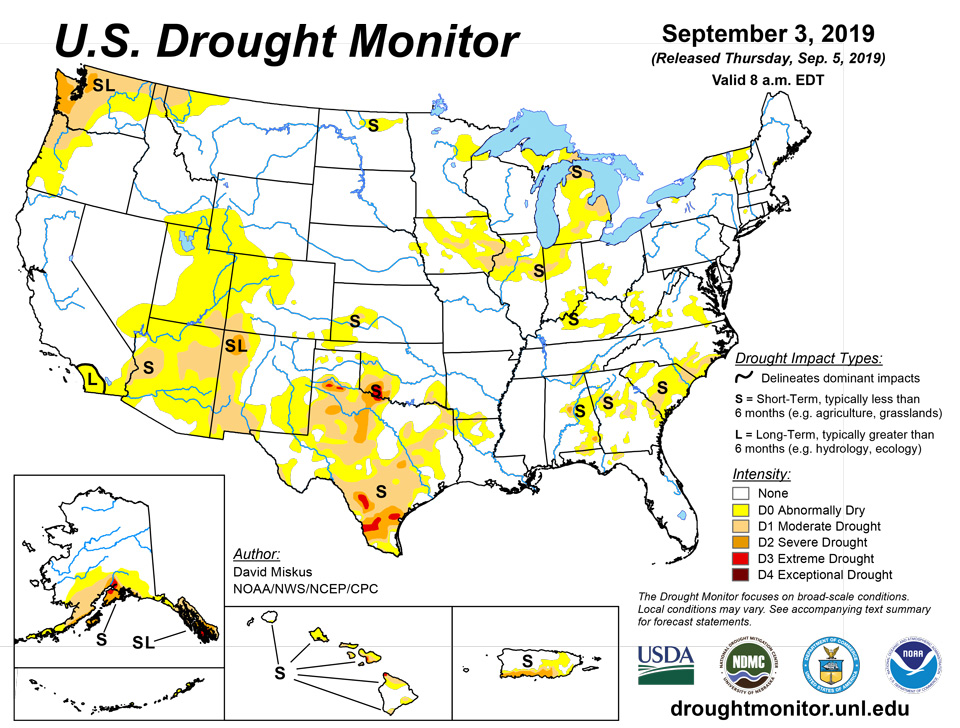
September 5, 2019 - The highlight of the week was intense and destructive Hurricane Dorian, with sustained winds of 185 mph and a central pressure as low as 911 mbs. Fortunately for the U.S. (as of Sep. 4), Dorian never made landfall along the Southeastern coast; however, while a Category 5 hurricane, it stalled over the northern Bahamas, devastating the islands of Great Abaco and Grand Bahama. For the most part, Florida dodged a Dorian disaster as the hurricane remained stalled over the northern Bahamas, slowly weakened, and finally drifted northward by the period’s end. Some rain bands from Dorian dropped 1-4 inches along Florida’s east coast. Puerto Rico also missed a direct hit from Dorian as it was strengthening into a hurricane to its east, although scattered convection did bring the island some welcome rain. Elsewhere, a series of cold fronts dropped southeastward out of Canada, bringing subnormal temperatures to most of the Nation east of the Rockies, and helping to prevent Hurricane Dorian from tracking westward and making landfall in Florida. The fronts brought light to moderate rain to the northern Plains, upper Midwest, Great Lakes region, and Northeast, while clusters of storms dumped occasionally moderate to heavy (2-6 inches) rains on parts of the south-central Great Plains, lower Missouri Valley, and Southeast. The Southwest monsoon made a partial comeback, bringing light showers to portions of southern Arizona, most of New Mexico, and southwestern Texas, but overall has been a disappointment. The Far West, with high pressure in control, was mostly dry and warm. Light to moderate showers fell along southern coastal Alaska, but it was not enough for any improvement. Meanwhile, increased rainfall across southern sections of the Big Island aided vegetative growth and diminished deficits, thus improvement was shown.
Northeast
A series of cold fronts raced across the Northeast, ushering in cooler air and frequent showers and thunderstorms. A swath of 1-3 inches of rain fell from northeastern Kentucky northeastward into Maine, with locally 4-6 inches near Pittsburgh, PA. The rains and subnormal temperatures were ideal for erasing 60- and 90-day deficits across most of upstate New York, parts of Vermont and New Hampshire, northwestern Connecticut, and southeast coastal Maine. Most USGS stream flows have gradually responded, moving into normal levels at 7-and 14-days. But where the short-term deficits were greater and rainfall was lighter, some small areas of D0 remained. Similarly in southwestern West Virginia, scattered showers also provided some D0 relief, but not all abnormal dryness was erased.
Southeast
With Category 5 Hurricane Dorian coming close to Florida but instead stalling over the northern Bahamas, then slowly weakening and turning northward, Florida was spared the destructive forces (wind, rain, waves) of Dorian. Instead, scattered bands of rain (2-4 inches) fell along the east coasts of Florida and Georgia, while a stationary front triggered scattered showers and thunderstorms (1-2.5 inches) in southern sections of Alabama and Georgia, eastern South Carolina, and southeastern North Carolina. Farther north, scattered thundershowers fell across northern Virginia, eliminating the D0 area there. In contrast, little or no rain was measured in northern Alabama and Georgia, central South Carolina, western and northern North Carolina, and southern and central Virginia. With the scattered nature of the rain, some areas showed slight improvement while other somewhat degraded, and many areas remained as is. 7- and 14-day averaged USGS stream flow were generally in the normal category, although shorter-term (instantaneous and 1-day) were beginning to depict some below and much below normal values across central parts of Alabama, Georgia, and South Carolina.
South
While northeastern, southwestern, and southeastern Texas, most of Oklahoma, and northwestern Louisiana received widespread light to moderate rains (1 to 3 inches, locally to 6 inches), little or no rain fell on the Oklahoma Panhandle, southern and central Texas, northeastern Louisiana, and most of Arkansas, Mississippi, and Tennessee. Accordingly, a 1-category short-term deterioration was made in southern and central Texas, but improvement occurred in portions of central Oklahoma and northeastern Texas, including a 2-category improvement (D1 to nothing) where 3-6 inches of rain fell in the latter area. 7-day averaged USGS stream flows dipped below the tenth percentile (much below normal) in south-central Texas where D2 and D3 expanded. Although it was dry in Arkansas, Mississippi, and Tennessee, prior surplus rainfall has left the soil moisture in good shape for now. An exception was in extreme southeastern Tennessee where D0 and D1 increased.
Midwest
Frequent cold front passages meant several rounds of showers and thunderstorms across the northern Plains and upper Midwest, while thunderstorm clusters developed in eastern Kansas and central Missouri. Most of Ohio also saw widespread rainfall from frontal passages. Therefore, some reduction in D0 was made in northeastern Minnesota, the Upper Peninsula of Michigan, southwestern Ohio, southwestern Indiana, and parts of eastern Kentucky. In-between the rains however, drier weather was experienced across the western and central Corn Belts and in southern Missouri, Illinois, Indiana, and western Kentucky. Less than 70% of normal precipitation had fallen across most of Iowa, northern Illinois, northwestern Indiana, and lower Michigan the past 60-days, with accumulated 90-day deficits exceeding 4 inches in parts of Iowa and northwestern Illinois. Accordingly, D0 was expanded in northeastern Iowa, northwestern and south-central Indiana, and south-central lower Michigan. D1 was increased in central Iowa, central Illinois, northwestern Indiana, and southeastern lower Michigan. Shortages of soil moisture are in the upper layer as a record wet winter and spring has left ample subsoil moisture, with most USGS stream flows average or above-normal.
High Plains
Most of the High Plains experienced relatively dry and cool weather, but fortunately the few areas with dryness or drought (northern North Dakota and southwestern Kansas) received well-placed light to moderate rains. In North Dakota, a thunderstorm complex moved across the northern and eastern portions of the state on Day7, dropping 1-3 inches of rain over the D0-D2 area and effectively reducing dryness and drought by 1-category. 60- and 90-day precipitation anomalies were now close to zero, with only longer-term (6-months) deficits still lingering. In southwestern Kansas, 1-2.5 inches of rain fell across the eastern half of the D0-D1 areas, greatly reducing its coverage. In north-central Montana, although precipitation was light (<0.25”) this week, the past several weeks brought light to moderate amounts, and after reassessing conditions at 60- and 90-days, D0 was removed as most indices were normal or moist. In Colorado and Wyoming (and much of the Southwest), after a wet and cold winter and spring, the summer monsoon has been rather disappointing. 2- and 3-month SPIs are negative (dry), and precipitation shortages are common. With this week’s unseasonable warmth, D0(S) was added across a large portion of the Southwest (see below) to depict the poor summer rains.
West
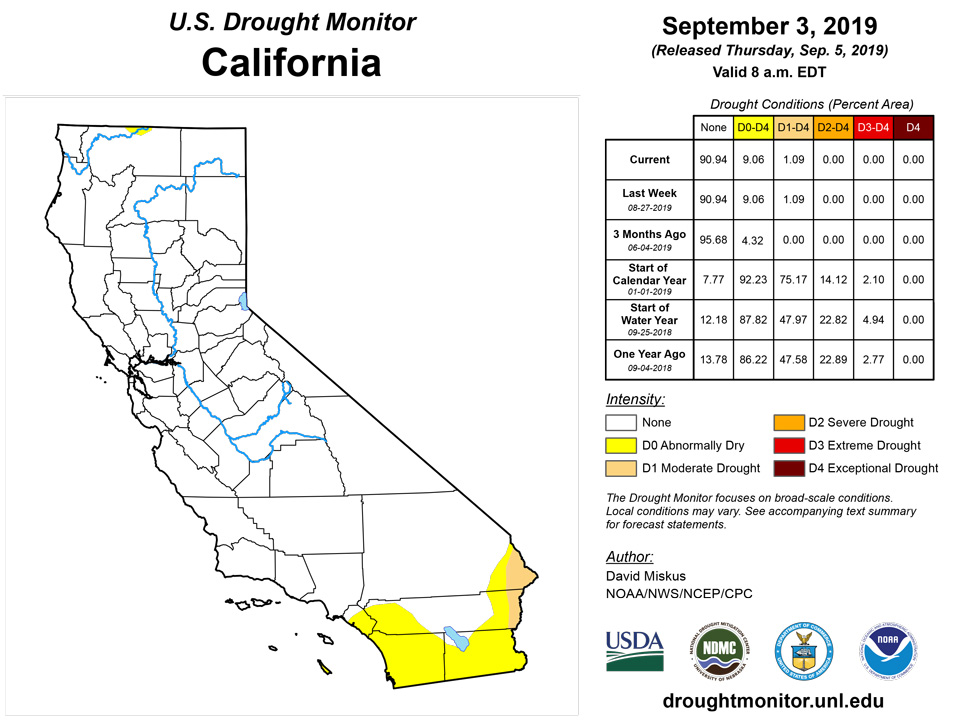
In the Southwest, the gradual winding down of the southwest monsoon usually occurs in late September. So far, the 2019 southwest monsoon has been mostly disappointing, with parts of Arizona and the Four Corners region experiencing their driest summer on record mostly due to the notable lack of monsoon rainfall. Hot and dry weather occurred this week, although some rains (0.5-2 inches) fell on southeastern Arizona and most of New Mexico. Across most of the region, SPIs are less than -1 at the 30-, 60-, and 90-day time scales. While the longer-term SPIs show better numbers, the short-term stresses are outweighing the long-term values. Evaporative demand has been greater than normal, and even though water supplies are still in good shape, reservoir levels are dropping quicker than usual for this time of year, and stream flows have declined. Therefore, with August SPEIs less than -1.5, 3-month (JJA) precipitation in the lower tenth percentile, little or no rain this week, and 1-week EDDI at D2 or worse, a large area of D0 was added to reflect this short-term dryness. In southwest Colorado and southeast Utah, D1 was added to depict areas that have reported record low JJA rainfall. In Arizona, D0 was expanded across southeastern sections while D1 slightly increased in central areas in response to low SPIs and increased 90-day deficits. For example, Flagstaff, AZ has only received 1.15” of rain since June 15 (driest on record) when 6.10” should have fallen by now, and several nearby stations (Prescott, Heber, Payson, Winslow) have also measured near-record low monsoon totals.
Alaska, Hawaii, and Puerto Rico
Light to moderate precipitation (1-2 inches, locally to 5 inches) fell along Alaska’s southern coastal areas, lighter amounts (0.25-0.75 inches) were reported across the northern third of the state, and little or no precipitation occurred in the central interior. Statewide weekly temperatures averaged near to above normal. With another 0.5 inches of precipitation this week, over 3 inches the past 30 days, and gradually declining temperatures, the D0 area was removed in east-central Alaska. Along southern sections, however, the precipitation was not enough to warrant any improvements, but was enough to stave off further deterioration. August was unfavorable to Anchorage as it recorded its driest (0.04”, normally 3.25”) and warmest (average temperature = 62.6 degF, or 5.9 degF above normal) August ever.
Strengthening Hurricane Dorian steered east of Puerto Rico, bringing heavier rains, gusty winds, and high ocean swells to the Virgin Islands. Although the island missed a direct hit, scattered convection flared up over parts of Puerto Rico as Dorian neared, producing 1.5-4 inches of rain in northwestern, south-central, and eastern sections. Locally, some locations received up to 8 inches for the week. Accordingly, some D0-D2 was trimmed away where the greatest totals occurred, namely along the northern edge of the southern coastal D0-D2 areas, and some D0 was removed in parts of southeastern Puerto Rico. In contrast, D0-D2 slightly increased in southwestern sections where rainfall totaled under an inch, and 90-day deficits of 5-10 inches existed.
In Hawaii, the southern portions of the Big Island continued to recover as rainfall and NDVI data supported additional easing of drought and dryness. Therefore, D2 was improved to D1 near South Point, while the D0 coverage was diminished over the Kau District. Elsewhere, light showers fell along the windward sides of the islands while generally dry weather occurred along leeward locations. Further changes next week are possible once the August 2019 data is examined, but for this week, status-quo for the rest of Hawaii.
Pacific Islands
The weather pattern during this USDM week (8/28/19-9/3/19) consisted of a monsoon trough across western Micronesia and a near-equatorial surface trough across eastern Micronesia at various times during the week. Several weak circulations and tropical disturbances moved westward across Micronesia within this line of pressure weakness. Near the end of the week, a tropical disturbance intensified as it moved northwest of the Marshall Islands (RMI), eventually strengthening into Tropical Storm 14W. Tropical disturbances and trade-wind convergence contributed to rain over eastern Micronesia, while upper-level troughs and lows and their associated divergence aloft enhanced rain over northern portions. South of the equator, stable air with subsidence aloft associated with high pressure ridges dominated the weather over American Samoa, keeping low pressure troughs at bay for most of the week. Satellite-based estimates of 7-day precipitation (QPE) showed a broad band of 2+ inches of rain extending along the monsoon trough from Southeast Asia into western Micronesia, and areas of 2+ inches over southeast RMI and north of the RMI. Areas of 4+ inches were noted within these bands. Areas of 1+ inches of rain could be seen across parts of the Marianas and eastern Yap State to Kosrae State in the Federated States of Micronesia (FSM). South of the equator, the QPE showed an area of 1+ inches, with locally up to 4 or more inches, of rain northwest of the Samoan Islands, with very little rain indicated over American Samoa. The Republic of Palau had an exceptionally wet week, with 12.25 inches of rain reported at the international airport. As a result, D-nothing continued. Ample rain continued to fall in the Mariana Islands, with nearly all observation sites meeting the one-inch weekly minimum value and thus retaining a D-nothing designation. In addition, August was very wet, with Guam International Airport receiving 19.92 inches (116 percent of normal) and Saipan/Isley reporting 16.76 inches (138 percent). Rota was also wet in August, with 17.79 inches of rain recorded. In the Federated States of Micronesia, most islands remained wet enough to remain D-nothing, with weekly totals approaching or topping the 2-inch weekly minimum value. Lukunoch was very wet the previous week, with 5.66 inches of rain, but received only 1.13 inches (with one day missing) during the week ending September 3. Given Lukunoch's monthly totals of 13 to 17 inches in June, July, and August, D-nothing was maintained despite the drier weather. On Pingelap, ample rain fell from February through August. However, the last full week of August was dry (0.60 inch), and the week ending September 3 featured rainfall totaling 1.30 inches. As a result, D0-S was introduced for Pingelap, based on strictly short-term dryness. Elsewhere, no data was reported from Ulithi and thus no analysis was made. In the Republic of the Marshall Islands, Majuro and Mili continued to report heavy rain, with 5.90 inches falling in the latter location. Majuro’s reservoir storage climbed to 30.685 million gallons (85 percent of capacity) by September 3, on the strength of a weekly rainfall total of 4.44 inches, supporting D-nothing. Data reporting resumed for Wotje, where weekly rainfall topped the 2-inch weekly minimum requirement and totaled 3.60 inches. However, the previous 2 weeks were relatively dry, leaving Wotje with a drought designation (D1-SL) that matches what was noted 2 weeks ago. Meanwhile, Jaluit remained at D2-SL after receiving a weekly total of 1.41 inches and again failing to meet the 2-inch weekly minimum rainfall requirement. Farther north, Utirik was classified D4-SL as recently as late July but experienced some drought relief during the first 3 weeks of August. The last 2 weeks, however, have featured a little less rainfall, although the 2.07-inch total during the recently ended drought-monitoring period barely met the 2-inch weekly minimum. As a result, the classification for Utirik was unchanged at D1-L. Elsewhere, slightly drier weather has developed the last 2 weeks at Kwajalein and Ailinglapalap. With rainfall during the week ending September 3 totaling 0.71 inch at Kwajalein and 1.15 inches at Ailinglapalap, D0-S was introduced at both locations. In American Samoa, heavy rain (6.26 inches) fell at the Pago Pago Airport during the week ending August 20, but rain has since dwindled. The airport ended August with a monthly sum of 8.60 inches (137 percent of normal). However, only 0.82 inch fell at the airport during the week ending August 27, and little rain has fallen since. National Park Service rain gauges in American Samoa also indicated short-term dryness, with an inch or less falling during the drought-monitoring period, leading to a designation of D0-S.
Virgin Islands
Dorian suddenly intensified on August 28, becoming a Category 1 hurricane while traversing the northern U.S. Virgin Islands. Locally heavy showers briefly lingered across the region in the wake of Dorian's passage, followed by the return of mostly dry weather. Weekly rainfall as recorded by a volunteer observer totaled 5.27 inches at Windswept Beach on St. John, with most – 3.82 inches – falling in a 24-hour period on August 27-28. Similarly, preliminary weekly totals on St. Thomas reached 5.98 inches near Anna’s Retreat (CoCoRaHS observer) and 4.16 inches at King Airport, with the bulk of the rain falling during and shortly after Dorian’s passage. U.S. Geological Survey wells responded nicely to the tropical showers, with the groundwater level rising to its highest point since March 2019 on St. John and since November 2018 on St. Thomas. Due to the heavy rain and groundwater response, D0-L was changed to D-nothing on both islands. Meanwhile, showers were more scattered and less intense on St. Croix. Rainfall during the drought-monitoring period totaled 1.98 inches just southeast of Christiansted (CoCoRaHS observer) and 0.87 inch at Rohlsen Airport. The USGS well on St. Croix did not respond to the rain, leaving the groundwater at its lowest level since early 2017. In addition, Standardized Precipitation Index (SPI) values on St. Croix still indicate that abnormal dryness is supported at time periods ranging from 9 to 12 months. As a result, D0-L was maintained on St. Croix, reflecting lingering long-term drought impacts.
Looking Ahead
During the next 5 days (September 5-9, 2019), Hurricane Dorian will turn north, then northeastward and make a close pass (or landfall) along the Carolina coasts before accelerating quickly off the Northeast coast and into the northern Atlantic Ocean. Heavy rains, gusty winds, and high waves will pound the Carolina coasts, possibly dropping up to 15 inches of rain on coastal sections of South and North Carolina. Elsewhere, an active Southwest monsoon should drop scattered showers across the Four Corners region, while an active northern jet stream should bring light to moderate precipitation to the Pacific Northwest, northern Rockies and Plains, western Corn Belt, and upper Midwest. Little or no rain is expected in California and southern Nevada, the southern half of the Plains, lower Mississippi, Tennessee, and eastern Ohio Valleys, eastern Great Lakes region, and central Appalachians. Temperatures should average above-normal across the southern two-thirds of the Nation and Northwest, and subnormal from the northern Plains eastward to the Northeast.
The CPC 6-10 day outlook (September 10-14, 2019) favors above-normal odds for precipitation in the Southwest, across the northern third of the U.S., and most of Alaska, with diminished rain chances in the Southeast. Above-normal temperatures are expected east of the Rockies, except for subnormal readings favored in New England. West of the Rockies, below normal temperatures are likely in the Intermountain West. Alaska should continue to experience above-normal temperatures.
Author(s):
David Miskus, NOAA/NWS/NCEP/CPC
Brad Rippey, U.S. Department of Agriculture
Dryness Categories
D0 Abnormally Dry—used for areas showing dryness but not yet in drought, or for areas recovering from drought.
Drought Intensity Categories
D1 Moderate Drought
D2 Severe Drought
D3 Extreme Drought
D4 Exceptional Drought
Drought or Dryness Types
S Short-Term, typically less than 6 months (e.g. agricultural, grasslands)
L Long-Term, typically greater than 6 months (e.g. hydrologic, ecologic)
Source: National Drought Mitigation Center

