


California and National Drought Summary for December 7, 2021
Summary
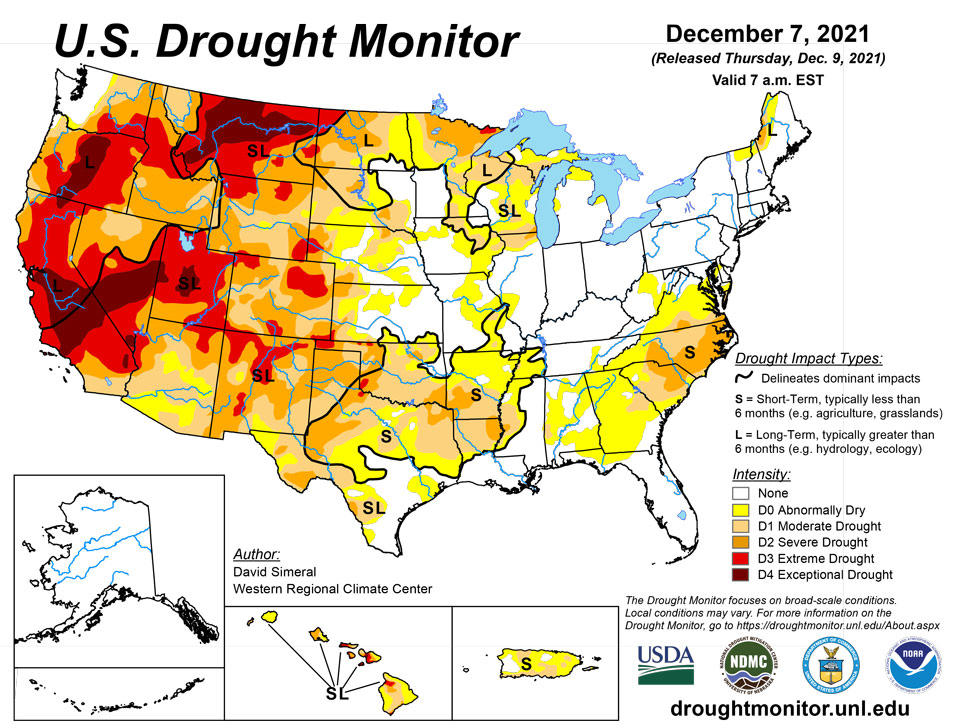
December 9, 2021 - This U.S. Drought Monitor (USDM) week saw continued deterioration in conditions across areas of the Mid-Atlantic (Virginia, North Carolina) and the Southeast (South Carolina, Georgia) in response to below-normal precipitation (past 30- to 90-day period), declining soil moisture and streamflow levels. Likewise, drought-affected areas expanded and intensified on the map in areas of the South including Louisiana, Arkansas, and Texas as well as in the Southern Plains of Oklahoma, where overall warm and dry conditions have prevailed during the past 30- to 120-day period. Across areas of the Northern Plains, Upper Midwest, and the Northeast, light-to-heavy snowfall accumulations were observed during the past week. The heaviest accumulations (8-18 inches) were centered on northern portions of Minnesota, Wisconsin, and Michigan, while lake-effect snowfall (2 to 8 inches) impacted areas downwind of Lake Erie and Lake Ontario in New York, according to snowfall analysis from the National Weather Service (NWS) National Operational Hydrologic Remote Sensing Center (NOHRSC). Out West, some areas including the North Cascades, Sierra Nevada, and the Northern and Central Rockies, received much-needed snowfall this past week. However, basin-level snowpack conditions remained below normal across the entire western United States. In Hawaii, a Kona Low delivered very heavy rainfall accumulations (highest totals exceeding 16+ inches) leading to widespread flooding, power outages, and damage to infrastructure in areas across the Hawaiian Island this week. Impacts from the multi-day event led Hawaii Governor Ige to declare a state of emergency on December 6. With the meteorological autumn (September-November) coming to a close, the Lower 48 experienced its third warmest fall on record with the largest mean temperature departures from average observed across areas of the Northern and Central Plains, according to NOAA’s National Centers for Environmental Information (NCEI). In terms of fall precipitation, the driest conditions were observed across parts of the Southwest, Texas, Montana, Wisconsin, and the Carolinas.
Northeast
In the region, only minor changes were made on this week’s map including expansion of areas of Abnormally Dry (D0) in eastern Maryland, Delaware, and West Virginia in response to shorter-term dryness (past 30- to 90-day period) and declining streamflow levels. For the week, the region was generally dry with exception to snowfall in Upstate New York as well as in northern Maine. Average temperatures for the week were cooler than normal across northern parts of the region, including northern portions of Maine, New Hampshire, and Vermont, where departures ranged from 2 to 6 degrees below normal. Elsewhere in the region, average temperatures were 2 to 8 degrees above normal. According to NOAA NCEI, the last 4-month and 6-month periods were the warmest on record for the Northeast Climate Region.
Southeast
During the past week, light rainfall accumulations (< 1 inch) were observed across areas of Alabama, Georgia, and the South Carolina. During the past 60-day period, precipitation has been below normal (1-to-7-inch deficits) across most of the region with exception of portions of Florida. On this week’s map, areas of Abnormally Dry (D0), Moderate Drought (D1), and Severe Drought (D2) expanded in South Carolina in response to numerous rivers and streams dipping below the 15th percentile, according to the U.S. Geological Survey (USGS). Additionally, the NASA Crop-CASMA soil moisture and vegetation index application is showing significant negative soil moisture anomalies-particularly in South Carolina’s coastal plains region. Areas of Abnormally Dry (D0) were introduced in Georgia, Florida, and Alabama.
South
For the week, the region was mainly dry with average temperatures that were well above normal (6 to 15 deg F). Some light precipitation (1 to 2 inches) was observed in areas of central Louisiana, Mississippi, and western Tennessee. On the map, conditions degraded across much of the region including Texas, Oklahoma, Louisiana, and Arkansas where areas of Moderate Drought (D1) and Severe Drought (D2) expanded in response to persistent warm and dry conditions. In the western portions of Oklahoma and Texas, the NASA Crop-CASMA application is showing significant negative soil moisture anomalies this month. In the Rolling Plains of Texas, some drought-related impacts have been reported, including reports of winter wheat crops continuing to struggle due to the lack of moisture.
Midwest
On this week’s map, only minor changes were made on the map in Missouri where precipitation has been below normal during the past 90-day period. Light precipitation accumulations were observed this week in the greater Ohio River Basin (1 to 2 inches) as well as in the northern portions of the Midwest where locally heavy snowfall amounts were observed. According to NOAA NOHRSC, 67% of the Northern Great Lakes region was covered by snow with an average depth of 3.8 inches and a maximum depth of 19.5 inches on December 8. Average temperatures for the week were mainly above normal with the largest anomalies observed in the southern and western portions of the region, where temperatures were 6 to 12+ degrees above normal.
High Plains
En el mapa de esta semana, solo se realizaron cambios menores en el mapa de Missouri, donde la precipitación ha estado por debajo de lo normal durante los últimos 90 días. Esta semana se observaron ligeras acumulaciones de precipitación en la gran cuenca del río Ohio (de 1 a 2 pulgadas), así como en las porciones del norte del Medio Oeste, donde se observaron cantidades de nevadas intensas a nivel local. Según NOAA NOHRSC, el 67% de la región de los Grandes Lagos del Norte estaba cubierta por nieve con una profundidad promedio de 3.8 pulgadas y una profundidad máxima de 19.5 pulgadas el 8 de diciembre. Las temperaturas promedio de la semana estuvieron principalmente por encima de lo normal con las anomalías más grandes observadas en las porciones sur y oeste de la región, donde las temperaturas estaban entre 6 y 12 grados por encima de lo normal.
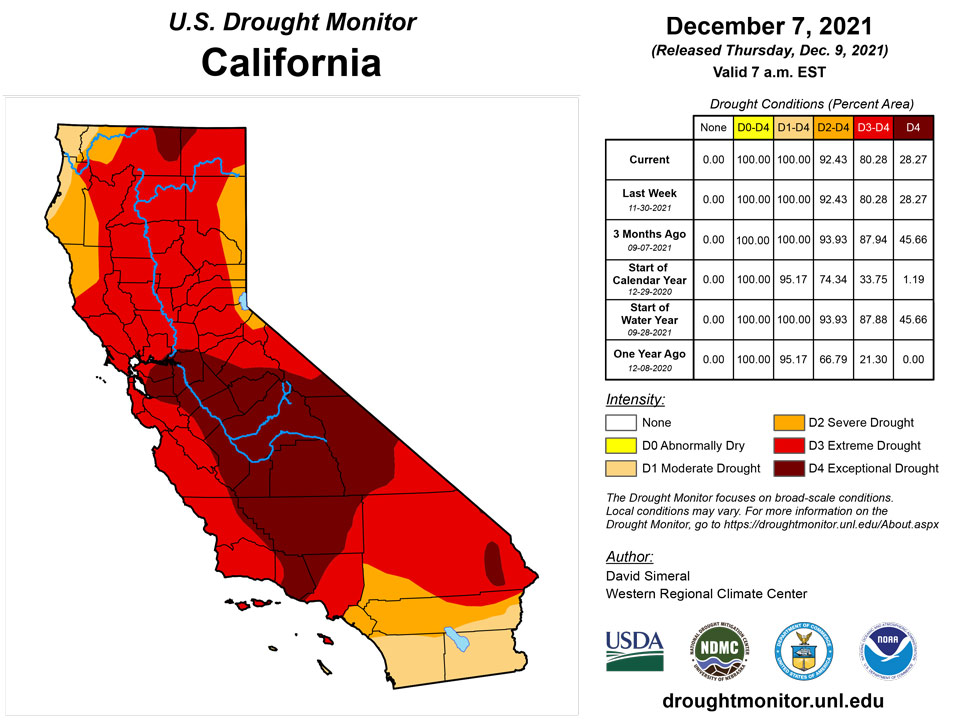
West
In the West, the big story continues to be the poor snowpack conditions across the region and growing concern about water supplies after back-to-back dry winter seasons in California as well as in other basins including the Colorado River Basin. In California, the Department of Water Resources announced (December 1) that the State Water Project’s initial water allocation for 2022 will be at 0% in an unprecedented step to address the state’s water supply in anticipation of another dry winter season. Other impacts of concern across the region include the delayed opening of ski areas across the region which is impacting local economies in mountain communities across the West. However, some positive signs have emerged over the past week and looking ahead in the short-term with a change to a more active weather pattern for the region with heavy mountain snowfall expected in the Cascades, Sierra Nevada, Great Basin, and the Rockies. On the map this week, recent precipitation in the Pacific Northwest led to improvements in drought-affected areas of Washington as well as in northeastern Oregon, and west-central Idaho. Conversely, an area of Extreme Drought (D3) expanded in southwestern Montana due to poor snowpack conditions in the higher elevations.
Caribbean
In Puerto Rico, areas of Abnormally Dry (D0) and Moderate Drought (D1) expanded on the map this week in response to precipitation shortfalls during the past 30–60-day period with deficits ranging from 4-to-12 inches. Additionally, numerous USGS stream gauges across the island were reporting streamflows falling below the 10th percentile as well as satellite-based soil moisture measurements showing below-normal levels.
Drought intensified throughout the Virgin Islands last week, and each site was intensified by 1 category from the prior week. St. Croix is now mired in D3 (extreme) drought, while farther north, St. Thomas deteriorated to D2 and St. John’s moved into moderate drought (D1). Conditions have been acutely dry since mid-August - a period of about 3.5 months – St. Thomas reported only 8.89 inches of rain, which is over 13.5 inches below normal (40 percent of normal). Meanwhile, St. Croix recorded 7.44 inches of rain during this period, which is 10.30 inches below normal (42 percent of normal). These totals are at or near the all-time record lows for the period. For the month of November, 2.08 inches dampened St. Thomas while only 1 inch fell on St. Croix. Conditions have been a bit wetter in St. John, buoyed by a much wetter October than the other sites (9.33 inches). But despite this, with a November total of 1.72 inches, rainfall since mid-August totals 11.53 inches there, which is several inches below normal.
In addition, longer-term moisture deficits have slowly increased in St. Croix and St. Thomas. In St. Thomas, 13 of the last 16 months had below-normal rainfall, and there’ve been 13 consecutive months with subnormal precipitation in St. Croix.
The drier-than-usual air has allowed temperatures to reach unprecedented levels for December. On St. Croix, during 1951-2020, temperatures reached 90 deg F. on just 4 days between 1963 and 1998. This year, 4 of the first 5 days in December reached at least 90 deg. F. So the first five days of December 2021 had the number of days reach 90 deg. F (4) as the previous 70 years combined.
Pacific
In the Hawaiian Islands, a Kona Low event brought very heavy rainfall and flooding to areas of the island chain. In Oahu, 7.92 inches of rain fell at the Honolulu Airport on December 6, making it the second highest single-day rainfall total on record. In Maui, rainfall totals ranged from 2 to 10 inches while on the Big Island the Nene Cabin weather station (Hawaii Volcanoes National Park, southwest flank of Mauna Loa) logged 14.53 inches from December 4-7. In Molokai, the Puu Alii weather station in Kalaupapa National Historical Park observed 14.48 inches between December 3-6. Rainfall from the multi-day storm event is expected to provide significant drought-relief across areas of the island chain. Improvements on the map are imminent next week once the storm event has concluded, storm rainfall totals have been tabulated, and impacts assessed.
For Alaska, no changes were made on the map this week as the state continued to be drought-free.
With one dramatic exception, the U.S. Affiliated Pacific Islands are not stressed by dryness or drought at this time, although a few locations have reported somewhat subnormal rainfall for a few months. In these locations, rainfall has been sufficient to meet water demands.
The one exception is Kapingamarangi, which is farther south than other locations in Micronesia. November rain totaled only 2.66 inches, or about one-third of normal. Moisture deficits started accruing around May 2020. In the 11 months through March 2021, 47.67 inches of rain was recorded, which was only 41% of normal (116.28 inches). Rainfall increased during April – July 2021, and impacts began to ease. It seemed the worst of the drought had passed. About 60 inches fell during this 4-month period, which is 10 inches more than normal and about 10 inches more than fell during the previous 11 months. But beginning in August 2021, the pattern of deficient rainfall returned. August – November 2021 brought just 13.36” of rain, or just over 36 percent of normal (37.57 inches). Early December brought some light to moderate rainfall, but one week of rainfall will not affect the evolution of a drought that dates back more than a year and a half. Looking at the big picture, 121 inches of rain fell during the past 19 months, which is more than 80 inches below normal (203.39 inches). Multiple governmental and non-governmental agencies continue working to increase water storage capacity, and shipping in water as possible to manage the ongoing shortages.
Elsewhere, conditions are far less remarkable. Even in the scattered islands where some degree of subnormal rainfall has prevailed for a few months, rainfall has been sufficient to meet water demand.
In the Republic of Palau, November brought 7.95 inches of rain to Koror, or about 66 percent of normal. However, this amount is sufficient to meet water needs, and in prior months, a significant surplus accumulated. September – October 2021 brought almost 47 inches of rain where the normal is just over 24 inches. And while Kapingamarangi endured a protracted 19-month (and counting) drought, Palau accumulated a surplus of 37 inches (above normal).
In the Mariana Islands, Guam reported 9.87 inches of rain in November – about 67 percent of normal. But as in Palau, the subnormal amount was more than sufficient to meet water demand, especially considering earlier above-normal rainfall. August – October dumped almost 54 inches of rain on Guam, which is more than 10 inches above normal. October was particularly wet, with 27 inches of rain reported.
While the southern reaches of Micronesia (primarily on Kapingamarangi) endure severe long-term moisture deficits, areas farther north are not experiencing any effects from dry weather. In western Micronesia, Yap recorded 5.68 inches of rain, which is considerably below the normal of 9.09 inches, but still sufficient to meet water demands. Most of the previous several months were similar, with marginally below-normal rainfall that nevertheless has been enough to meet water needs. Going back further, November - April is usually a drier time of the year. But in 2020-2021, reported over 80 inches for the 6-month period – dramatically above the normal of under 43 inches.
Farther east, in central Micronesia, dryness has not been an issue in Chuuk, Lukunor, nor Nukuoro. November brought above-normal rains (11.8 to 13.2 inches) to these areas. Over the prior several months, Lukunor had experienced consistently below-normal rainfall. On average, July – October drops over 52 inches of rain there, but only 32 inches fell in 2021. However, 32 inches still amounts to an average of over 8 inches total per month, which is enough to meet water needs there. And since November, rainfall has been, amounting to about 13 inches of rain during November (about 130 percent of normal) and about 6 more inches through the first week of December.
In eastern Micronesia, November 2021 was abundantly wet. Pohnpei reported over 25 inches of rain, approaching twice normal. This more than mitigated the mild deficits reported for July – October.
In a pattern similar to many other islands, November brought surplus precipitation to western parts of the Marshall Islands following several months that were drier than normal, but still enough to meet water demand. Kwajalein reported 14.47 inches of rain in November, which was the wettest month there since October 2020. Rainfall slackened the first week of December, with only 1.26 inches of rain reported, but it would take many more dry months to bring about any impacts from deficient precipitation.
November precipitation was variable in the eastern Marshall Islands. Wotje reported 9.25 inches of rain while over 17 inches doused Majuro. Generally near- to above-normal rainfall has prevailed for over a year across the region, squelching any possible impacts from rainfall deficits.
In American Samoa, September – October 2021 were unusually dry. Just 7.71 inches of rain fell, which is only about 45 percent of normal. But rainfall picked up in November, with 12.6 inches of rain (nominally above normal). Rainfall continued at a decent clip the first week of December, when Pago Pago recorded another 2.37 inches. Any potential impacts from the September-October dryness were more than mitigated by rainfall during the prior summer and over the most recent 6 weeks or so.
Looking Ahead
The NWS WPC 7-Day Quantitative Precipitation Forecast (QPF) calls for moderate-to-heavy precipitation accumulations ranging from 2 to 7 inches (liquid) in much of the Far West including the coastal ranges of California and Oregon as well as coastal areas of western Washington. Similar accumulations are forecasted in the Sierra Nevada Range and Cascades of Oregon and Washington. In the Great Basin and Intermountain West, accumulations of 1-to-3-inches (liquid) are expected across the Rockies with the heaviest accumulations forecasted for the mountain ranges of southwestern Utah and western Colorado. In the Central Plains and Upper Midwest, liquid accumulations of generally < 1 inch are expected. In the Eastern Tier, light-to-moderate accumulations of 1 to 2 inches are expected in northern portions of Alabama and Georgia and eastern Tennessee. In the Northeast, light precipitation accumulations of < 1 inch are expected, while much of the Mid-Atlantic and Southeast are forecasted to have generally dry conditions. The CPC 6-10-day Outlooks calls for a moderate-to-high probability of above-normal temperatures across most of the conterminous United States except for areas of the Great Basin and Far West where below normal to near-normal temperatures are expected. In terms of precipitation, there is a moderate-to-high probability of above-normal precipitation across most of the western U.S. as well as portions of the Midwest and eastern portions of the Southern Plains. The Eastern Tier of the U.S. is expected to be drier-than-normal.
Author(s):
David Simeral, Western Regional Climate Center
Richard Tinker, NOAA/NWS/NCEP/CPC
Dryness Categories
D0 Abnormally Dry—used for areas showing dryness but not yet in drought, or for areas recovering from drought.
Drought Intensity Categories
D1 Moderate Drought
D2 Severe Drought
D3 Extreme Drought
D4 Exceptional Drought
Drought or Dryness Types
S Short-term, typically less than 6 months (agriculture, grasslands)
L Long-term, typically more than 6 months (hydrology, ecology)
SL Area contains both short- and long-term impacts
Source: National Drought Mitigation Center
