


California and National Drought Summary for March 15, 2022
Summary
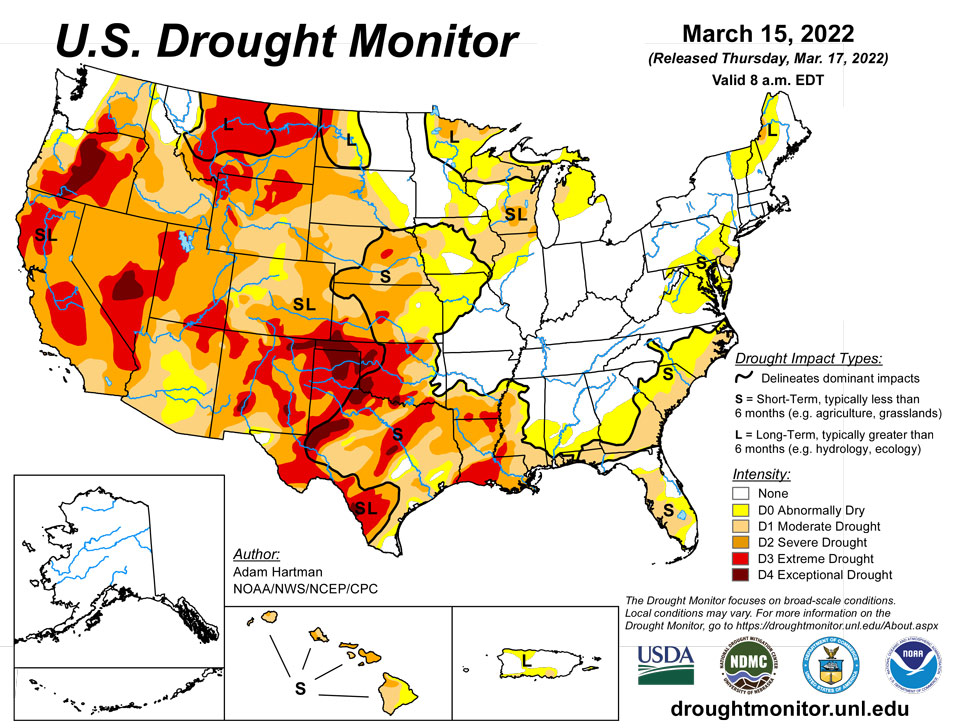
March 17, 2022 - High pressure dominated across much of the central U.S. this week, bringing much below-normal temperatures (more than 10°F below-normal) to the Eastern Rockies, Great Plains, and parts of the Mississippi Valley. Much of the north-central U.S. remained below freezing last week. However, where daytime high temperatures did average above the freezing mark, below-normal precipitation and high winds resulted in some drought degradation across parts of the Great Plains. A series of low pressure systems moving across the southern and eastern U.S throughout this week brought heavy rainfall to parts of the Gulf Coast states and Eastern Seaboard, leading to drought improvements. Northern Florida received the greatest rainfall amounts, with several areas picking up anywhere from 5 to 10 inches of rain through Saturday. The strongest of these storm systems also brought snowfall to the Appalachians and interior areas of the Mid-Atlantic and Northeast Friday into Saturday. In the Pacific Northwest, a series of storms brought some drought improvements to parts of the central Cascades and interior northern Rockies. Farther south across California, drought intensified this week due to mounting deficits since the beginning of the year.
Northeast
Drought conditions have been slow to improve over the last few months in New England. However, a strong storm system over the weekend brought heavy coastal rainfall and inland snowfall across the Mid-Atlantic and Northeast. Precipitation amounts along the Mid-Atlantic coast, although above-normal for many areas, did not immediately improve soil moisture and stream flows in areas experiencing abnormal dryness (D0) and moderate drought (D1) conditions. However, groundwater indicators and stream flows have slowly improved across interior parts of New England in recent months, leading to some trimming of moderate (D1) and severe (D2) drought areas in Maine and northern New Hampshire. From southern Pennsylvania to eastern West Virginia, D0 was expanded where average stream flows have fallen below-normal, supported by increasing soil moisture deficits driven by short-term precipitation deficits (1 to 3 inches below-normal over the past 60 days).
Southeast
A stalled frontal boundary earlier this past week (March 8 to 10) resulted in heavy rainfall across northern Florida. During the weekend, a strong low pressure system dropped more heavy rainfall across many of these same areas, before moving northeastward along the Eastern Seaboard. Anywhere from 5 to 10 inches of rain fell from the Big Bend to the northeastern coast of Florida, leading to widespread 1 to 2-category improvements where rainfall amounts eliminated short-term 30 to 90 day rainfall deficits, improving USGS weekly and monthly average stream flows to near and above-normal, and improving soil moisture to near-normal and above-normal. Improvements to abnormally dry (D0) areas in the upstate areas of the Carolinas and in the Tidewater of Virginia also saw improvements where the heaviest rains fell, reducing short-term deficits. Conversely, portions of southern Georgia experienced some moderate drought (D1) expansion where the heavier precipitation did not fall, exacerbating short-term rainfall deficits (2 to 4 inch year-to-date deficits, and locally greater), soil moisture deficits (D1 to D2 equivalent down to 200 cm), and further reducing stream flows (USGS 7-day average stream flows falling well below the 24th percentile).
South
A series of low pressure systems, tracking across the Gulf Coast states throughout this week, resulted in heavy rainfall across parts of eastern Texas and the Lower Mississippi Valley, leading to broad 1-category improvements where the heaviest rains fell. Some parts of central Louisiana and west-central Mississippi received more than 5 inches of rainfall. Despite year-to-date rainfall deficits being reduced to near zero for several locations and USGS average stream flow running near-normal, soil moisture still ranks between the 5th and 10th percentile of the climatological distribution. This indicates that drought is still firmly entrenched across the Lower Mississippi Valley and that more rainfall will be needed to continue to see meaningful improvements. Farther west across central Texas and parts of Oklahoma, drought continued to intensify. Conversely, high winds and below-normal precipitation prevailed across central Texas and western Oklahoma this week, leading to continued drought degradation. Fire risk remains a concern across many of these areas.
Midwest
Areas experiencing daytime high temperatures above freezing saw targeted changes to their drought status. In western Iowa, moderate drought (D1) was expanded a bit where standardized precipitation indices (SPIs) depict severe drought (D2) or worse conditions going back 90 days and seasonal snowpack is lacking. Some small D1 removal was observed near the Twin Cities, where snow cover has been enough to seep into the top soils in recent weeks, as the ground begins to thaw, corroborated by NASA SPoRT soil moisture data. D1 removal was also warranted for parts of northern Wisconsin in areas that have seen 1 to 2 inch surpluses of precipitation for the water year (since October 1, 2021). Although soil moisture is lagging a bit, decent snow water equivalent values are present across much of the region. Unfortunately, the lack of seasonal snow cover is a real concern for several areas farther southward as spring approaches and the ground begins to thaw, as the soils will then become more susceptible to fluctuating temperatures and increased moisture demand as vegetation comes out of dormancy.
High Plains
Although the High Plains region experienced widespread much below-normal temperatures this week (10°F to 15°F below-normal; even exceeding 15°F below-normal in the High Plains and Eastern Rockies), several areas saw continued deterioration of drought conditions. This was particularly true across parts eastern Nebraska and central Kansas, where high winds and below-normal 7-day precipitation only exacerbated ongoing short-term dryness brought about by a very dry winter season. Several of these areas have received only 5 to 20 percent of normal precipitation over the past 120 days and the fire risk has rapidly increased as a result. Shallow soil moisture is ranking below the 5th percentile of the climatological distribution, according to NASA SPoRT, and average stream flows are continuing to decline. Parts of southeastern Colorado, which is experiencing short to long-term drought, also experienced degradation this week from severe (D2) to extreme (D3) drought, supported by Keetch-Byram Drought Indices and short-term precipitation deficits (25 to 50 percent of normal precipitation over the past 90 days). Parts of northwestern Wyoming also experienced deteriorating drought conditions, due to depleted groundwater and year-to-date precipitation deficits that are now on the order of 5 to 10 inches. Conversely, there were targeted improvements across central Wyoming and northern Colorado, based on where positive weekly precipitation anomalies were observed, precipitation amounts are above-normal for the water year (since October 1, 2021), and NASA SPoRT soil moisture and USGS 7-day average stream flows are near and above-normal locally.
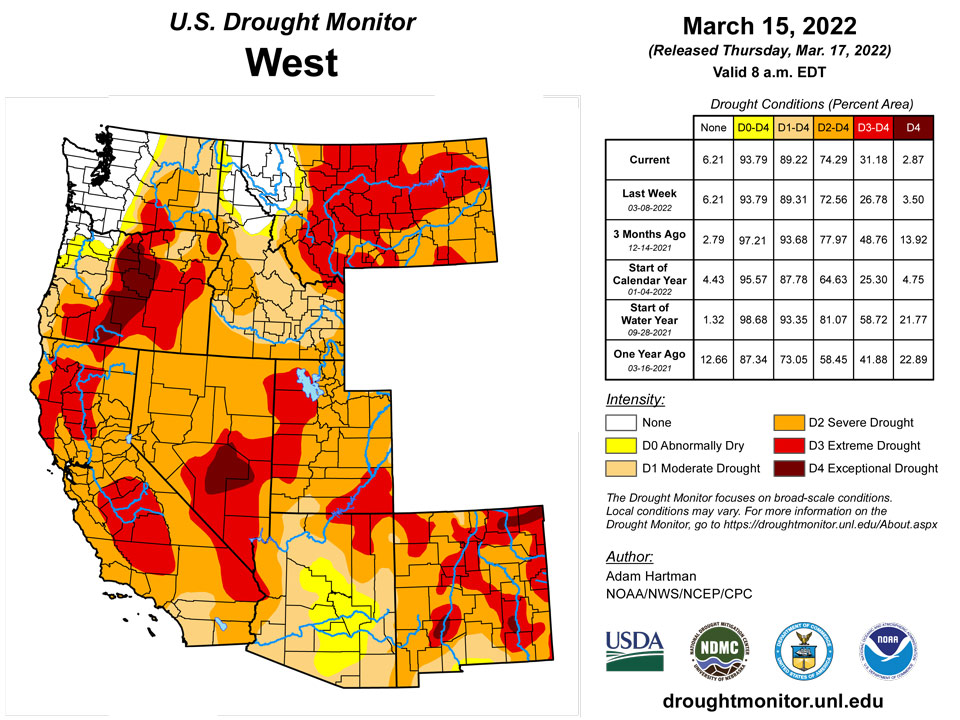
West
Following a very wet December 2021 (in some cases a record wet December) for many areas in the West, a very dry pattern has persisted since the start of 2022, mainly from southern Oregon southward. Average snow water equivalent (SWE) values have continued to decline across many basins in the West and are now below-normal since the start of the water year (October 1, 2021). Despite, the drying trend leading up to this week across many areas, a stormy pattern brought above-normal precipitation to parts of the Pacific Northwest and Northern Rockies this week, leading to targeted improvements in the central Cascades, northeastern Oregon, and central Montana, where short-term SPEIs and average stream flows are improving, basin SWE values are near 100% of normal, and precipitation is above-normal for the water year. Conversely, farther south in California, widespread deterioration was warranted across parts of the San Joaquin and Sacramento Valleys and the Central Coast. Many of these areas have experienced record dryness since the start of 2022, which has driven some reservoirs to record low levels and resulted in widespread stream flows and soil moisture ranking below the 2nd percentile. Water availability is a real concern as allocation from the Central Valley Project is likely to be either much reduced or non-existent for many farmers in California’s Central Valley, according to the U.S. Bureau of Reclamation.
Caribbean
Above-normal precipitation this week resulted in a targeted area of removal of long-term abnormal dryness (D0) in Guayanilla and Penuelas Counties in Puerto Rico. Precipitation totals across all time periods going back 180 days are above-normal and stream flows in the area are running well above-normal.
The U.S. Virgin Islands have experienced a wetter-than-normal dry season, especially since early February. In fact, the territory’s overall drought intensity peaked on February 1, with extreme drought (D3) reported on St. Croix and St. Thomas, and severe drought (D2) on St. John. Since early February, there have been one-category improvements on St. Croix (to D2) and St. John (to D1). On St. Thomas, D3 persisted though March 1, but a change to D2 was introduced this week, as heavier-than-normal showers continued. At King Airport on St. Thomas, March 1-15 rainfall totaled 1.90 inches (229% of normal). From February 1 – March 15, King Airport’s rainfall reached 5.19 inches (190% of normal). Notably, measurable rain fell on 12 of the first 15 days of March at King Airport, which is greater than the long-term mean of 11 days for the entire month.
During the first half of March, volunteer (CoCoRaHS) observers reported rainfall ranging from 1.08 to 1.59 inches on St. John; 1.67 to 2.38 inches on St. Thomas; and 1.44 to 2.79 inches on St. Croix. Those totals were mostly above normal. Interestingly, Rohlsen Airport on St. Croix was drier than any of the CoCoRaHS sites, with March 1-15 rainfall of just 0.59 inch (82% of normal). Although showers have been frequently observed throughout the U.S. Virgin Islands in recent weeks, amounts have been generally light. Additional spring rainfall will be needed to sustain the recovery that has begun—and to improve subsoil moisture reserves.
Indeed, a complicating factor in recent drought recovery has been lingering low groundwater levels, as reported by three U.S. Geological Survey wells – one on each major island. At the Adventure 28 Well on St. Croix, for example, depth to water exceeded 30.85 feet on March 15—the greatest since the site was recommissioned in late 2016. (A previous incarnation of that St. Croix well site showed greater depths to water on several occasions in the 1980s and early to mid-1990s, with values twice briefly topping 40 feet.) Meanwhile on St. John, depth to water at the Susannaberg DPW 3 Well exceeded 18.65 feet on March 15. If depth to water at that St. John well site were to continue increasing, it is worth noting the last time the depth exceeded 19 feet was August 8, 2017.
Pacific
Alaska remains drought-free this week. Despite temperatures running well above-normal in recent weeks, snowpack is still well above-normal and in some cases at record high levels.
In Hawaii, drought deterioration (i.e. the expansion of abnormally dry to severe drought conditions) was warranted on western Oahu, Molokai, Maui, southeastern Lanai, and across parts of the Big Island. This week saw below-normal precipitation and above-normal temperatures, which is atypical considering the ongoing La Nina conditions and this being a climatologically wet time of year. USGS 7-day average stream flows are running below the 5th percentile for many locations and some locations seeing Vegetation Health Indices declining into extreme to exceptional (D3 to D4) drought territory. In Maui, the Department of Water Supply has asked the public to reduce water consumption due to the low stream flows. In addition, ecological anomalies have also been observed, such as animal encroachments, due to lack of soil moisture leading to reduced forage.
The Republic of Palau continued to receive ample rain and remains free of dryness. During the first half of March, rainfall at the National Weather Service observation site in Koror totaled 6.10 inches. For the drought-monitoring period, 7-day rainfall exceeded 2 inches in Koror and at Palau International Airport.
For Guam, the depiction was changed from abnormal dryness (D0-S) to moderate drought (D1-S), due to ongoing drier-than-normal conditions. From March 1-15, rainfall at Guam International Airport totaled just 0.62 inch (43% of normal). At the Guam airport site, rainfall has totaled less than an inch for 7 consecutive weeks, with less than one-half inch occurring in 6 of 7 weeks. According to the National Weather Service, the Keetch-Byram Drought Index (KBDI) on Guam rose to 697 by the morning of March 16, indicative of a high fire danger. Elsewhere in the Mariana Islands, rainfall provided enough moisture to prevent further deterioration, leaving D0-S intact for Rota and Saipan. On Saipan, 7-day rainfall ranged from 1.64 inches at a National Park Service site to 2.36 inches at the international airport.
Soaking showers occurred on several previously dry islands in the Federated States of Micronesia (FSM), while other areas continued to receive rain. Rainfall during the drought-monitoring period brought one-category improvements for Chuuk Lagoon (from D1-S to D0-S) and Woleai (from D0-S to being free of dryness). In fact, 7-day totals reached 5.87 inches for Chuuk Lagoon and 3.81 inches for Woleai. Meanwhile, Fananu was listed as missing, since insufficient data was available for an adequate drought assessment. The remainder of the FSM was free of dryness and drought, with 1- to 5-inch weekly rainfall totals common at most reporting sites.
Significant rain fell across much of the Republic of the Marshall Islands. From March 9-15, Kwajalein received 2.22 inches of rain, boosting its month-to-date total to 6.38 inches. Kwajalein’s characterization was changed from moderate drought (D1-S) to abnormal dryness (D0-S), although remote western areas, such as Ebadon and Mejatto, may still be experiencing some drought-related impacts. Meanwhile, D0-S was retained for Ailinglapalap and Majuro, despite recent beneficial rainfall. Farther north, Wotje received its heaviest rain of the year, with a weekly sum of 1.80 inches. An observer on Wotje reported that residents continue to obtain water from the large concrete water tank at the island’s church, which has been the case since December 2021. With the recent rain, Wotje’s residents were able to clean their catchments and roofs, while some were able to collect water. Groundwater has been used to keep Wotje’s crops alive and productive during the drought, though vegetation remains significantly stressed.
Atypically hot weather has developed in recent weeks across American Samoa, although frequent showers have prevented the development of abnormal dryness. More than an inch of rain fell during the drought-monitoring period at Pago Pago International Airport and the National Park Service sites at Siufaga Ridge and Toa Ridge. Still, the airport observation site reported 18 consecutive days (February 26 – March 15) with a maximum temperature of 90°F or greater, including the hottest day (94°F on March 7) in more than 6 years. The last time the airport had a longer streak of 90-degree days was 20 years ago; there were 23 consecutive days with highs of 90°F or greater from February 20 – March 14, 2002.
Looking Ahead
A storm system will exit the Rockies Thursday, bringing the potential for snowfall to the Eastern Rockies and Front Range. This system is forecast to intensify and move eastward across the lower 48, bringing an increased potential for precipitation of various types to many areas across the eastern U.S. before exiting the Eastern Seaboard by late Sunday into early Monday. As this system exits the eastern U.S., another low pressure system is forecast to track across the western U.S. and intensify over the Great Plains leading up to Tuesday. In the West, much of the heavier precipitation is forecast across parts of the Pacific Northwest, associated with the storm system later in the week. There are also increased chances of precipitation and high elevation snowfall across much of the West as this system tracks across the Rockies. The heaviest 7-day precipitation amounts are likely to be focused across parts of the Central and Southern Plains eastward to the Middle and Lower Mississippi Valley, with amounts accumulating from both storm systems.
The Climate Prediction Center’s 6-10 day outlook (valid March 22-26, 2022) favors above-normal temperatures across much of the western and eastern contiguous U.S. (CONUS) and the Northern Plains. In the central CONUS, near and below-normal temperatures are forecast for many locations, associated with a mean trough of low pressure. Below-normal precipitation is favored for much of the western third of the CONUS, underneath a mean ridge of high pressure. Conversely, above-normal precipitation is favored for the eastern two-thirds of the CONUS, associated with mean southerly flow from the Gulf of Mexico enhancing precipitation chances, particularly across the Southeast.
Author(s):
Adam Hartman, NOAA/NWS/NCEP/CPC
Brad Rippey, U.S. Department of Agriculture
Dryness Categories
D0 Abnormally Dry—used for areas showing dryness but not yet in drought, or for areas recovering from drought.
Drought Intensity Categories
D1 Moderate Drought
D2 Severe Drought
D3 Extreme Drought
D4 Exceptional Drought
Drought or Dryness Types
S Short-term, typically less than 6 months (agriculture, grasslands)
L Long-term, typically more than 6 months (hydrology, ecology)
SL Area contains both short- and long-term impacts
Source: National Drought Mitigation Center
