


California and National Drought Summary for March 22, 2022
Summary
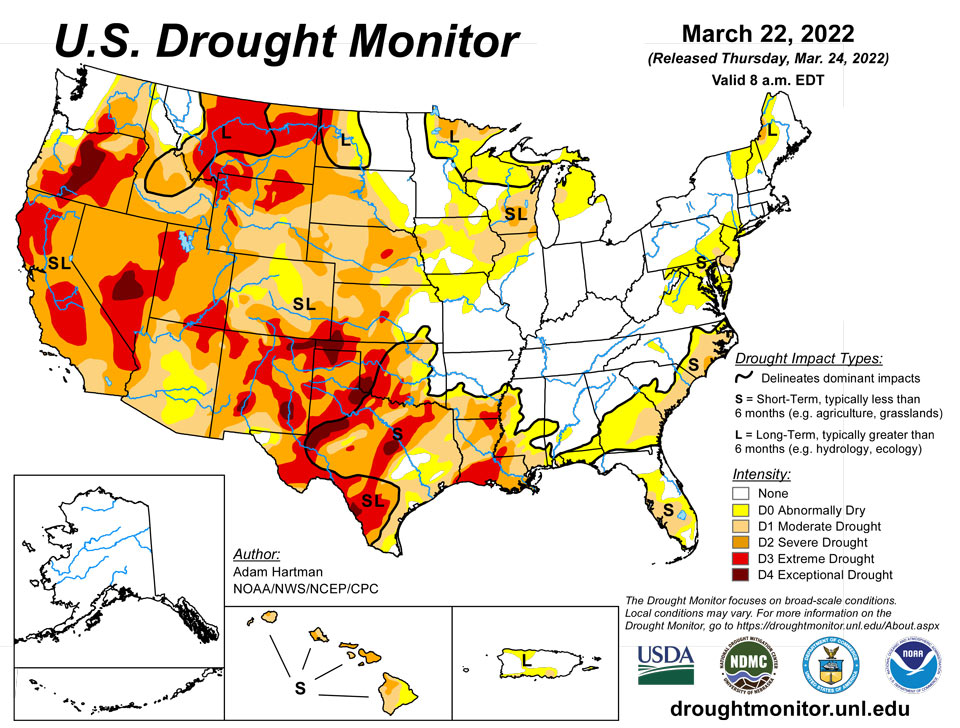
March 24, 2022 - A series of storm systems moved across the lower 48 states this past week. Heavy rain fell across parts of the Great Plains and Southeast, with lighter amounts observed across parts of the Pacific Northwest and Intermountain West. The Central and Southern Plains, Lower Mississippi Valley, and Southeast mostly saw improvements to drought conditions, with several locations receiving more than 2 inches of rainfall (more than 5 inches, locally) during the 7 days leading up to March 22. Throughout much of the U.S., where antecedent dryness coincided with below-normal precipitation, drought either continued or worsened in intensity. The only areas where this was not true was across parts of the Upper Midwest, which experienced some removal of long-term drought due to improvements from melting snow cover.
Northeast
Long-term drought has been slow to improve over the last few months in New England. Some trimming of abnormal dryness (D0) was warranted in northern Maine where precipitation was slightly above-normal this past week and adequate snow water equivalent (SWE) is in place. USGS stream flows are also averaging near and above-normal going back one month across much of New England. The only other area of improvement was east of Washington D.C. (D0 removal), where rainfall totals were above-normal locally, eliminating short-term precipitation deficits. Elsewhere in the Mid-Atlantic, expansion of D0 and moderate drought (D1) was warranted where rainfall was sub-normal and average temperatures were running 10°F or more above-normal. In addition, widespread average stream flows were below-normal (below the 24th percentile of the climatological distribution) and well below-normal (below the 10th percentile) in areas depicted as D0 and D1, respectively. Soil moisture also continued to decline this week, due to the warm temperatures and more vegetation beginning to come out of dormancy, increasing the moisture demand.
Southeast
The passage of a couple of storm systems resulted in above-normal 7-day rainfall totals across much of the Southeast. Locally, more than 5 inches of rain fell across parts of southern Georgia, southern Alabama, and northern Florida, leading to another round of improvements this week and removing moderate drought (D1) entirely out of the Florida Panhandle. Abnormal dryness in southwestern Georgia remains, despite widespread positive rainfall anomalies of 1 inch or greater. 30 to 60 day standardized precipitation indices (SPIs) indicate D1 or worse conditions across some of these areas, with 90-day rainfall deficits upwards of 5 inches. The recent storm systems have markedly improved the soil moisture and stream flows region-wide. However, some 28-day average stream flows are still running below-normal, indicative of those compounded deficits leading up last week, and hence the D0 remaining firmly in place this week. There was mixed improvement and deterioration in the Florida Peninsula, based on 7-day precipitation totals and short-term (60 to 90 day) percent of normal precipitation. This was also true across the Carolinas and central Virginia. Much of the heaviest rain fell across the upper Coast Plain and Piedmont areas, resulting in improvements to some areas experiencing D0 and D1 conditions. However, along the Coast Plain of North Carolina, more deterioration was warranted (D1 expansion and D2 introduction). Severe drought (D2) was introduced into southern North Carolina, where USGS 28-day average stream flows are around the bottom 1 percent of the climatological distribution, 30 and 60 day SPIs are D3-equivalent or worse (indicating extreme drought conditions), and precipitation is 25 to 50 percent of normal over the past 3 to 6 months.
South
Two storm systems brought heavy rainfall across much of the Southern Region this past week. The first system dropped heavy rain across parts of central Louisiana and much of Mississippi before moving eastward very early in the period (March 15-16). The second storm system intensified over the Southern and Central Plains in the final day leading up to March 22, dropping heavy rain across central and eastern Oklahoma and northern and eastern Texas, extending eastward to the Mississippi River. Rainfall totals across many of these areas exceeded 2 inches, leading to large swaths of 1-category improvements in the drought depiction. 2-category improvements were also warranted in isolated locations receiving, in some cases, more than 5 inches of rain. Given the short-term nature of the drought, soil moisture indicators and stream flows responded quickly, leading to more aggressive improvements in eastern Oklahoma, eastern Texas, and the Ark-La-Tex. Farther west and south in Texas, many locations missed out entirely, receiving little to no precipitation this past week. This increased rainfall deficits that go back several months, resulting in the continued deterioration of drought across these areas.
Midwest
Abnormal dryness (D0) and moderate drought (D1) was reduced in coverage across parts of southwestern Iowa and northern Missouri this past week. A storm system that intensified over the Central and Southern Plains March 21-22 brought more than 2 inches of rain to these areas, reducing short-term (30 to 90 day) precipitation deficits. Moderately heavy rainfall also extended into portions of the central Corn Belt. However, despite many locations receiving upwards of 0.5 to 1 inch of above-normal rainfall, long-term drought is firmly entrenched in these areas, leading to a status quo depiction this week. Farther north across parts of northern Wisconsin and northern Michigan, a mix of snowmelt and 7-day precipitation totals led to some removal of D1, as root zone soil moisture and groundwater are beginning to recover, in addition to near and above-normal average stream flows. Conversely, D1 remains in adjacent areas in northwestern and northeastern Wisconsin, extending into the south-central Upper Peninsula of Michigan, where deeper soil moisture and groundwater indicators are recovering more slowly. Elsewhere in the Midwest, conditions are near or wetter than normal, leading to much of the southern Great Lakes and eastern Corn Belt remaining drought-free.
High Plains
Associated with a storm system intensifying and moving slowly northeastward from the Central Plains March 21-22, heavy rainfall was observed across much of central and eastern Kansas, southeastern Nebraska, and eastern Colorado. Rainfall in excess of 1.5 inches resulted in 1-category improvements across many of these areas. However, improvements were less widespread for some locations in central Kansas and southeastern Nebraska, as longer-term deficits remain intact. Additionally, soil moisture still remains D2-equivalent (indicating severe drought conditions) or worse across many areas, region-wide stream flows are running near and below normal, and standardized precipitation indices (SPIs) are D2-equivalent or worse for all periods between 60 and 120 days. Farther north across western North Dakota and southern South Dakota, the lack of seasonal snow cover, above-normal temperatures this past week (10 °F to 15°F above-normal), and high winds resulted in the expansion of extreme (D3) and severe (D2) drought, respectively. Reports from western North Dakota indicate rangeland conditions are worse than this time last year. Groundwater and root zone soil moisture is very low and watering holes are dried up, supported by NASA GRACE groundwater and NASA SPoRT 0-100 cm soil moisture indicators. In southern North Dakota, shallower soil depths (0-40 cm) have dried out further this past week due to above-normal temperatures and high winds. Additionally, SPIs are at D2-equivalent or worse for all periods going back 120 days. Locals continue to be concerned about the antecedent dryness leading up to the spring. Water availability, forage for feed, and livestock are all at risk if the rains do not come during the spring and summer months, as the Northern Plains begins transitioning into a climatologically wetter time of year in April.
West
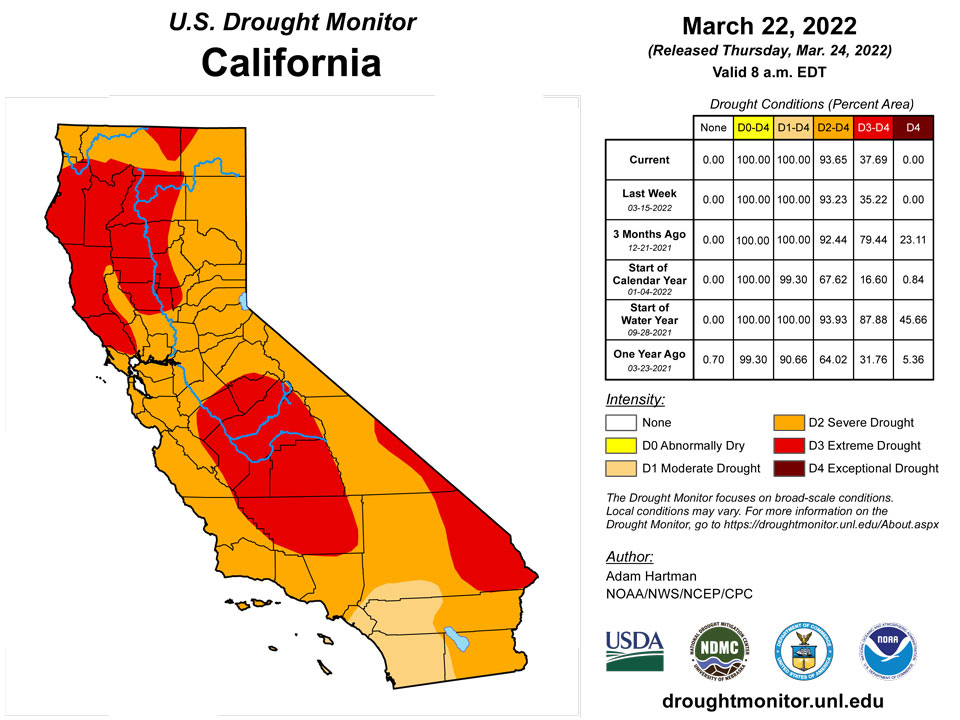
Following a very wet December 2021 across parts of the West, a very dry pattern has persisted during much of 2022 so far, mainly from southern Oregon southward. Average basin snow water equivalent (SWE) values have continued to decline across the West and are now below-normal since the start of the water year (October 1, 2021). Despite the drying trend leading up to this week across many areas of the region, a stormy pattern brought above-normal precipitation to the windward (west-facing) slopes of Washington, with some additions to the snowpack. Snowpack gains were also evident across parts of the Northern Rockies. Given the smalls gains made over the past couple of weeks, targeted improvements were made across northern Oregon, northern Idaho, and western Montana. Additionally, sub-basin average SWE values are near and slightly above-normal for the water year, USGS average stream flows are running near and above-normal, and standardized precipitation evapotranspiration indices (SPEIs) are D0 to D1 equivalent (indicating abnormally dry to moderate drought conditions) for all periods going back 6 months. However, longer-term drought remains entrenched across much of the West, supported by NASA GRACE shallow groundwater remaining below the 5th percentile for many areas. Deterioration of drought was also observed in northwestern California, where 7-day precipitation was below-normal again this week. Widespread along the coastal ranges of northern California, USGS 28-day average stream flows are below the 5th percentile of the climatological distribution, with more having fallen into the bottom 1 percent of their respective distributions for the same period. Groundwater, soil moisture, and SWE are all below-normal and nearby reservoir levels are, on average, 50 percent of their historical averages as we begin transitioning into a drier time of year. Elsewhere in the Western Region, a low pressure system tracking eastward in the days leading up to March 22 produced enough precipitation and high elevation snowfall to stave off any further degradation this week. Some basins across the Four Corners region are even reporting near and above-normal seasonal snowpack following the event. However, more will be needed to curb long-term drought across these areas.
Caribbean
There is no change in this week’s drought depiction for Puerto Rico. Much of the island remains wet over the past 30 days. However, the past couple of weeks has been pretty dry and there are some isolated stream gauges starting to fall below-normal. So this is an area to watch in the coming weeks, given the long-term antecedent abnormal dryness (D0) and moderate drought (D1) already in place.
A high pressure ridge in the upper atmosphere promoted dry descending air across the U.S. Virgin Islands during this USDM week (March 16-22). Patches of moisture moving in the trade-wind flow brought showers to some areas. Satellite and radar-based estimates showed a fourth to half an inch of rain for the week. Measurements at USGS wells on all three islands showed groundwater levels continuing to decline. Since this is the dry season, widespread heavy rains were not expected and did not occur, so drought conditions were unchanged from last week.
On St. John, rain gauge weekly rainfall totals ranged from 0.69 inch to 0.85 inch. The Standardized Precipitation Index (SPI) showed D1 conditions at East End, although vegetation was green and the SPI was near normal on other parts of the island. The USGS Susannaberg DPW 3 Well at St. John has steadily declined over the last week and month with depth to water at 18.81 feet, which is the lowest level since 2017. Overall, D1-L continued for St. John.
On St. Thomas, weekly rainfall totals ranged from 0.16 inch to 0.89 inch. SPI values at King AP were at D1 levels at longer time scales (6 to 9 months). The USGS Grade School 3 Well at St. Thomas has steadily declined over the last week and month with depth to water at 12.97 feet. D2-L continued for St. Thomas this week, but conditions next week could improve to D1-L if widespread heavier rain falls.
Weekly rainfall totals on St. Croix ranged from 0.14 inch to 0.54 inch, although most weather stations reported a third of an inch or less. SPI values were dry at longer time scales (9 to 12 months), in the D1 range at Hamilton/Rohlsen AP and abnormally dry at East Hill. The USGS Adventure 28 Well at St. Croix has steadily declined over the last week and year with depth to water at 30.97 feet, which is the lowest level in the 2016-present record. D2-L continued for St. Croix this week, but like St. Thomas, conditions next week could improve to D1-L if widespread heavier rain falls.
Pacific
In Hawaii, moderate (D1) and severe (D2) drought expansion was warranted on the Big Island. Below-normal precipitation observed this week across nearly all areas is atypical of La Nina years, which typically favor wetter than normal conditions across the islands. Additionally, above-normal temperatures (3°F to 5°F above-normal) were observed, further exacerbating conditions. Stream flows remain below the 5th percentile for many locations and vegetation indices continue to decline. Pastures and forage are in poor shape and herds are being reduced as a result of the dry start to 2022, with many folks now resulting to supplemental feeding of livestock.
Rain generated by trade-wind troughs, surging trade winds, and the Inter-Tropical Convergence Zone (ITCZ) spread across much of Micronesia during this USDM week (March 16-22), with the heaviest rains over the southern portions. Satellite-based estimates (QPE) of 7-day rainfall indicated a band of 4 inches or more of rain along 5 degrees North latitude stretching from eastern Yap State to the southern Marshall Islands; this improved drought conditions in Chuuk State and the southern Marshalls. Lesser amounts of rain fell to the north, with the ITCZ rains not reaching the northern Marshall Islands. Abnormal dryness developed in northwestern Yap State, and extreme drought continued in the northern Marshall Islands. A high pressure ridge inhibited showers over American Samoa, where satellite QPE indicated about half an inch of rain fell.
The week was dry in the Marianas, with less than an inch of rain measured in the rain gauges at Guam (0.36 inch), Rota (0.37), and Saipan. Based on data available at the time of this analysis, 0.40 inch of rain was recorded at the Saipan ASOS station and 0.64 inch at the NPS automated station; the Saipan IAP had 0.10 inch but two days were missing. At least an inch of rain is required every week to meet most water needs in the Marianas. Guam remained critically dry. Fire weather increased on Guam, prompting the issuance of a Fire Weather Watch then Red Flag Warning for Friday through Tuesday; by Tuesday, March 22, the KBDI fire index had risen to 717, which is in the extreme category. D1-S continued on Guam and D0-S continued at Saipan and Rota.
Likewise, a weekly minimum of one inch of rain is required to meet most water needs in American Samoa. Less than an inch of rain was measured this week at Pago Pago (0.20 inch) and the automated stations at Siufaga Ridge (0.62) and Toa Ridge (0.53). But with last week and previous months wet, D-Nothing continued for Tutuila. Temperatures have been hot, with 90s reported most days this month at Pago Pago, and this week’s daytime maximum peaking at 94 degrees F on March 17.
For Palau, the Marshall Islands (RMI), and the Federated States of Micronesia (FSM), the weekly minimum required to meet most water needs is two inches. Airai recorded 1.97 inches of rain and the Koror COOP station 1.01 inch. But with the previous 3 weeks wet, D-Nothing continued in Palau.
Northwestern and extreme southern parts of the FSM were dry, with Yap reporting 0.19 inch of rain (but with 3 days missing), Ulithi 0.08 inch, Woleai 1.63 inches, and Kapingamarangi 0.97 inch. March-to-date has been wet, and previous weeks were wet, so D-Nothing continued at Kapingamarangi and Woleai. But abnormal dryness (D0-S) began at Yap, where this week marked the seventh consecutive dry week, and at Ulithi (4th consecutive dry week). The week was wet at the remaining stations, with rainfall totals ranging from 2.14 inches at Chuuk to 9.52 inches at Nukuoro and 8.07 inches at Kosrae. With 3.54 inches of rain this week, the drought status at Fananu was improved to D1-S. D0-S continued at Chuuk, and D-Nothing continued at the remaining locations.
In the RMI, no rain was measured at Wotje, leaving the monthly total at 1.80 inches and the island in extreme drought (D3-SL). Kwajalein was also dry with 0.82 inch of rain this week, staying at D0-S. But it was wet at the remaining stations, with weekly totals ranging from 2.56 inches at Ailinglaplap to 4.65 inches at Mili. Abnormal dryness ended at Ailinglaplap but continued at Majuro, while D-Nothing continued at Jaluit and Mili.
Looking Ahead
A storm system that brought heavy rainfall to eastern parts of the lower 48 states March 22-23 will continue to move northeastward and into the Great Lakes by Thursday, March 24. This storm will continue to bring the potential for rainfall across parts of the Southeast and Mid-Atlantic and mixed precipitation types across the Northeast and Great Lakes through Friday, March 25. By March 26, another fast-moving low pressure system is expected to sweep in behind the Great Lakes system to help push it out to sea by the weekend. Following the passage of these storm systems, colder air is likely across northeastern and north-central parts of the U.S., starting on March 26, with maximum temperature anomalies expected to be anywhere from 10°F to 20°F below-normal across parts of the Midwest. These cold temperatures will shift eastward toward the Northeast and Mid-Atlantic through March 29. Across the western U.S. high pressure is expected to dominate, favoring below-normal precipitation and above-normal temperatures through Monday, March 28. Maximum temperatures are predicted to be on the order of 15°F to 20°F above-normal, and greater, with the warmer temperatures shifting from the West Coast to the Great Plains and into the Southeast March 24-29, before beginning to moderate. On March 29, another storm system is predicted to move into the West Coast bringing an opportunity for much needed precipitation across portions of California.
The Climate Prediction Center’s 6-10 day outlook (valid March 29 to April 2, 2022) favors near to above-normal temperatures across much of the western and eastern contiguous U.S. (CONUS) and the Gulf Coast. Below-normal temperatures are favored for the north-central and northeastern CONUS, behind strong low pressure exiting the East Coast near the start of the period. Above-normal precipitation is favored for much of the eastern two-thirds of the CONUS, as a storm system is expected to intensify and move eastward across U.S. during the period. Behind this storm system and farther to its south, below-normal precipitation is likely across parts of the western CONUS and southern Texas, respectively.
Author(s):
Adam Hartman, NOAA/NWS/NCEP/CPC
Richard Heim, NOAA/NCEI
Dryness Categories
D0 Abnormally Dry—used for areas showing dryness but not yet in drought, or for areas recovering from drought.
Drought Intensity Categories
D1 Moderate Drought
D2 Severe Drought
D3 Extreme Drought
D4 Exceptional Drought
Drought or Dryness Types
S Short-term, typically less than 6 months (agriculture, grasslands)
L Long-term, typically more than 6 months (hydrology, ecology)
SL Area contains both short- and long-term impacts
Source: National Drought Mitigation Center
