


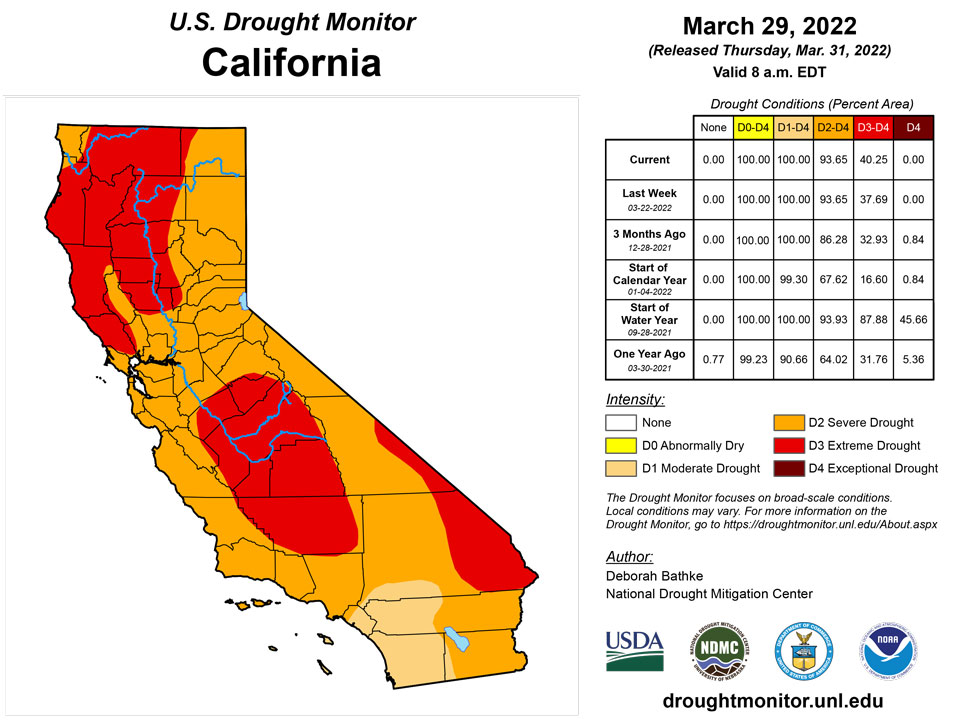
California and National Drought Summary for March 29, 2022
Summary
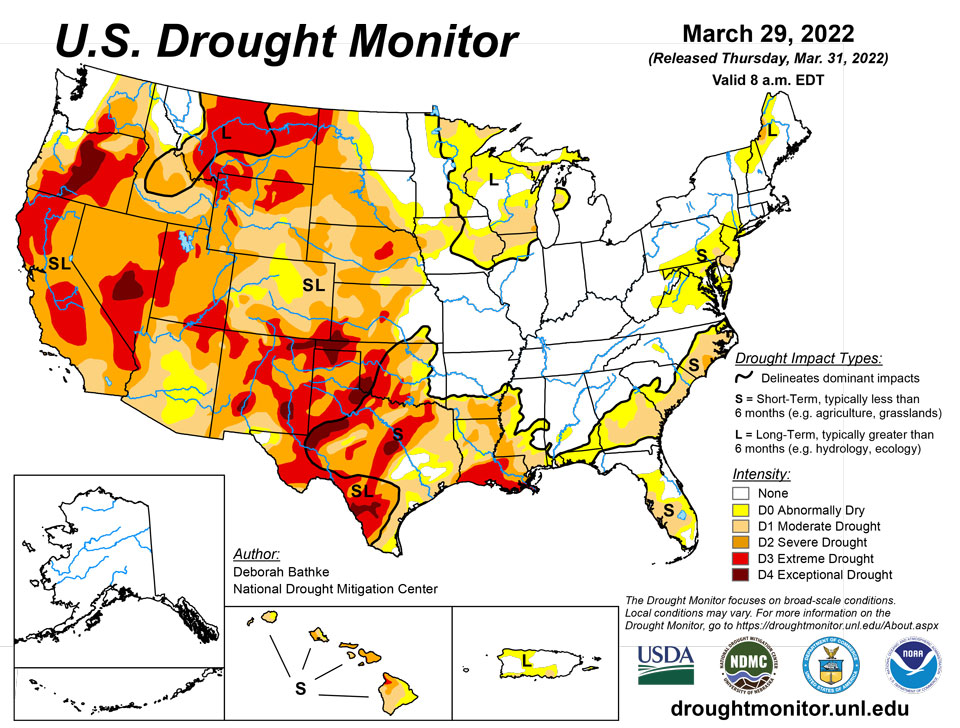
March 31, 2022 - Two fast-moving storms impacted the Lower 48 last week. Heavy rain fell across parts of the Midwest and South, leading to broad areas of drought improvement in these regions. Parts of the West saw much-needed rainfall. In most cases, these amounts were not enough to bring relief to the region’s relentless long-term drought conditions. Pockets of dryness also continued across the northern High Plains, South, and Southeast leading to drought expansion.
Northeast
Long-term drought has been slow to improve in the Northeast despite recent rains and cool weather. Abnormal dryness (D0) improved across parts of Maine, New Hampshire and Vermont, where above-normal precipitation helped improve moisture deficits. Stream flows are near- to above-normal and soil moisture indicators show improvement. Other areas of improvement include parts of the Delmarva Peninsula where recent rains eliminated short-term abnormal dryness (D0). Abnormal dryness expanded over parts of West Virginia and western Maryland where precipitation deficits, stream flow measurements and soil moisture conditions have fallen below normal.
Southeast
The southeast saw a mix of improvements and worsening short-term drought conditions. Rainfall totals from 1.5 to more than 3 inches brought relief to moderate drought in parts of coastal South Carolina and abnormally dry areas in North Carolina, Alabama and near the Georgia-Florida border. Precipitation indicators and stream flow measurements show improvements in these areas. Moderate drought expanded across a large swath of southern Georgia, an area that has continued to miss out on surplus rainfall. Pockets of abnormal dryness and/or drought expanded in consistently dry areas of North and South Carolina and southwest Alabama. Indicators supporting drought expansion in the southeast include 60-to-90-day precipitation deficits, declining soil moisture and below-normal stream flow.
South
This week the South saw drought worsen across west and south Texas and the Oklahoma Panhandle. Above-normal temperatures combined with below-normal precipitation and high winds exacerbated conditions. Drought indicators supporting the degradations include increasing precipitation deficits, dry surface and root zone soil moisture and low stream flow. State drought teams noted reports of blowing dust and crop failures in the area. Drought also expanded across southern Louisiana. This area has been in severe drought (D2) since March without any relief in weeks. One-category improvements were made to drought conditions across east Texas, southern Arkansas, north and central Louisiana and Mississippi in areas where the heaviest rain (3 inches or more) fell and where warranted by short-term precipitation indicators, streamflow, soil moisture and other measures.
Midwest
Above-normal precipitation combined with below temperatures led to improvements across much of the Midwest this week. Until recently, the region hadn’t had enough precipitation to warrant improvements to deficits that had been building since spring last year. Now, virtually all short-term drought has been eliminated. This is denoted by the removal of the S designation on the map. Long-term drought remains where precipitation deficits of 6 months or longer exist and where deeper soil moisture and groundwater indicators have yet to recover.
High Plains
Much of the High Plains remained dry last week resulting in deteriorating drought conditions across parts of the Dakotas and Nebraska. The eastern edges of abnormal dryness (D0) and moderate drought (D1) crept eastward. Severe drought (D2) expanded over a large swath from southwest North Dakota to central Nebraska. Extreme drought spread in central Nebraska. Short-term dryness is superimposed over long-term moisture deficits across the region. The lack of seasonal snow cover combined with the onset of spring has people in the region worried. Soil moisture is very low, stream flows continue to decline and state reports indicate that stock ponds are drying up.
West
Parts of the West saw much needed precipitation with rain over the West Coast and higher elevation snow over the Sierra Nevada Mountains. In most cases, these amounts were not enough to bring relief to drought conditions that have plagued the region for months. Only western Oregon saw minor improvements to abnormal dryness (D0) and moderate drought (D1) in response to recent precipitation. Across much of the West, higher than normal temperatures last week caused premature snow melt, with snowpack values plummeting over just a few days. The California Department of Water Resources noted that about one-third of the water equivalency disappeared in a week. Extreme drought (D3) expanded in northern California, parts of Utah, and New Mexico. In these locations, the warm weather has led to increased evaporative demand and stress on vegetation. The rest of the West remained unchanged this week.
Caribbean
In Puerto Rico, abnormal dryness (D0) expanded as precipitation deficits began to build and soil moisture, streamflow, and well data showed declining values.
A dry upper-level ridge inhibited precipitation across the U.S. Virgin Islands (USVI) during this USDM week (March 23-29). But enough moisture lingered over the region to support the development of showers triggered by afternoon heating. Satellite and radar-based analyses indicated less than half an inch of precipitation fell across the islands. Groundwater levels continued to fall on St. John and St. Croix, but leveled off on St. Thomas. A cold front was approaching the region as the week ended. Above-normal rainfall this week improved the drought status on St. Thomas, but no change was made to the depiction on St. Croix or St. John.
On St. John, 7-day rain gauge totals were about a third of an inch. This is below the weekly long-term average computed for the station at Windswept Beach. Month-to-date rainfall totals at the CoCoRaHS stations ranged from 2.08 inches to 2.57 inches. The Standardized Precipitation Index (SPI) was at D1 levels at the 6-month time scale. The groundwater level at the USGS Susannaberg DPW 3 Well at St. John has steadily declined over the last month, and continued to decline this week, with depth to water at 19.16 feet, which is the lowest level since 2017. D1-L continued for St. John.
Seven-day precipitation totals at CoCoRaHS stations on St. Thomas ranged from 0.16 inch to 0.72 inch. King AP recorded 0.61 inch, which is above normal. Monthly totals ranged from 1.65 inches to 3.74 inches. The value of 2.67 inches at King AP was 155% of normal for the month-to-date. The SPI at King AP was at D1 levels for the last 6 to 12 months. The rainfall total since the last big wet season system (8/25-3/28) is 17.14 inches, which is ninth driest for the period (16th percentile). The groundwater level at the USGS Grade School 3 Well at St. Thomas has held steady over the last week after steadily declining over the last month. D2-L was improved to D1-L for St. Thomas this week due to above-normal rainfall and moderating groundwater levels.
The CoCoRaHS weekly precipitation totals on St. Croix ranged from 0.13 to 0.86 inch, with about half of them below a third of an inch and half above. Month-to-date totals at the CoCoRaHS stations ranged from 2.13 to 3.69 inches, with most below 3.00 inches. The weather station at East Hill had 0.17 inch for the week, which is below normal, but 2.76 inches for the month to date, which is 193% of normal. Rohlsen AP reported 0.01 inch for the week and 0.81 inch for the month. The weekly total was below normal, and the monthly total was 54% of normal. The rainfall total since the last big wet season system (8/25-3/20) is 16.24 inches, which is 8th driest for the period (13th percentile). The SPI at Rohlsen AP and East Hill was in the D1 range at the 6- to 12-month time scales. The groundwater level at the USGS Adventure 28 Well at St. Croix has steadily declined over the last year, and continued to decline this week, with depth to water at 31.12 feet, which is the lowest level in the 2016-present record. D2-L continued for St. Croix.
Pacific
Alaska remained free of drought or abnormal dryness this week.
In Hawaii, Enhanced trade wind rainfall and thunderstorms last week brought much needed rainfall to some parts of the state. While this eased some windward drought, the leeward areas did not get much rainfall. As a result, drought has worsened on portions of the Big Island and Maui. On the Big Island, moderate (D1) and extreme (D3) drought expanded. Satellite data and rancher reports indicate extremely poor pasture conditions. In Maui, extreme drought (D3) expanded. In contrast, wet conditions in the middle of the week helped ease drought conditions along the windward slopes of Oahu and Kauai.
Several tropical weather features brought rain to parts of Micronesia during this USDM week (March 23-29). These included Inter-Tropical Convergence Zone (ITCZ) convection in the east, a near-equatorial trough in the west, and weak trade-wind troughs. An upper-level low, or TUTT cell, migrated westward across northern portions of the region; it enhanced showers over the Marshall Islands. The TUTT cell, along with a surface trough and cold front/shear line, triggered showers near the Marianas, but these systems did not produce much rain as they moved across the Marianas. Showers associated with the South Pacific Convergence Zone (SPCZ) moved northward across the Samoan Islands, giving Tutuila a wet week. Satellite-based analyses of 7-day precipitation (QPE) showed a band of 2+ inches of rain that stretched from the southern Marshall Islands (RMI) westward across the Federated States of Micronesia (FSM) to the Republic of Palau. Lesser amounts fell north and south of this band. The satellite QPE indicated over an inch of rain fell over Tutuila. Conditions improved with abnormal dryness ending in the southern RMI and northern Chuuk State, but abnormal dryness returned in southern Pohnpei State.
The week was wet in Palau and American Samoa. The weekly minimum precipitation required to meet most water needs is 2 inches in Palau and 1 inch in American Samoa. Airai received 1.92 inches for the week but Koror COOP station recorded 2.70 inches, and both stations had more than the monthly minimum of 8 inches, so D-Nothing continued in Palau. Pago Pago (2.80 inches) and the automated stations at Siufaga Ridge (2.16) and Toa Ridge (1.74) had more than the 1-inch weekly minimum, and all 3 stations were above the monthly minimum to date, so D-Nothing continued for Tutuila.
In the Marianas, less than half an inch of rain was recorded this week at Rota (0.23) and Saipan (0.17 inch at the ASOS gauge, 0.33 at the IAP, and 0.39 at the NPS station) and less than an inch fell at Guam (0.83). The weekly minimum is 1 inch for the Marianas. The month-to-date totals at Guam (1.82) and Rota (1.91) were below the monthly minimum for this time in the month. Reports indicate vegetation on Guam was brown in some areas but green in others, and wildfires have been fairly common in the hills of southern Guam. The KBDI (a fire drought index) reached into the extreme category (with a value of 738) by the end of the USDM week. Dry air, a high KBDI, and strong winds associated with the cold front/shear line created critical fire weather conditions on Guam, triggering the issuance of a fire weather watch and Red Flag Warning. D1-S continued on Guam and D0-S continued on Rota and Saipan.
In the FSM, weekly rain gauge totals in the ITCZ rainfall band ranged from 3.84 inches at Woleai to 6.05 inches at Nukuoro. D-Nothing continued at the locations within the band. To the south, Kapingamarangi had no measurable rain this week; with the last 3 weeks dry, D0-S was introduced at Kapingamarangi. To the north, Chuuk recorded 1.65 inches of rain this week, but had very wet conditions the 3 previous weeks and a wet month (13.36 inches for March so far), so D0-S ended. With a third of an inch of rain (based on data received) for the week and only 4.89 inches for the month, D1-S continued at Fananu. D0-S continued at Yap, which received 0.64 inch of rain this week, and Ulithi (0.81 inch). Lukunor had a dry week (0.59 inch) but a wet month-to-date (7.75 inches), so D-Nothing continued.
The southern Marshall Islands were in the wet ITCZ band, while the northern Marshalls were mostly dry. Wotje received 0.75 inch of rain for the week and 2.55 inches for the month so far, both of which are below their respective minimums. D3-SL continued for Wotje. D0-S ended at Kwajalein and Majuro, where the weekly rainfall totals were 3.87 and 7.26 inches, respectively, and month-to-date totals were 11.07 and 17.30 inches, respectively. With weekly totals over 3 inches, D-Nothing continued at Ailinglaplap (5.57 inches of rain for the week), Jaluit (7.35), and Mili (3.51). Monthly rainfall totals were over 15 inches at these three stations.
Looking Ahead
The National Weather Service Weather Prediction Center forecast (valid March 31 – April 7) calls for heavy rain and storms ahead of an advancing cold front extending from south of Lake Michigan to East Texas. Storms will progress eastward through the remainder of the week. The Northern Plains, Upper Midwest, and New England can expect snow/freezing rain. Heavy rain and mountain snow are expected from the Pacific Northwest to the Rockies. Moving into next week, the Climate Prediction Center Outlook (Valid April 7 – 13) favors above normal temperature for a large part of the West, extending from California across the Great Basin and into the southern Rockies. Meanwhile, near to above normal temperatures are favored for the Northeast and Eastern Seaboard. Below normal temperatures are expected over the eastern central CONUS. The outlook favors above normal precipitation across much of the northern tier of the Lower 48 and Alaska. Near to below normal precipitation is favored over southern areas of the West and the Southern and Central Plains.
Author(s):
Deborah Bathke, National Drought Mitigation Center
Richard Heim, NOAA/NCEI
Dryness Categories
D0 Abnormally Dry—used for areas showing dryness but not yet in drought, or for areas recovering from drought.
Drought Intensity Categories
D1 Moderate Drought
D2 Severe Drought
D3 Extreme Drought
D4 Exceptional Drought
Drought or Dryness Types
S Short-term, typically less than 6 months (agriculture, grasslands)
L Long-term, typically more than 6 months (hydrology, ecology)
SL Area contains both short- and long-term impacts
Source: National Drought Mitigation Center
